Free Statistics

of Irreproducible Research!

Author's title

Author*The author of this computation has been verified*
R Software Modulerwasp_smp.wasp
Title produced by softwareStandard Deviation-Mean Plot
Date of computationFri, 12 Dec 2008 05:36:48 -0700
Cite this page as followsStatistical Computations at FreeStatistics.org, Office for Research Development and Education, URL https://freestatistics.org/blog/index.php?v=date/2008/Dec/12/t1229085470vvnx1mr5u62yx0k.htm/, Retrieved Sat, 18 May 2024 06:53:09 +0000
Statistical Computations at FreeStatistics.org, Office for Research Development and Education, URL https://freestatistics.org/blog/index.php?pk=32633, Retrieved Sat, 18 May 2024 06:53:09 +0000
QR Codes:

Original text written by user:
IsPrivate?No (this computation is public)
User-defined keywords
Estimated Impact187
Family? (F = Feedback message, R = changed R code, M = changed R Module, P = changed Parameters, D = changed Data)
-     [Standard Deviation-Mean Plot] [] [2008-12-12 12:13:32] [fad8a251ac01c156a8ae23a83577546f]
-    D    [Standard Deviation-Mean Plot] [cons] [2008-12-12 12:36:48] [fa8b44cd657c07c6ee11bb2476ca3f8d] [Current]
Feedback Forum

Post a new message
Dataseries X:
99,3
98,7
107,9
101,0
97,6
103,0
94,1
94,1
115,1
116,5
103,4
112,5
95,6
97,5
119,3
100,9
97,7
115,3
92,8
99,2
118,7
110,1
110,3
112,9
102,2
99,4
116,1
103,8
101,8
113,7
89,7
99,5
122,9
108,6
114,4
110,5
104,1
103,6
121,6
101,1
116,0
120,1
96,0
105,0
124,7
123,9
123,6
114,8
108,8
106,1
123,2
106,2
115,2
120,6
109,5
114,4
121,4
129,5
124,3
112,6


Summary of computational transaction
Raw Inputview raw input (R code)
Raw Outputview raw output of R engine
Computing time1 seconds
R Server'Gwilym Jenkins' @ 72.249.127.135

\begin{tabular}{lllllllll}
\hline
Summary of computational transaction \tabularnewline
Raw Input & view raw input (R code)  \tabularnewline
Raw Output & view raw output of R engine  \tabularnewline
Computing time & 1 seconds \tabularnewline
R Server & 'Gwilym Jenkins' @ 72.249.127.135 \tabularnewline
\hline
\end{tabular}
%Source: https://freestatistics.org/blog/index.php?pk=32633&T=0

[TABLE]
[ROW][C]Summary of computational transaction[/C][/ROW]
[ROW][C]Raw Input[/C][C]view raw input (R code) [/C][/ROW]
[ROW][C]Raw Output[/C][C]view raw output of R engine [/C][/ROW]
[ROW][C]Computing time[/C][C]1 seconds[/C][/ROW]
[ROW][C]R Server[/C][C]'Gwilym Jenkins' @ 72.249.127.135[/C][/ROW]
[/TABLE]
Source: https://freestatistics.org/blog/index.php?pk=32633&T=0

Globally Unique Identifier (entire table): ba.freestatistics.org/blog/index.php?pk=32633&T=0

As an alternative you can also use a QR Code:  

The GUIDs for individual cells are displayed in the table below:

Summary of computational transaction
Raw Inputview raw input (R code)
Raw Outputview raw output of R engine
Computing time1 seconds
R Server'Gwilym Jenkins' @ 72.249.127.135


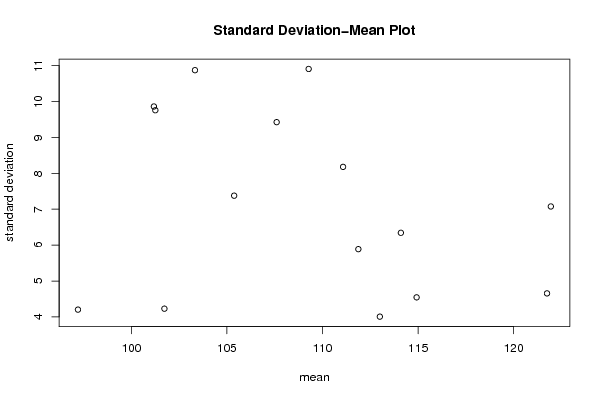
Standard Deviation-Mean Plot
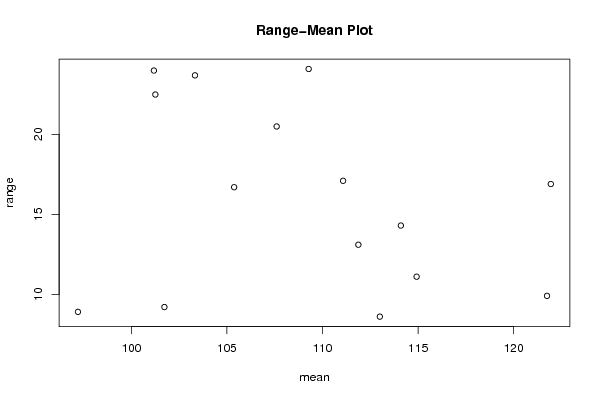
SectionMeanStandard DeviationRange
1101.7254.230346715499029.2
297.24.203966381089818.9
3111.8755.8880528756683813.1
4103.32510.873323625583223.7
5101.259.7572195493046722.5
61134.008324670815318.6
7105.3757.3776125316166216.7
8101.1759.8614992098902824
9114.16.344026061316814.3
10107.69.4251436770657920.5
11109.27510.907298779563524.1
12121.754.656536624287779.9
13111.0758.179394843140917.1
14114.9254.5456022703267811.1
15121.957.0769579151873816.9

\begin{tabular}{lllllllll}
\hline
Standard Deviation-Mean Plot \tabularnewline
Section & Mean & Standard Deviation & Range \tabularnewline
1 & 101.725 & 4.23034671549902 & 9.2 \tabularnewline
2 & 97.2 & 4.20396638108981 & 8.9 \tabularnewline
3 & 111.875 & 5.88805287566838 & 13.1 \tabularnewline
4 & 103.325 & 10.8733236255832 & 23.7 \tabularnewline
5 & 101.25 & 9.75721954930467 & 22.5 \tabularnewline
6 & 113 & 4.00832467081531 & 8.6 \tabularnewline
7 & 105.375 & 7.37761253161662 & 16.7 \tabularnewline
8 & 101.175 & 9.86149920989028 & 24 \tabularnewline
9 & 114.1 & 6.3440260613168 & 14.3 \tabularnewline
10 & 107.6 & 9.42514367706579 & 20.5 \tabularnewline
11 & 109.275 & 10.9072987795635 & 24.1 \tabularnewline
12 & 121.75 & 4.65653662428777 & 9.9 \tabularnewline
13 & 111.075 & 8.1793948431409 & 17.1 \tabularnewline
14 & 114.925 & 4.54560227032678 & 11.1 \tabularnewline
15 & 121.95 & 7.07695791518738 & 16.9 \tabularnewline
\hline
\end{tabular}
%Source: https://freestatistics.org/blog/index.php?pk=32633&T=1

[TABLE]
[ROW][C]Standard Deviation-Mean Plot[/C][/ROW]
[ROW][C]Section[/C][C]Mean[/C][C]Standard Deviation[/C][C]Range[/C][/ROW]
[ROW][C]1[/C][C]101.725[/C][C]4.23034671549902[/C][C]9.2[/C][/ROW]
[ROW][C]2[/C][C]97.2[/C][C]4.20396638108981[/C][C]8.9[/C][/ROW]
[ROW][C]3[/C][C]111.875[/C][C]5.88805287566838[/C][C]13.1[/C][/ROW]
[ROW][C]4[/C][C]103.325[/C][C]10.8733236255832[/C][C]23.7[/C][/ROW]
[ROW][C]5[/C][C]101.25[/C][C]9.75721954930467[/C][C]22.5[/C][/ROW]
[ROW][C]6[/C][C]113[/C][C]4.00832467081531[/C][C]8.6[/C][/ROW]
[ROW][C]7[/C][C]105.375[/C][C]7.37761253161662[/C][C]16.7[/C][/ROW]
[ROW][C]8[/C][C]101.175[/C][C]9.86149920989028[/C][C]24[/C][/ROW]
[ROW][C]9[/C][C]114.1[/C][C]6.3440260613168[/C][C]14.3[/C][/ROW]
[ROW][C]10[/C][C]107.6[/C][C]9.42514367706579[/C][C]20.5[/C][/ROW]
[ROW][C]11[/C][C]109.275[/C][C]10.9072987795635[/C][C]24.1[/C][/ROW]
[ROW][C]12[/C][C]121.75[/C][C]4.65653662428777[/C][C]9.9[/C][/ROW]
[ROW][C]13[/C][C]111.075[/C][C]8.1793948431409[/C][C]17.1[/C][/ROW]
[ROW][C]14[/C][C]114.925[/C][C]4.54560227032678[/C][C]11.1[/C][/ROW]
[ROW][C]15[/C][C]121.95[/C][C]7.07695791518738[/C][C]16.9[/C][/ROW]
[/TABLE]
Source: https://freestatistics.org/blog/index.php?pk=32633&T=1

Globally Unique Identifier (entire table): ba.freestatistics.org/blog/index.php?pk=32633&T=1

As an alternative you can also use a QR Code:  

The GUIDs for individual cells are displayed in the table below:

Standard Deviation-Mean Plot
SectionMeanStandard DeviationRange
1101.7254.230346715499029.2
297.24.203966381089818.9
3111.8755.8880528756683813.1
4103.32510.873323625583223.7
5101.259.7572195493046722.5
61134.008324670815318.6
7105.3757.3776125316166216.7
8101.1759.8614992098902824
9114.16.344026061316814.3
10107.69.4251436770657920.5
11109.27510.907298779563524.1
12121.754.656536624287779.9
13111.0758.179394843140917.1
14114.9254.5456022703267811.1
15121.957.0769579151873816.9


Regression: S.E.(k) = alpha + beta * Mean(k)
alpha17.7511985671256
beta-0.0971708686576963
S.D.0.0906282031162926
T-STAT-1.07219237849181
p-value0.303134926102617

\begin{tabular}{lllllllll}
\hline
Regression: S.E.(k) = alpha + beta * Mean(k) \tabularnewline
alpha & 17.7511985671256 \tabularnewline
beta & -0.0971708686576963 \tabularnewline
S.D. & 0.0906282031162926 \tabularnewline
T-STAT & -1.07219237849181 \tabularnewline
p-value & 0.303134926102617 \tabularnewline
\hline
\end{tabular}
%Source: https://freestatistics.org/blog/index.php?pk=32633&T=2

[TABLE]
[ROW][C]Regression: S.E.(k) = alpha + beta * Mean(k)[/C][/ROW]
[ROW][C]alpha[/C][C]17.7511985671256[/C][/ROW]
[ROW][C]beta[/C][C]-0.0971708686576963[/C][/ROW]
[ROW][C]S.D.[/C][C]0.0906282031162926[/C][/ROW]
[ROW][C]T-STAT[/C][C]-1.07219237849181[/C][/ROW]
[ROW][C]p-value[/C][C]0.303134926102617[/C][/ROW]
[/TABLE]
Source: https://freestatistics.org/blog/index.php?pk=32633&T=2

Globally Unique Identifier (entire table): ba.freestatistics.org/blog/index.php?pk=32633&T=2

As an alternative you can also use a QR Code:  

The GUIDs for individual cells are displayed in the table below:

Regression: S.E.(k) = alpha + beta * Mean(k)
alpha17.7511985671256
beta-0.0971708686576963
S.D.0.0906282031162926
T-STAT-1.07219237849181
p-value0.303134926102617


Regression: ln S.E.(k) = alpha + beta * ln Mean(k)
alpha7.58687050302402
beta-1.21150227533348
S.D.1.47096336084368
T-STAT-0.823611455990733
p-value0.425012685855508
Lambda2.21150227533348

\begin{tabular}{lllllllll}
\hline
Regression: ln S.E.(k) = alpha + beta * ln Mean(k) \tabularnewline
alpha & 7.58687050302402 \tabularnewline
beta & -1.21150227533348 \tabularnewline
S.D. & 1.47096336084368 \tabularnewline
T-STAT & -0.823611455990733 \tabularnewline
p-value & 0.425012685855508 \tabularnewline
Lambda & 2.21150227533348 \tabularnewline
\hline
\end{tabular}
%Source: https://freestatistics.org/blog/index.php?pk=32633&T=3

[TABLE]
[ROW][C]Regression: ln S.E.(k) = alpha + beta * ln Mean(k)[/C][/ROW]
[ROW][C]alpha[/C][C]7.58687050302402[/C][/ROW]
[ROW][C]beta[/C][C]-1.21150227533348[/C][/ROW]
[ROW][C]S.D.[/C][C]1.47096336084368[/C][/ROW]
[ROW][C]T-STAT[/C][C]-0.823611455990733[/C][/ROW]
[ROW][C]p-value[/C][C]0.425012685855508[/C][/ROW]
[ROW][C]Lambda[/C][C]2.21150227533348[/C][/ROW]
[/TABLE]
Source: https://freestatistics.org/blog/index.php?pk=32633&T=3

Globally Unique Identifier (entire table): ba.freestatistics.org/blog/index.php?pk=32633&T=3

As an alternative you can also use a QR Code:  

The GUIDs for individual cells are displayed in the table below:

Regression: ln S.E.(k) = alpha + beta * ln Mean(k)
alpha7.58687050302402
beta-1.21150227533348
S.D.1.47096336084368
T-STAT-0.823611455990733
p-value0.425012685855508
Lambda2.21150227533348


Parameters (Session):
par1 = 4 ;
Parameters (R input):
par1 = 4 ;
R code (references can be found in the software module):
par1 <- as.numeric(par1)
(n <- length(x))
(np <- floor(n / par1))
arr <- array(NA,dim=c(par1,np))
j <- 0
k <- 1
for (i in 1:(np*par1))
{
j = j + 1
arr[j,k] <- x[i]
if (j == par1) {
j = 0
k=k+1
}
}
arr
arr.mean <- array(NA,dim=np)
arr.sd <- array(NA,dim=np)
arr.range <- array(NA,dim=np)
for (j in 1:np)
{
arr.mean[j] <- mean(arr[,j],na.rm=TRUE)
arr.sd[j] <- sd(arr[,j],na.rm=TRUE)
arr.range[j] <- max(arr[,j],na.rm=TRUE) - min(arr[,j],na.rm=TRUE)
}
arr.mean
arr.sd
arr.range
(lm1 <- lm(arr.sd~arr.mean))
(lnlm1 <- lm(log(arr.sd)~log(arr.mean)))
(lm2 <- lm(arr.range~arr.mean))
bitmap(file='test1.png')
plot(arr.mean,arr.sd,main='Standard Deviation-Mean Plot',xlab='mean',ylab='standard deviation')
dev.off()
bitmap(file='test2.png')
plot(arr.mean,arr.range,main='Range-Mean Plot',xlab='mean',ylab='range')
dev.off()
load(file='createtable')
a<-table.start()
a<-table.row.start(a)
a<-table.element(a,'Standard Deviation-Mean Plot',4,TRUE)
a<-table.row.end(a)
a<-table.row.start(a)
a<-table.element(a,'Section',header=TRUE)
a<-table.element(a,'Mean',header=TRUE)
a<-table.element(a,'Standard Deviation',header=TRUE)
a<-table.element(a,'Range',header=TRUE)
a<-table.row.end(a)
for (j in 1:np) {
a<-table.row.start(a)
a<-table.element(a,j,header=TRUE)
a<-table.element(a,arr.mean[j])
a<-table.element(a,arr.sd[j] )
a<-table.element(a,arr.range[j] )
a<-table.row.end(a)
}
a<-table.end(a)
table.save(a,file='mytable.tab')
a<-table.start()
a<-table.row.start(a)
a<-table.element(a,'Regression: S.E.(k) = alpha + beta * Mean(k)',2,TRUE)
a<-table.row.end(a)
a<-table.row.start(a)
a<-table.element(a,'alpha',header=TRUE)
a<-table.element(a,lm1$coefficients[[1]])
a<-table.row.end(a)
a<-table.row.start(a)
a<-table.element(a,'beta',header=TRUE)
a<-table.element(a,lm1$coefficients[[2]])
a<-table.row.end(a)
a<-table.row.start(a)
a<-table.element(a,'S.D.',header=TRUE)
a<-table.element(a,summary(lm1)$coefficients[2,2])
a<-table.row.end(a)
a<-table.row.start(a)
a<-table.element(a,'T-STAT',header=TRUE)
a<-table.element(a,summary(lm1)$coefficients[2,3])
a<-table.row.end(a)
a<-table.row.start(a)
a<-table.element(a,'p-value',header=TRUE)
a<-table.element(a,summary(lm1)$coefficients[2,4])
a<-table.row.end(a)
a<-table.end(a)
table.save(a,file='mytable1.tab')
a<-table.start()
a<-table.row.start(a)
a<-table.element(a,'Regression: ln S.E.(k) = alpha + beta * ln Mean(k)',2,TRUE)
a<-table.row.end(a)
a<-table.row.start(a)
a<-table.element(a,'alpha',header=TRUE)
a<-table.element(a,lnlm1$coefficients[[1]])
a<-table.row.end(a)
a<-table.row.start(a)
a<-table.element(a,'beta',header=TRUE)
a<-table.element(a,lnlm1$coefficients[[2]])
a<-table.row.end(a)
a<-table.row.start(a)
a<-table.element(a,'S.D.',header=TRUE)
a<-table.element(a,summary(lnlm1)$coefficients[2,2])
a<-table.row.end(a)
a<-table.row.start(a)
a<-table.element(a,'T-STAT',header=TRUE)
a<-table.element(a,summary(lnlm1)$coefficients[2,3])
a<-table.row.end(a)
a<-table.row.start(a)
a<-table.element(a,'p-value',header=TRUE)
a<-table.element(a,summary(lnlm1)$coefficients[2,4])
a<-table.row.end(a)
a<-table.row.start(a)
a<-table.element(a,'Lambda',header=TRUE)
a<-table.element(a,1-lnlm1$coefficients[[2]])
a<-table.row.end(a)
a<-table.end(a)
table.save(a,file='mytable2.tab')