Free Statistics

of Irreproducible Research!

Author's title

Author*The author of this computation has been verified*
R Software Modulerwasp_autocorrelation.wasp
Title produced by software(Partial) Autocorrelation Function
Date of computationWed, 17 Dec 2008 11:57:05 -0700
Cite this page as followsStatistical Computations at FreeStatistics.org, Office for Research Development and Education, URL https://freestatistics.org/blog/index.php?v=date/2008/Dec/17/t1229540255448kptb45q8kx6g.htm/, Retrieved Sat, 18 May 2024 10:36:37 +0000
Statistical Computations at FreeStatistics.org, Office for Research Development and Education, URL https://freestatistics.org/blog/index.php?pk=34494, Retrieved Sat, 18 May 2024 10:36:37 +0000
QR Codes:

Original text written by user:
IsPrivate?No (this computation is public)
User-defined keywords
Estimated Impact233
Family? (F = Feedback message, R = changed R code, M = changed R Module, P = changed Parameters, D = changed Data)
-     [Pearson Correlation] [Correlation: inve...] [2008-12-16 19:18:46] [5161246d1ccc1b670cc664d03050f084]
- RMPD  [Univariate Data Series] [] [2008-12-17 14:56:45] [b98453cac15ba1066b407e146608df68]
- RMP       [(Partial) Autocorrelation Function] [] [2008-12-17 18:57:05] [d76b387543b13b5e3afd8ff9e5fdc89f] [Current]
Feedback Forum

Post a new message
Dataseries X:
1721
1476
1842
2171
1670
1540
1266
897
1266
1519
1074
1435
1385
1440
1883
1822
1661
1774
1133
1361
1688
2216
2896
1382
1330
1419
1662
2040
2126
1649
1610
1952
2102
1749
2091
3036
2414
2097
2705
2431
4192
3990
2854
1966
2431
2763
2831
2023
2934
2489
3252
3018
3193
3976
2584
2512
2169
2504
1843
1408
2179
3690
2372
2494
3872
2786
2312
1599
3167
3433
2648
1978
1947
3113
2856
3174
3507
4174
2978
4428
2832
2930
3681
3253
1660
2208
3139
3409
3445
2410
3262
2897
2526
3982
4097
3403
3362
2708
3129
3550
2696
2885
2945
3600
3808
3671
4005


Summary of computational transaction
Raw Inputview raw input (R code)
Raw Outputview raw output of R engine
Computing time2 seconds
R Server'Sir Ronald Aylmer Fisher' @ 193.190.124.24

\begin{tabular}{lllllllll}
\hline
Summary of computational transaction \tabularnewline
Raw Input & view raw input (R code)  \tabularnewline
Raw Output & view raw output of R engine  \tabularnewline
Computing time & 2 seconds \tabularnewline
R Server & 'Sir Ronald Aylmer Fisher' @ 193.190.124.24 \tabularnewline
\hline
\end{tabular}
%Source: https://freestatistics.org/blog/index.php?pk=34494&T=0

[TABLE]
[ROW][C]Summary of computational transaction[/C][/ROW]
[ROW][C]Raw Input[/C][C]view raw input (R code) [/C][/ROW]
[ROW][C]Raw Output[/C][C]view raw output of R engine [/C][/ROW]
[ROW][C]Computing time[/C][C]2 seconds[/C][/ROW]
[ROW][C]R Server[/C][C]'Sir Ronald Aylmer Fisher' @ 193.190.124.24[/C][/ROW]
[/TABLE]
Source: https://freestatistics.org/blog/index.php?pk=34494&T=0

Globally Unique Identifier (entire table): ba.freestatistics.org/blog/index.php?pk=34494&T=0

As an alternative you can also use a QR Code:  

The GUIDs for individual cells are displayed in the table below:

Summary of computational transaction
Raw Inputview raw input (R code)
Raw Outputview raw output of R engine
Computing time2 seconds
R Server'Sir Ronald Aylmer Fisher' @ 193.190.124.24


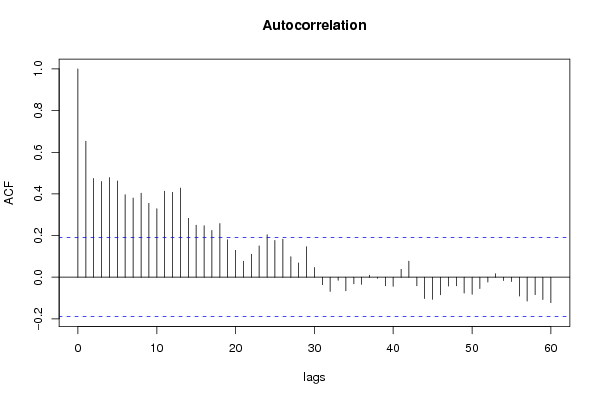
Autocorrelation Function
Time lag kACF(k)T-STATP-value
10.6526456.7510
20.4736264.89922e-06
30.4596574.75473e-06
40.4782714.94731e-06
50.4617544.77643e-06
60.3957674.09384.1e-05
70.3798033.92877.6e-05
80.4032174.17093.1e-05
90.3547673.66970.00019
100.3291423.40470.000467
110.4128814.27092.1e-05
120.4074934.21512.6e-05
130.4279864.42711.2e-05
140.282712.92440.002107
150.2498332.58430.005553
160.247262.55770.005969
170.2243112.32030.011111
180.2574252.66280.004473
190.179431.8560.0331
200.128831.33260.092742
210.0771020.79760.213448
220.1099851.13770.128894
230.1498321.54990.062062
240.2042992.11330.018451
250.1764351.82510.035391
260.182191.88460.0311
270.0982831.01660.155807
280.0680140.70350.241624
290.1463191.51350.066546
300.0467310.48340.314902
31-0.035837-0.37070.355796
32-0.068185-0.70530.241074
33-0.015241-0.15770.437513
34-0.065483-0.67740.249819
35-0.032056-0.33160.370423
36-0.034079-0.35250.362571
370.0099150.10260.459252
38-0.004976-0.05150.479524
39-0.041336-0.42760.334908
40-0.043931-0.45440.325222
410.0375580.38850.349206
420.0766120.79250.214918
43-0.041277-0.4270.335127
44-0.102043-1.05550.146777
45-0.106189-1.09840.137241
46-0.084028-0.86920.193343
47-0.042675-0.44140.329895
48-0.041661-0.43090.333687
49-0.0762-0.78820.216156
50-0.081775-0.84590.199752
51-0.05405-0.55910.288631
52-0.023543-0.24350.404028
530.0163010.16860.433206
54-0.015711-0.16250.435603
55-0.020784-0.2150.41509
56-0.090153-0.93260.176576
57-0.114123-1.18050.12021
58-0.083795-0.86680.193999
59-0.107203-1.10890.134975
60-0.12236-1.26570.104184

\begin{tabular}{lllllllll}
\hline
Autocorrelation Function \tabularnewline
Time lag k & ACF(k) & T-STAT & P-value \tabularnewline
1 & 0.652645 & 6.751 & 0 \tabularnewline
2 & 0.473626 & 4.8992 & 2e-06 \tabularnewline
3 & 0.459657 & 4.7547 & 3e-06 \tabularnewline
4 & 0.478271 & 4.9473 & 1e-06 \tabularnewline
5 & 0.461754 & 4.7764 & 3e-06 \tabularnewline
6 & 0.395767 & 4.0938 & 4.1e-05 \tabularnewline
7 & 0.379803 & 3.9287 & 7.6e-05 \tabularnewline
8 & 0.403217 & 4.1709 & 3.1e-05 \tabularnewline
9 & 0.354767 & 3.6697 & 0.00019 \tabularnewline
10 & 0.329142 & 3.4047 & 0.000467 \tabularnewline
11 & 0.412881 & 4.2709 & 2.1e-05 \tabularnewline
12 & 0.407493 & 4.2151 & 2.6e-05 \tabularnewline
13 & 0.427986 & 4.4271 & 1.2e-05 \tabularnewline
14 & 0.28271 & 2.9244 & 0.002107 \tabularnewline
15 & 0.249833 & 2.5843 & 0.005553 \tabularnewline
16 & 0.24726 & 2.5577 & 0.005969 \tabularnewline
17 & 0.224311 & 2.3203 & 0.011111 \tabularnewline
18 & 0.257425 & 2.6628 & 0.004473 \tabularnewline
19 & 0.17943 & 1.856 & 0.0331 \tabularnewline
20 & 0.12883 & 1.3326 & 0.092742 \tabularnewline
21 & 0.077102 & 0.7976 & 0.213448 \tabularnewline
22 & 0.109985 & 1.1377 & 0.128894 \tabularnewline
23 & 0.149832 & 1.5499 & 0.062062 \tabularnewline
24 & 0.204299 & 2.1133 & 0.018451 \tabularnewline
25 & 0.176435 & 1.8251 & 0.035391 \tabularnewline
26 & 0.18219 & 1.8846 & 0.0311 \tabularnewline
27 & 0.098283 & 1.0166 & 0.155807 \tabularnewline
28 & 0.068014 & 0.7035 & 0.241624 \tabularnewline
29 & 0.146319 & 1.5135 & 0.066546 \tabularnewline
30 & 0.046731 & 0.4834 & 0.314902 \tabularnewline
31 & -0.035837 & -0.3707 & 0.355796 \tabularnewline
32 & -0.068185 & -0.7053 & 0.241074 \tabularnewline
33 & -0.015241 & -0.1577 & 0.437513 \tabularnewline
34 & -0.065483 & -0.6774 & 0.249819 \tabularnewline
35 & -0.032056 & -0.3316 & 0.370423 \tabularnewline
36 & -0.034079 & -0.3525 & 0.362571 \tabularnewline
37 & 0.009915 & 0.1026 & 0.459252 \tabularnewline
38 & -0.004976 & -0.0515 & 0.479524 \tabularnewline
39 & -0.041336 & -0.4276 & 0.334908 \tabularnewline
40 & -0.043931 & -0.4544 & 0.325222 \tabularnewline
41 & 0.037558 & 0.3885 & 0.349206 \tabularnewline
42 & 0.076612 & 0.7925 & 0.214918 \tabularnewline
43 & -0.041277 & -0.427 & 0.335127 \tabularnewline
44 & -0.102043 & -1.0555 & 0.146777 \tabularnewline
45 & -0.106189 & -1.0984 & 0.137241 \tabularnewline
46 & -0.084028 & -0.8692 & 0.193343 \tabularnewline
47 & -0.042675 & -0.4414 & 0.329895 \tabularnewline
48 & -0.041661 & -0.4309 & 0.333687 \tabularnewline
49 & -0.0762 & -0.7882 & 0.216156 \tabularnewline
50 & -0.081775 & -0.8459 & 0.199752 \tabularnewline
51 & -0.05405 & -0.5591 & 0.288631 \tabularnewline
52 & -0.023543 & -0.2435 & 0.404028 \tabularnewline
53 & 0.016301 & 0.1686 & 0.433206 \tabularnewline
54 & -0.015711 & -0.1625 & 0.435603 \tabularnewline
55 & -0.020784 & -0.215 & 0.41509 \tabularnewline
56 & -0.090153 & -0.9326 & 0.176576 \tabularnewline
57 & -0.114123 & -1.1805 & 0.12021 \tabularnewline
58 & -0.083795 & -0.8668 & 0.193999 \tabularnewline
59 & -0.107203 & -1.1089 & 0.134975 \tabularnewline
60 & -0.12236 & -1.2657 & 0.104184 \tabularnewline
\hline
\end{tabular}
%Source: https://freestatistics.org/blog/index.php?pk=34494&T=1

[TABLE]
[ROW][C]Autocorrelation Function[/C][/ROW]
[ROW][C]Time lag k[/C][C]ACF(k)[/C][C]T-STAT[/C][C]P-value[/C][/ROW]
[ROW][C]1[/C][C]0.652645[/C][C]6.751[/C][C]0[/C][/ROW]
[ROW][C]2[/C][C]0.473626[/C][C]4.8992[/C][C]2e-06[/C][/ROW]
[ROW][C]3[/C][C]0.459657[/C][C]4.7547[/C][C]3e-06[/C][/ROW]
[ROW][C]4[/C][C]0.478271[/C][C]4.9473[/C][C]1e-06[/C][/ROW]
[ROW][C]5[/C][C]0.461754[/C][C]4.7764[/C][C]3e-06[/C][/ROW]
[ROW][C]6[/C][C]0.395767[/C][C]4.0938[/C][C]4.1e-05[/C][/ROW]
[ROW][C]7[/C][C]0.379803[/C][C]3.9287[/C][C]7.6e-05[/C][/ROW]
[ROW][C]8[/C][C]0.403217[/C][C]4.1709[/C][C]3.1e-05[/C][/ROW]
[ROW][C]9[/C][C]0.354767[/C][C]3.6697[/C][C]0.00019[/C][/ROW]
[ROW][C]10[/C][C]0.329142[/C][C]3.4047[/C][C]0.000467[/C][/ROW]
[ROW][C]11[/C][C]0.412881[/C][C]4.2709[/C][C]2.1e-05[/C][/ROW]
[ROW][C]12[/C][C]0.407493[/C][C]4.2151[/C][C]2.6e-05[/C][/ROW]
[ROW][C]13[/C][C]0.427986[/C][C]4.4271[/C][C]1.2e-05[/C][/ROW]
[ROW][C]14[/C][C]0.28271[/C][C]2.9244[/C][C]0.002107[/C][/ROW]
[ROW][C]15[/C][C]0.249833[/C][C]2.5843[/C][C]0.005553[/C][/ROW]
[ROW][C]16[/C][C]0.24726[/C][C]2.5577[/C][C]0.005969[/C][/ROW]
[ROW][C]17[/C][C]0.224311[/C][C]2.3203[/C][C]0.011111[/C][/ROW]
[ROW][C]18[/C][C]0.257425[/C][C]2.6628[/C][C]0.004473[/C][/ROW]
[ROW][C]19[/C][C]0.17943[/C][C]1.856[/C][C]0.0331[/C][/ROW]
[ROW][C]20[/C][C]0.12883[/C][C]1.3326[/C][C]0.092742[/C][/ROW]
[ROW][C]21[/C][C]0.077102[/C][C]0.7976[/C][C]0.213448[/C][/ROW]
[ROW][C]22[/C][C]0.109985[/C][C]1.1377[/C][C]0.128894[/C][/ROW]
[ROW][C]23[/C][C]0.149832[/C][C]1.5499[/C][C]0.062062[/C][/ROW]
[ROW][C]24[/C][C]0.204299[/C][C]2.1133[/C][C]0.018451[/C][/ROW]
[ROW][C]25[/C][C]0.176435[/C][C]1.8251[/C][C]0.035391[/C][/ROW]
[ROW][C]26[/C][C]0.18219[/C][C]1.8846[/C][C]0.0311[/C][/ROW]
[ROW][C]27[/C][C]0.098283[/C][C]1.0166[/C][C]0.155807[/C][/ROW]
[ROW][C]28[/C][C]0.068014[/C][C]0.7035[/C][C]0.241624[/C][/ROW]
[ROW][C]29[/C][C]0.146319[/C][C]1.5135[/C][C]0.066546[/C][/ROW]
[ROW][C]30[/C][C]0.046731[/C][C]0.4834[/C][C]0.314902[/C][/ROW]
[ROW][C]31[/C][C]-0.035837[/C][C]-0.3707[/C][C]0.355796[/C][/ROW]
[ROW][C]32[/C][C]-0.068185[/C][C]-0.7053[/C][C]0.241074[/C][/ROW]
[ROW][C]33[/C][C]-0.015241[/C][C]-0.1577[/C][C]0.437513[/C][/ROW]
[ROW][C]34[/C][C]-0.065483[/C][C]-0.6774[/C][C]0.249819[/C][/ROW]
[ROW][C]35[/C][C]-0.032056[/C][C]-0.3316[/C][C]0.370423[/C][/ROW]
[ROW][C]36[/C][C]-0.034079[/C][C]-0.3525[/C][C]0.362571[/C][/ROW]
[ROW][C]37[/C][C]0.009915[/C][C]0.1026[/C][C]0.459252[/C][/ROW]
[ROW][C]38[/C][C]-0.004976[/C][C]-0.0515[/C][C]0.479524[/C][/ROW]
[ROW][C]39[/C][C]-0.041336[/C][C]-0.4276[/C][C]0.334908[/C][/ROW]
[ROW][C]40[/C][C]-0.043931[/C][C]-0.4544[/C][C]0.325222[/C][/ROW]
[ROW][C]41[/C][C]0.037558[/C][C]0.3885[/C][C]0.349206[/C][/ROW]
[ROW][C]42[/C][C]0.076612[/C][C]0.7925[/C][C]0.214918[/C][/ROW]
[ROW][C]43[/C][C]-0.041277[/C][C]-0.427[/C][C]0.335127[/C][/ROW]
[ROW][C]44[/C][C]-0.102043[/C][C]-1.0555[/C][C]0.146777[/C][/ROW]
[ROW][C]45[/C][C]-0.106189[/C][C]-1.0984[/C][C]0.137241[/C][/ROW]
[ROW][C]46[/C][C]-0.084028[/C][C]-0.8692[/C][C]0.193343[/C][/ROW]
[ROW][C]47[/C][C]-0.042675[/C][C]-0.4414[/C][C]0.329895[/C][/ROW]
[ROW][C]48[/C][C]-0.041661[/C][C]-0.4309[/C][C]0.333687[/C][/ROW]
[ROW][C]49[/C][C]-0.0762[/C][C]-0.7882[/C][C]0.216156[/C][/ROW]
[ROW][C]50[/C][C]-0.081775[/C][C]-0.8459[/C][C]0.199752[/C][/ROW]
[ROW][C]51[/C][C]-0.05405[/C][C]-0.5591[/C][C]0.288631[/C][/ROW]
[ROW][C]52[/C][C]-0.023543[/C][C]-0.2435[/C][C]0.404028[/C][/ROW]
[ROW][C]53[/C][C]0.016301[/C][C]0.1686[/C][C]0.433206[/C][/ROW]
[ROW][C]54[/C][C]-0.015711[/C][C]-0.1625[/C][C]0.435603[/C][/ROW]
[ROW][C]55[/C][C]-0.020784[/C][C]-0.215[/C][C]0.41509[/C][/ROW]
[ROW][C]56[/C][C]-0.090153[/C][C]-0.9326[/C][C]0.176576[/C][/ROW]
[ROW][C]57[/C][C]-0.114123[/C][C]-1.1805[/C][C]0.12021[/C][/ROW]
[ROW][C]58[/C][C]-0.083795[/C][C]-0.8668[/C][C]0.193999[/C][/ROW]
[ROW][C]59[/C][C]-0.107203[/C][C]-1.1089[/C][C]0.134975[/C][/ROW]
[ROW][C]60[/C][C]-0.12236[/C][C]-1.2657[/C][C]0.104184[/C][/ROW]
[/TABLE]
Source: https://freestatistics.org/blog/index.php?pk=34494&T=1

Globally Unique Identifier (entire table): ba.freestatistics.org/blog/index.php?pk=34494&T=1

As an alternative you can also use a QR Code:  

The GUIDs for individual cells are displayed in the table below:

Autocorrelation Function
Time lag kACF(k)T-STATP-value
10.6526456.7510
20.4736264.89922e-06
30.4596574.75473e-06
40.4782714.94731e-06
50.4617544.77643e-06
60.3957674.09384.1e-05
70.3798033.92877.6e-05
80.4032174.17093.1e-05
90.3547673.66970.00019
100.3291423.40470.000467
110.4128814.27092.1e-05
120.4074934.21512.6e-05
130.4279864.42711.2e-05
140.282712.92440.002107
150.2498332.58430.005553
160.247262.55770.005969
170.2243112.32030.011111
180.2574252.66280.004473
190.179431.8560.0331
200.128831.33260.092742
210.0771020.79760.213448
220.1099851.13770.128894
230.1498321.54990.062062
240.2042992.11330.018451
250.1764351.82510.035391
260.182191.88460.0311
270.0982831.01660.155807
280.0680140.70350.241624
290.1463191.51350.066546
300.0467310.48340.314902
31-0.035837-0.37070.355796
32-0.068185-0.70530.241074
33-0.015241-0.15770.437513
34-0.065483-0.67740.249819
35-0.032056-0.33160.370423
36-0.034079-0.35250.362571
370.0099150.10260.459252
38-0.004976-0.05150.479524
39-0.041336-0.42760.334908
40-0.043931-0.45440.325222
410.0375580.38850.349206
420.0766120.79250.214918
43-0.041277-0.4270.335127
44-0.102043-1.05550.146777
45-0.106189-1.09840.137241
46-0.084028-0.86920.193343
47-0.042675-0.44140.329895
48-0.041661-0.43090.333687
49-0.0762-0.78820.216156
50-0.081775-0.84590.199752
51-0.05405-0.55910.288631
52-0.023543-0.24350.404028
530.0163010.16860.433206
54-0.015711-0.16250.435603
55-0.020784-0.2150.41509
56-0.090153-0.93260.176576
57-0.114123-1.18050.12021
58-0.083795-0.86680.193999
59-0.107203-1.10890.134975
60-0.12236-1.26570.104184


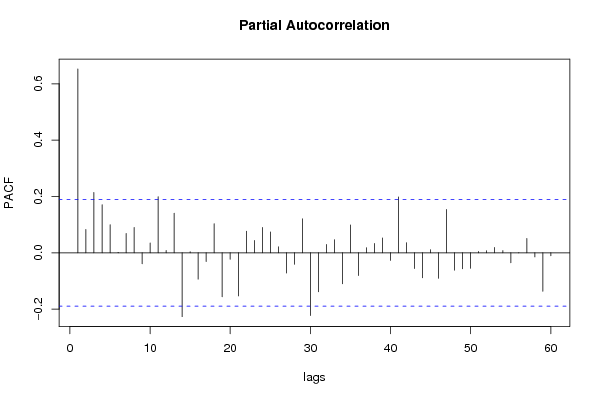
Partial Autocorrelation Function
Time lag kPACF(k)T-STATP-value
10.6526456.7510
20.0830610.85920.196079
30.2140232.21390.01448
40.1709751.76860.039907
50.0999211.03360.151829
60.001650.01710.493205
70.0683340.70690.240598
80.0902450.93350.176331
9-0.039209-0.40560.342931
100.0346350.35830.360423
110.1992152.06070.020878
120.0082560.08540.466052
130.1405111.45350.074512
14-0.226663-2.34460.010446
150.0038380.03970.484202
16-0.093563-0.96780.167658
17-0.031287-0.32360.373425
180.1029641.06510.14462
19-0.156031-1.6140.054737
20-0.023012-0.2380.406153
21-0.152927-1.58190.058313
220.0764330.79060.215456
230.0440780.45590.324676
240.090250.93360.176317
250.0740310.76580.222744
260.0210510.21780.414017
27-0.072145-0.74630.228571
28-0.040628-0.42030.337568
290.120431.24570.107792
30-0.222827-2.30490.01155
31-0.138364-1.43120.077637
320.0296320.30650.379903
330.0462490.47840.31667
34-0.110202-1.13990.128429
350.098671.02070.15486
36-0.08048-0.83250.203493
370.0181170.18740.42585
380.0327990.33930.367534
390.0525190.54330.29404
40-0.026933-0.27860.390545
410.1979682.04780.021515
420.035710.36940.356283
43-0.05565-0.57560.283032
44-0.08874-0.91790.180358
450.0110720.11450.454515
46-0.090552-0.93670.175516
470.1538191.59110.057267
48-0.06164-0.63760.262545
49-0.056877-0.58830.27877
50-0.05467-0.56550.286454
510.0045710.04730.481189
520.0074230.07680.469469
530.0191860.19850.421532
540.007930.0820.467388
55-0.035736-0.36970.356186
56-0.000553-0.00570.497721
570.0511630.52920.298868
58-0.014554-0.15050.440309
59-0.136658-1.41360.08019
60-0.010313-0.10670.457623

\begin{tabular}{lllllllll}
\hline
Partial Autocorrelation Function \tabularnewline
Time lag k & PACF(k) & T-STAT & P-value \tabularnewline
1 & 0.652645 & 6.751 & 0 \tabularnewline
2 & 0.083061 & 0.8592 & 0.196079 \tabularnewline
3 & 0.214023 & 2.2139 & 0.01448 \tabularnewline
4 & 0.170975 & 1.7686 & 0.039907 \tabularnewline
5 & 0.099921 & 1.0336 & 0.151829 \tabularnewline
6 & 0.00165 & 0.0171 & 0.493205 \tabularnewline
7 & 0.068334 & 0.7069 & 0.240598 \tabularnewline
8 & 0.090245 & 0.9335 & 0.176331 \tabularnewline
9 & -0.039209 & -0.4056 & 0.342931 \tabularnewline
10 & 0.034635 & 0.3583 & 0.360423 \tabularnewline
11 & 0.199215 & 2.0607 & 0.020878 \tabularnewline
12 & 0.008256 & 0.0854 & 0.466052 \tabularnewline
13 & 0.140511 & 1.4535 & 0.074512 \tabularnewline
14 & -0.226663 & -2.3446 & 0.010446 \tabularnewline
15 & 0.003838 & 0.0397 & 0.484202 \tabularnewline
16 & -0.093563 & -0.9678 & 0.167658 \tabularnewline
17 & -0.031287 & -0.3236 & 0.373425 \tabularnewline
18 & 0.102964 & 1.0651 & 0.14462 \tabularnewline
19 & -0.156031 & -1.614 & 0.054737 \tabularnewline
20 & -0.023012 & -0.238 & 0.406153 \tabularnewline
21 & -0.152927 & -1.5819 & 0.058313 \tabularnewline
22 & 0.076433 & 0.7906 & 0.215456 \tabularnewline
23 & 0.044078 & 0.4559 & 0.324676 \tabularnewline
24 & 0.09025 & 0.9336 & 0.176317 \tabularnewline
25 & 0.074031 & 0.7658 & 0.222744 \tabularnewline
26 & 0.021051 & 0.2178 & 0.414017 \tabularnewline
27 & -0.072145 & -0.7463 & 0.228571 \tabularnewline
28 & -0.040628 & -0.4203 & 0.337568 \tabularnewline
29 & 0.12043 & 1.2457 & 0.107792 \tabularnewline
30 & -0.222827 & -2.3049 & 0.01155 \tabularnewline
31 & -0.138364 & -1.4312 & 0.077637 \tabularnewline
32 & 0.029632 & 0.3065 & 0.379903 \tabularnewline
33 & 0.046249 & 0.4784 & 0.31667 \tabularnewline
34 & -0.110202 & -1.1399 & 0.128429 \tabularnewline
35 & 0.09867 & 1.0207 & 0.15486 \tabularnewline
36 & -0.08048 & -0.8325 & 0.203493 \tabularnewline
37 & 0.018117 & 0.1874 & 0.42585 \tabularnewline
38 & 0.032799 & 0.3393 & 0.367534 \tabularnewline
39 & 0.052519 & 0.5433 & 0.29404 \tabularnewline
40 & -0.026933 & -0.2786 & 0.390545 \tabularnewline
41 & 0.197968 & 2.0478 & 0.021515 \tabularnewline
42 & 0.03571 & 0.3694 & 0.356283 \tabularnewline
43 & -0.05565 & -0.5756 & 0.283032 \tabularnewline
44 & -0.08874 & -0.9179 & 0.180358 \tabularnewline
45 & 0.011072 & 0.1145 & 0.454515 \tabularnewline
46 & -0.090552 & -0.9367 & 0.175516 \tabularnewline
47 & 0.153819 & 1.5911 & 0.057267 \tabularnewline
48 & -0.06164 & -0.6376 & 0.262545 \tabularnewline
49 & -0.056877 & -0.5883 & 0.27877 \tabularnewline
50 & -0.05467 & -0.5655 & 0.286454 \tabularnewline
51 & 0.004571 & 0.0473 & 0.481189 \tabularnewline
52 & 0.007423 & 0.0768 & 0.469469 \tabularnewline
53 & 0.019186 & 0.1985 & 0.421532 \tabularnewline
54 & 0.00793 & 0.082 & 0.467388 \tabularnewline
55 & -0.035736 & -0.3697 & 0.356186 \tabularnewline
56 & -0.000553 & -0.0057 & 0.497721 \tabularnewline
57 & 0.051163 & 0.5292 & 0.298868 \tabularnewline
58 & -0.014554 & -0.1505 & 0.440309 \tabularnewline
59 & -0.136658 & -1.4136 & 0.08019 \tabularnewline
60 & -0.010313 & -0.1067 & 0.457623 \tabularnewline
\hline
\end{tabular}
%Source: https://freestatistics.org/blog/index.php?pk=34494&T=2

[TABLE]
[ROW][C]Partial Autocorrelation Function[/C][/ROW]
[ROW][C]Time lag k[/C][C]PACF(k)[/C][C]T-STAT[/C][C]P-value[/C][/ROW]
[ROW][C]1[/C][C]0.652645[/C][C]6.751[/C][C]0[/C][/ROW]
[ROW][C]2[/C][C]0.083061[/C][C]0.8592[/C][C]0.196079[/C][/ROW]
[ROW][C]3[/C][C]0.214023[/C][C]2.2139[/C][C]0.01448[/C][/ROW]
[ROW][C]4[/C][C]0.170975[/C][C]1.7686[/C][C]0.039907[/C][/ROW]
[ROW][C]5[/C][C]0.099921[/C][C]1.0336[/C][C]0.151829[/C][/ROW]
[ROW][C]6[/C][C]0.00165[/C][C]0.0171[/C][C]0.493205[/C][/ROW]
[ROW][C]7[/C][C]0.068334[/C][C]0.7069[/C][C]0.240598[/C][/ROW]
[ROW][C]8[/C][C]0.090245[/C][C]0.9335[/C][C]0.176331[/C][/ROW]
[ROW][C]9[/C][C]-0.039209[/C][C]-0.4056[/C][C]0.342931[/C][/ROW]
[ROW][C]10[/C][C]0.034635[/C][C]0.3583[/C][C]0.360423[/C][/ROW]
[ROW][C]11[/C][C]0.199215[/C][C]2.0607[/C][C]0.020878[/C][/ROW]
[ROW][C]12[/C][C]0.008256[/C][C]0.0854[/C][C]0.466052[/C][/ROW]
[ROW][C]13[/C][C]0.140511[/C][C]1.4535[/C][C]0.074512[/C][/ROW]
[ROW][C]14[/C][C]-0.226663[/C][C]-2.3446[/C][C]0.010446[/C][/ROW]
[ROW][C]15[/C][C]0.003838[/C][C]0.0397[/C][C]0.484202[/C][/ROW]
[ROW][C]16[/C][C]-0.093563[/C][C]-0.9678[/C][C]0.167658[/C][/ROW]
[ROW][C]17[/C][C]-0.031287[/C][C]-0.3236[/C][C]0.373425[/C][/ROW]
[ROW][C]18[/C][C]0.102964[/C][C]1.0651[/C][C]0.14462[/C][/ROW]
[ROW][C]19[/C][C]-0.156031[/C][C]-1.614[/C][C]0.054737[/C][/ROW]
[ROW][C]20[/C][C]-0.023012[/C][C]-0.238[/C][C]0.406153[/C][/ROW]
[ROW][C]21[/C][C]-0.152927[/C][C]-1.5819[/C][C]0.058313[/C][/ROW]
[ROW][C]22[/C][C]0.076433[/C][C]0.7906[/C][C]0.215456[/C][/ROW]
[ROW][C]23[/C][C]0.044078[/C][C]0.4559[/C][C]0.324676[/C][/ROW]
[ROW][C]24[/C][C]0.09025[/C][C]0.9336[/C][C]0.176317[/C][/ROW]
[ROW][C]25[/C][C]0.074031[/C][C]0.7658[/C][C]0.222744[/C][/ROW]
[ROW][C]26[/C][C]0.021051[/C][C]0.2178[/C][C]0.414017[/C][/ROW]
[ROW][C]27[/C][C]-0.072145[/C][C]-0.7463[/C][C]0.228571[/C][/ROW]
[ROW][C]28[/C][C]-0.040628[/C][C]-0.4203[/C][C]0.337568[/C][/ROW]
[ROW][C]29[/C][C]0.12043[/C][C]1.2457[/C][C]0.107792[/C][/ROW]
[ROW][C]30[/C][C]-0.222827[/C][C]-2.3049[/C][C]0.01155[/C][/ROW]
[ROW][C]31[/C][C]-0.138364[/C][C]-1.4312[/C][C]0.077637[/C][/ROW]
[ROW][C]32[/C][C]0.029632[/C][C]0.3065[/C][C]0.379903[/C][/ROW]
[ROW][C]33[/C][C]0.046249[/C][C]0.4784[/C][C]0.31667[/C][/ROW]
[ROW][C]34[/C][C]-0.110202[/C][C]-1.1399[/C][C]0.128429[/C][/ROW]
[ROW][C]35[/C][C]0.09867[/C][C]1.0207[/C][C]0.15486[/C][/ROW]
[ROW][C]36[/C][C]-0.08048[/C][C]-0.8325[/C][C]0.203493[/C][/ROW]
[ROW][C]37[/C][C]0.018117[/C][C]0.1874[/C][C]0.42585[/C][/ROW]
[ROW][C]38[/C][C]0.032799[/C][C]0.3393[/C][C]0.367534[/C][/ROW]
[ROW][C]39[/C][C]0.052519[/C][C]0.5433[/C][C]0.29404[/C][/ROW]
[ROW][C]40[/C][C]-0.026933[/C][C]-0.2786[/C][C]0.390545[/C][/ROW]
[ROW][C]41[/C][C]0.197968[/C][C]2.0478[/C][C]0.021515[/C][/ROW]
[ROW][C]42[/C][C]0.03571[/C][C]0.3694[/C][C]0.356283[/C][/ROW]
[ROW][C]43[/C][C]-0.05565[/C][C]-0.5756[/C][C]0.283032[/C][/ROW]
[ROW][C]44[/C][C]-0.08874[/C][C]-0.9179[/C][C]0.180358[/C][/ROW]
[ROW][C]45[/C][C]0.011072[/C][C]0.1145[/C][C]0.454515[/C][/ROW]
[ROW][C]46[/C][C]-0.090552[/C][C]-0.9367[/C][C]0.175516[/C][/ROW]
[ROW][C]47[/C][C]0.153819[/C][C]1.5911[/C][C]0.057267[/C][/ROW]
[ROW][C]48[/C][C]-0.06164[/C][C]-0.6376[/C][C]0.262545[/C][/ROW]
[ROW][C]49[/C][C]-0.056877[/C][C]-0.5883[/C][C]0.27877[/C][/ROW]
[ROW][C]50[/C][C]-0.05467[/C][C]-0.5655[/C][C]0.286454[/C][/ROW]
[ROW][C]51[/C][C]0.004571[/C][C]0.0473[/C][C]0.481189[/C][/ROW]
[ROW][C]52[/C][C]0.007423[/C][C]0.0768[/C][C]0.469469[/C][/ROW]
[ROW][C]53[/C][C]0.019186[/C][C]0.1985[/C][C]0.421532[/C][/ROW]
[ROW][C]54[/C][C]0.00793[/C][C]0.082[/C][C]0.467388[/C][/ROW]
[ROW][C]55[/C][C]-0.035736[/C][C]-0.3697[/C][C]0.356186[/C][/ROW]
[ROW][C]56[/C][C]-0.000553[/C][C]-0.0057[/C][C]0.497721[/C][/ROW]
[ROW][C]57[/C][C]0.051163[/C][C]0.5292[/C][C]0.298868[/C][/ROW]
[ROW][C]58[/C][C]-0.014554[/C][C]-0.1505[/C][C]0.440309[/C][/ROW]
[ROW][C]59[/C][C]-0.136658[/C][C]-1.4136[/C][C]0.08019[/C][/ROW]
[ROW][C]60[/C][C]-0.010313[/C][C]-0.1067[/C][C]0.457623[/C][/ROW]
[/TABLE]
Source: https://freestatistics.org/blog/index.php?pk=34494&T=2

Globally Unique Identifier (entire table): ba.freestatistics.org/blog/index.php?pk=34494&T=2

As an alternative you can also use a QR Code:  

The GUIDs for individual cells are displayed in the table below:

Partial Autocorrelation Function
Time lag kPACF(k)T-STATP-value
10.6526456.7510
20.0830610.85920.196079
30.2140232.21390.01448
40.1709751.76860.039907
50.0999211.03360.151829
60.001650.01710.493205
70.0683340.70690.240598
80.0902450.93350.176331
9-0.039209-0.40560.342931
100.0346350.35830.360423
110.1992152.06070.020878
120.0082560.08540.466052
130.1405111.45350.074512
14-0.226663-2.34460.010446
150.0038380.03970.484202
16-0.093563-0.96780.167658
17-0.031287-0.32360.373425
180.1029641.06510.14462
19-0.156031-1.6140.054737
20-0.023012-0.2380.406153
21-0.152927-1.58190.058313
220.0764330.79060.215456
230.0440780.45590.324676
240.090250.93360.176317
250.0740310.76580.222744
260.0210510.21780.414017
27-0.072145-0.74630.228571
28-0.040628-0.42030.337568
290.120431.24570.107792
30-0.222827-2.30490.01155
31-0.138364-1.43120.077637
320.0296320.30650.379903
330.0462490.47840.31667
34-0.110202-1.13990.128429
350.098671.02070.15486
36-0.08048-0.83250.203493
370.0181170.18740.42585
380.0327990.33930.367534
390.0525190.54330.29404
40-0.026933-0.27860.390545
410.1979682.04780.021515
420.035710.36940.356283
43-0.05565-0.57560.283032
44-0.08874-0.91790.180358
450.0110720.11450.454515
46-0.090552-0.93670.175516
470.1538191.59110.057267
48-0.06164-0.63760.262545
49-0.056877-0.58830.27877
50-0.05467-0.56550.286454
510.0045710.04730.481189
520.0074230.07680.469469
530.0191860.19850.421532
540.007930.0820.467388
55-0.035736-0.36970.356186
56-0.000553-0.00570.497721
570.0511630.52920.298868
58-0.014554-0.15050.440309
59-0.136658-1.41360.08019
60-0.010313-0.10670.457623


Parameters (Session):
par1 = 60 ; par2 = 1 ; par3 = 0 ; par4 = 0 ; par5 = 12 ;
Parameters (R input):
par1 = 60 ; par2 = 1 ; par3 = 0 ; par4 = 0 ; par5 = 12 ;
R code (references can be found in the software module):
if (par1 == 'Default') {
par1 = 10*log10(length(x))
} else {
par1 <- as.numeric(par1)
}
par2 <- as.numeric(par2)
par3 <- as.numeric(par3)
par4 <- as.numeric(par4)
par5 <- as.numeric(par5)
if (par2 == 0) {
x <- log(x)
} else {
x <- (x ^ par2 - 1) / par2
}
if (par3 > 0) x <- diff(x,lag=1,difference=par3)
if (par4 > 0) x <- diff(x,lag=par5,difference=par4)
bitmap(file='pic1.png')
racf <- acf(x,par1,main='Autocorrelation',xlab='lags',ylab='ACF')
dev.off()
bitmap(file='pic2.png')
rpacf <- pacf(x,par1,main='Partial Autocorrelation',xlab='lags',ylab='PACF')
dev.off()
(myacf <- c(racf$acf))
(mypacf <- c(rpacf$acf))
lengthx <- length(x)
sqrtn <- sqrt(lengthx)
load(file='createtable')
a<-table.start()
a<-table.row.start(a)
a<-table.element(a,'Autocorrelation Function',4,TRUE)
a<-table.row.end(a)
a<-table.row.start(a)
a<-table.element(a,'Time lag k',header=TRUE)
a<-table.element(a,hyperlink('basics.htm','ACF(k)','click here for more information about the Autocorrelation Function'),header=TRUE)
a<-table.element(a,'T-STAT',header=TRUE)
a<-table.element(a,'P-value',header=TRUE)
a<-table.row.end(a)
for (i in 2:(par1+1)) {
a<-table.row.start(a)
a<-table.element(a,i-1,header=TRUE)
a<-table.element(a,round(myacf[i],6))
mytstat <- myacf[i]*sqrtn
a<-table.element(a,round(mytstat,4))
a<-table.element(a,round(1-pt(abs(mytstat),lengthx),6))
a<-table.row.end(a)
}
a<-table.end(a)
table.save(a,file='mytable.tab')
a<-table.start()
a<-table.row.start(a)
a<-table.element(a,'Partial Autocorrelation Function',4,TRUE)
a<-table.row.end(a)
a<-table.row.start(a)
a<-table.element(a,'Time lag k',header=TRUE)
a<-table.element(a,hyperlink('basics.htm','PACF(k)','click here for more information about the Partial Autocorrelation Function'),header=TRUE)
a<-table.element(a,'T-STAT',header=TRUE)
a<-table.element(a,'P-value',header=TRUE)
a<-table.row.end(a)
for (i in 1:par1) {
a<-table.row.start(a)
a<-table.element(a,i,header=TRUE)
a<-table.element(a,round(mypacf[i],6))
mytstat <- mypacf[i]*sqrtn
a<-table.element(a,round(mytstat,4))
a<-table.element(a,round(1-pt(abs(mytstat),lengthx),6))
a<-table.row.end(a)
}
a<-table.end(a)
table.save(a,file='mytable1.tab')