Free Statistics

of Irreproducible Research!

Author's title

Author*Unverified author*
R Software Modulerwasp_arimaforecasting.wasp
Title produced by softwareARIMA Forecasting
Date of computationWed, 17 Dec 2008 15:20:48 -0700
Cite this page as followsStatistical Computations at FreeStatistics.org, Office for Research Development and Education, URL https://freestatistics.org/blog/index.php?v=date/2008/Dec/17/t1229552800f5sjytkxe6fgt6f.htm/, Retrieved Sat, 18 May 2024 08:57:12 +0000
Statistical Computations at FreeStatistics.org, Office for Research Development and Education, URL https://freestatistics.org/blog/index.php?pk=34590, Retrieved Sat, 18 May 2024 08:57:12 +0000
QR Codes:

Original text written by user:
IsPrivate?No (this computation is public)
User-defined keywords
Estimated Impact158
Family? (F = Feedback message, R = changed R code, M = changed R Module, P = changed Parameters, D = changed Data)
-       [ARIMA Forecasting] [fc] [2008-12-17 22:20:48] [d41d8cd98f00b204e9800998ecf8427e] [Current]
Feedback Forum

Post a new message
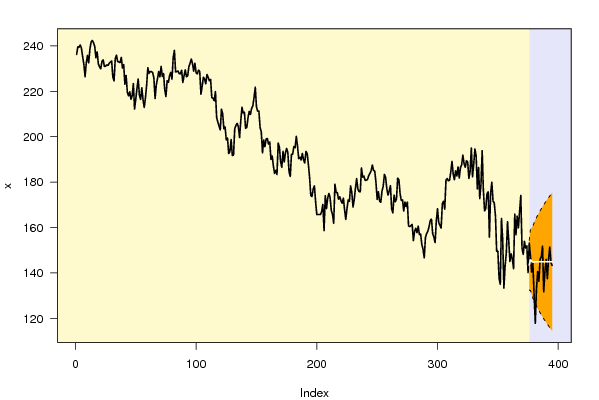
Dataseries X:
236.23
239.63
239.38
240.44
238.91
235.21
231.98
226.43
232.52
235.84
232.5
238.61
241.71
242.42
241.39
239.78
234.79
237.41
232.07
230.78
229.89
233.2
233.89
230.92
231.11
231.66
231.37
232.38
232.87
233.42
226.36
224.56
234.4
235.94
233.1
232.92
232.63
234.98
230.24
231.83
223.13
227
219.67
217.99
219.86
216.47
218.05
223.38
212.21
216.49
221.29
225.45
218.37
216.42
221.54
216.41
212.87
217.03
222.65
230.4
227.91
228.72
228.66
228.27
225.9
216.84
222.73
225.56
228.76
226.32
230.96
226.52
227.84
220.77
217.66
224.68
223.89
226.87
228.37
225.27
234.83
238.08
228.55
228.71
228.96
227.75
227.72
229.29
223.93
226.79
229.52
226.39
226.79
230.86
232.33
234.26
232.2
228.83
232.41
228.21
227.66
229.35
228.75
218.74
222.16
226.21
225.36
223.28
227.44
226.12
224.6
225.23
217.21
216.98
215.83
219.92
208.53
206.45
204.67
202.97
212.09
210.09
203.55
204.38
198.59
199.47
192.62
193.4
198.76
191.77
191.93
203.56
205
205.9
204.4
199.64
207.09
212.96
210.42
210.88
203.7
204.15
208.41
211.19
209.8
212.54
213.59
217.29
221.8
213.19
211.2
211.32
204.09
202.08
192.94
198.55
195.59
199.02
199.26
196.71
197.76
190.02
191.58
187.2
183.79
185.24
183.33
197.2
195.4
189.02
186.52
193.54
188.9
192.89
194.87
192.97
184.52
182.49
192.25
192.31
195.73
195.14
200.15
195.93
190.38
190.98
189.72
192.69
189.93
188.39
193.52
192.69
187.88
182.19
174.16
173.66
177.02
178.39
171.35
165.72
165.72
165.72
165.72
167
170.23
158.67
174.02
168.34
172.97
175.05
173.2
167.52
165.88
161.84
179.08
175.53
175.38
172.44
173.62
171.85
170.71
173
167.85
163.6
168.33
172.2
171.49
178.36
175.39
169.05
172.36
177.3
181.56
177.02
175.79
175.76
186.22
182.15
182.73
180.77
180.9
181.17
182.86
183.93
184.99
187.57
185.13
184.88
179.89
172.42
175.82
171.72
171.05
176.08
178.14
183.39
182.12
177.1
174.23
176.24
178.5
168.19
166.42
174.26
171.34
172.6
181.73
181.08
174.91
171.93
172.25
167.29
171.25
169.23
171.24
160.77
160.41
160.89
161.43
154.26
158.31
159.76
157.71
160.66
156.89
157.18
152.54
150.51
146.63
155.64
157.35
158.43
160.37
163.1
163.77
157.35
155.81
153.36
162.89
168.29
162.18
161.04
159.74
170.55
171.62
168.08
180.79
181.64
180.55
180.9
184.55
189.13
183.56
181.04
185.02
182.67
186.73
181.84
186.4
187.64
191.9
188.16
186.55
189.47
188.8
181.66
184.74
195.04
182.38
187.96
194.58
191.64
177.05
186.46
172.76
178.95
193.84
176.37
167.35
168.37
174.88
175.77
155.81
175.03
179.96
171.59
170.93
165.22
149.6
149.63
137.71
134.98
164.02
154.66
133.36
143.2
148.79
162.56
154.19
145.09
148.44
146.24
141.91
165.92
156.85
165.01
159.89
167.07
174.15
151.02
148.16
153.91
150.94
151.97
140.18
153.15
147.44
140.43
144.43
130.63
117.87
133.24
140.61
136.35
146.25
146.97
151.8
131.72
140.79
145.98
137.51
146.06
151.38
144.46
143.33


Summary of computational transaction
Raw Inputview raw input (R code)
Raw Outputview raw output of R engine
Computing time3 seconds
R Server'Sir Ronald Aylmer Fisher' @ 193.190.124.24

\begin{tabular}{lllllllll}
\hline
Summary of computational transaction \tabularnewline
Raw Input & view raw input (R code)  \tabularnewline
Raw Output & view raw output of R engine  \tabularnewline
Computing time & 3 seconds \tabularnewline
R Server & 'Sir Ronald Aylmer Fisher' @ 193.190.124.24 \tabularnewline
\hline
\end{tabular}
%Source: https://freestatistics.org/blog/index.php?pk=34590&T=0

[TABLE]
[ROW][C]Summary of computational transaction[/C][/ROW]
[ROW][C]Raw Input[/C][C]view raw input (R code) [/C][/ROW]
[ROW][C]Raw Output[/C][C]view raw output of R engine [/C][/ROW]
[ROW][C]Computing time[/C][C]3 seconds[/C][/ROW]
[ROW][C]R Server[/C][C]'Sir Ronald Aylmer Fisher' @ 193.190.124.24[/C][/ROW]
[/TABLE]
Source: https://freestatistics.org/blog/index.php?pk=34590&T=0

Globally Unique Identifier (entire table): ba.freestatistics.org/blog/index.php?pk=34590&T=0

As an alternative you can also use a QR Code:  

The GUIDs for individual cells are displayed in the table below:

Summary of computational transaction
Raw Inputview raw input (R code)
Raw Outputview raw output of R engine
Computing time3 seconds
R Server'Sir Ronald Aylmer Fisher' @ 193.190.124.24


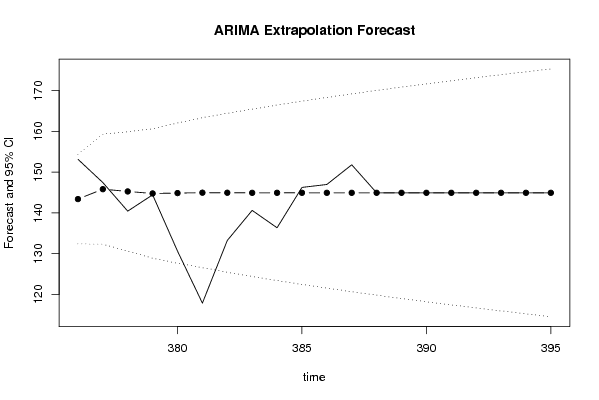
Univariate ARIMA Extrapolation Forecast
timeY[t]F[t]95% LB95% UBp-value(H0: Y[t] = F[t])P(F[t]>Y[t-1])P(F[t]>Y[t-s])P(F[t]>Y[375])
374151.97-------
375140.18-------
376153.15143.3895132.4201154.35890.04060.71680.71680.7168
377147.44145.8176132.31159.32510.40690.14370.14370.7933
378140.43145.2604130.6305159.89030.25880.38510.38510.7519
379144.43144.7636128.8905160.63680.48360.70370.70370.7143
380130.63144.858127.6592162.05680.05250.51950.51950.703
381117.87144.959126.5623163.35570.0020.93660.93660.6947
382133.24144.9436125.4538164.43340.11960.99680.99680.684
383140.61144.9231124.3936165.45270.34020.86770.86770.6747
384136.35144.9255123.4007166.45040.21740.65280.65280.6672
385146.25144.9297122.4543167.40510.45420.77280.77280.6606
386146.97144.9293121.543168.31560.43210.45590.45590.6547
387151.8144.9285120.6654169.19160.28940.43450.43450.6494
388131.72144.9285119.819170.03810.15130.29590.29590.6446
389140.79144.9287119.0003170.8570.37720.8410.8410.6402
390145.98144.9287118.2067171.65070.46930.61930.61930.6362
391137.51144.9287117.4359172.42150.29840.47010.47010.6325
392146.06144.9287116.6861173.17120.46870.69670.69670.6291
393151.38144.9287115.9557173.90160.33130.46950.46950.626
394144.46144.9287115.2433174.6140.48770.33510.33510.6231
395143.33144.9287114.5476175.30970.45890.51210.51210.6203

\begin{tabular}{lllllllll}
\hline
Univariate ARIMA Extrapolation Forecast \tabularnewline
time & Y[t] & F[t] & 95% LB & 95% UB & p-value(H0: Y[t] = F[t]) & P(F[t]>Y[t-1]) & P(F[t]>Y[t-s]) & P(F[t]>Y[375]) \tabularnewline
374 & 151.97 & - & - & - & - & - & - & - \tabularnewline
375 & 140.18 & - & - & - & - & - & - & - \tabularnewline
376 & 153.15 & 143.3895 & 132.4201 & 154.3589 & 0.0406 & 0.7168 & 0.7168 & 0.7168 \tabularnewline
377 & 147.44 & 145.8176 & 132.31 & 159.3251 & 0.4069 & 0.1437 & 0.1437 & 0.7933 \tabularnewline
378 & 140.43 & 145.2604 & 130.6305 & 159.8903 & 0.2588 & 0.3851 & 0.3851 & 0.7519 \tabularnewline
379 & 144.43 & 144.7636 & 128.8905 & 160.6368 & 0.4836 & 0.7037 & 0.7037 & 0.7143 \tabularnewline
380 & 130.63 & 144.858 & 127.6592 & 162.0568 & 0.0525 & 0.5195 & 0.5195 & 0.703 \tabularnewline
381 & 117.87 & 144.959 & 126.5623 & 163.3557 & 0.002 & 0.9366 & 0.9366 & 0.6947 \tabularnewline
382 & 133.24 & 144.9436 & 125.4538 & 164.4334 & 0.1196 & 0.9968 & 0.9968 & 0.684 \tabularnewline
383 & 140.61 & 144.9231 & 124.3936 & 165.4527 & 0.3402 & 0.8677 & 0.8677 & 0.6747 \tabularnewline
384 & 136.35 & 144.9255 & 123.4007 & 166.4504 & 0.2174 & 0.6528 & 0.6528 & 0.6672 \tabularnewline
385 & 146.25 & 144.9297 & 122.4543 & 167.4051 & 0.4542 & 0.7728 & 0.7728 & 0.6606 \tabularnewline
386 & 146.97 & 144.9293 & 121.543 & 168.3156 & 0.4321 & 0.4559 & 0.4559 & 0.6547 \tabularnewline
387 & 151.8 & 144.9285 & 120.6654 & 169.1916 & 0.2894 & 0.4345 & 0.4345 & 0.6494 \tabularnewline
388 & 131.72 & 144.9285 & 119.819 & 170.0381 & 0.1513 & 0.2959 & 0.2959 & 0.6446 \tabularnewline
389 & 140.79 & 144.9287 & 119.0003 & 170.857 & 0.3772 & 0.841 & 0.841 & 0.6402 \tabularnewline
390 & 145.98 & 144.9287 & 118.2067 & 171.6507 & 0.4693 & 0.6193 & 0.6193 & 0.6362 \tabularnewline
391 & 137.51 & 144.9287 & 117.4359 & 172.4215 & 0.2984 & 0.4701 & 0.4701 & 0.6325 \tabularnewline
392 & 146.06 & 144.9287 & 116.6861 & 173.1712 & 0.4687 & 0.6967 & 0.6967 & 0.6291 \tabularnewline
393 & 151.38 & 144.9287 & 115.9557 & 173.9016 & 0.3313 & 0.4695 & 0.4695 & 0.626 \tabularnewline
394 & 144.46 & 144.9287 & 115.2433 & 174.614 & 0.4877 & 0.3351 & 0.3351 & 0.6231 \tabularnewline
395 & 143.33 & 144.9287 & 114.5476 & 175.3097 & 0.4589 & 0.5121 & 0.5121 & 0.6203 \tabularnewline
\hline
\end{tabular}
%Source: https://freestatistics.org/blog/index.php?pk=34590&T=1

[TABLE]
[ROW][C]Univariate ARIMA Extrapolation Forecast[/C][/ROW]
[ROW][C]time[/C][C]Y[t][/C][C]F[t][/C][C]95% LB[/C][C]95% UB[/C][C]p-value(H0: Y[t] = F[t])[/C][C]P(F[t]>Y[t-1])[/C][C]P(F[t]>Y[t-s])[/C][C]P(F[t]>Y[375])[/C][/ROW]
[ROW][C]374[/C][C]151.97[/C][C]-[/C][C]-[/C][C]-[/C][C]-[/C][C]-[/C][C]-[/C][C]-[/C][/ROW]
[ROW][C]375[/C][C]140.18[/C][C]-[/C][C]-[/C][C]-[/C][C]-[/C][C]-[/C][C]-[/C][C]-[/C][/ROW]
[ROW][C]376[/C][C]153.15[/C][C]143.3895[/C][C]132.4201[/C][C]154.3589[/C][C]0.0406[/C][C]0.7168[/C][C]0.7168[/C][C]0.7168[/C][/ROW]
[ROW][C]377[/C][C]147.44[/C][C]145.8176[/C][C]132.31[/C][C]159.3251[/C][C]0.4069[/C][C]0.1437[/C][C]0.1437[/C][C]0.7933[/C][/ROW]
[ROW][C]378[/C][C]140.43[/C][C]145.2604[/C][C]130.6305[/C][C]159.8903[/C][C]0.2588[/C][C]0.3851[/C][C]0.3851[/C][C]0.7519[/C][/ROW]
[ROW][C]379[/C][C]144.43[/C][C]144.7636[/C][C]128.8905[/C][C]160.6368[/C][C]0.4836[/C][C]0.7037[/C][C]0.7037[/C][C]0.7143[/C][/ROW]
[ROW][C]380[/C][C]130.63[/C][C]144.858[/C][C]127.6592[/C][C]162.0568[/C][C]0.0525[/C][C]0.5195[/C][C]0.5195[/C][C]0.703[/C][/ROW]
[ROW][C]381[/C][C]117.87[/C][C]144.959[/C][C]126.5623[/C][C]163.3557[/C][C]0.002[/C][C]0.9366[/C][C]0.9366[/C][C]0.6947[/C][/ROW]
[ROW][C]382[/C][C]133.24[/C][C]144.9436[/C][C]125.4538[/C][C]164.4334[/C][C]0.1196[/C][C]0.9968[/C][C]0.9968[/C][C]0.684[/C][/ROW]
[ROW][C]383[/C][C]140.61[/C][C]144.9231[/C][C]124.3936[/C][C]165.4527[/C][C]0.3402[/C][C]0.8677[/C][C]0.8677[/C][C]0.6747[/C][/ROW]
[ROW][C]384[/C][C]136.35[/C][C]144.9255[/C][C]123.4007[/C][C]166.4504[/C][C]0.2174[/C][C]0.6528[/C][C]0.6528[/C][C]0.6672[/C][/ROW]
[ROW][C]385[/C][C]146.25[/C][C]144.9297[/C][C]122.4543[/C][C]167.4051[/C][C]0.4542[/C][C]0.7728[/C][C]0.7728[/C][C]0.6606[/C][/ROW]
[ROW][C]386[/C][C]146.97[/C][C]144.9293[/C][C]121.543[/C][C]168.3156[/C][C]0.4321[/C][C]0.4559[/C][C]0.4559[/C][C]0.6547[/C][/ROW]
[ROW][C]387[/C][C]151.8[/C][C]144.9285[/C][C]120.6654[/C][C]169.1916[/C][C]0.2894[/C][C]0.4345[/C][C]0.4345[/C][C]0.6494[/C][/ROW]
[ROW][C]388[/C][C]131.72[/C][C]144.9285[/C][C]119.819[/C][C]170.0381[/C][C]0.1513[/C][C]0.2959[/C][C]0.2959[/C][C]0.6446[/C][/ROW]
[ROW][C]389[/C][C]140.79[/C][C]144.9287[/C][C]119.0003[/C][C]170.857[/C][C]0.3772[/C][C]0.841[/C][C]0.841[/C][C]0.6402[/C][/ROW]
[ROW][C]390[/C][C]145.98[/C][C]144.9287[/C][C]118.2067[/C][C]171.6507[/C][C]0.4693[/C][C]0.6193[/C][C]0.6193[/C][C]0.6362[/C][/ROW]
[ROW][C]391[/C][C]137.51[/C][C]144.9287[/C][C]117.4359[/C][C]172.4215[/C][C]0.2984[/C][C]0.4701[/C][C]0.4701[/C][C]0.6325[/C][/ROW]
[ROW][C]392[/C][C]146.06[/C][C]144.9287[/C][C]116.6861[/C][C]173.1712[/C][C]0.4687[/C][C]0.6967[/C][C]0.6967[/C][C]0.6291[/C][/ROW]
[ROW][C]393[/C][C]151.38[/C][C]144.9287[/C][C]115.9557[/C][C]173.9016[/C][C]0.3313[/C][C]0.4695[/C][C]0.4695[/C][C]0.626[/C][/ROW]
[ROW][C]394[/C][C]144.46[/C][C]144.9287[/C][C]115.2433[/C][C]174.614[/C][C]0.4877[/C][C]0.3351[/C][C]0.3351[/C][C]0.6231[/C][/ROW]
[ROW][C]395[/C][C]143.33[/C][C]144.9287[/C][C]114.5476[/C][C]175.3097[/C][C]0.4589[/C][C]0.5121[/C][C]0.5121[/C][C]0.6203[/C][/ROW]
[/TABLE]
Source: https://freestatistics.org/blog/index.php?pk=34590&T=1

Globally Unique Identifier (entire table): ba.freestatistics.org/blog/index.php?pk=34590&T=1

As an alternative you can also use a QR Code:  

The GUIDs for individual cells are displayed in the table below:

Univariate ARIMA Extrapolation Forecast
timeY[t]F[t]95% LB95% UBp-value(H0: Y[t] = F[t])P(F[t]>Y[t-1])P(F[t]>Y[t-s])P(F[t]>Y[375])
374151.97-------
375140.18-------
376153.15143.3895132.4201154.35890.04060.71680.71680.7168
377147.44145.8176132.31159.32510.40690.14370.14370.7933
378140.43145.2604130.6305159.89030.25880.38510.38510.7519
379144.43144.7636128.8905160.63680.48360.70370.70370.7143
380130.63144.858127.6592162.05680.05250.51950.51950.703
381117.87144.959126.5623163.35570.0020.93660.93660.6947
382133.24144.9436125.4538164.43340.11960.99680.99680.684
383140.61144.9231124.3936165.45270.34020.86770.86770.6747
384136.35144.9255123.4007166.45040.21740.65280.65280.6672
385146.25144.9297122.4543167.40510.45420.77280.77280.6606
386146.97144.9293121.543168.31560.43210.45590.45590.6547
387151.8144.9285120.6654169.19160.28940.43450.43450.6494
388131.72144.9285119.819170.03810.15130.29590.29590.6446
389140.79144.9287119.0003170.8570.37720.8410.8410.6402
390145.98144.9287118.2067171.65070.46930.61930.61930.6362
391137.51144.9287117.4359172.42150.29840.47010.47010.6325
392146.06144.9287116.6861173.17120.46870.69670.69670.6291
393151.38144.9287115.9557173.90160.33130.46950.46950.626
394144.46144.9287115.2433174.6140.48770.33510.33510.6231
395143.33144.9287114.5476175.30970.45890.51210.51210.6203


Univariate ARIMA Extrapolation Forecast Performance
time% S.E.PEMAPESq.EMSERMSE
3760.0390.06810.003495.2674.76342.1825
3770.04730.01116e-042.63230.13160.3628
3780.0514-0.03330.001723.33291.16661.0801
3790.0559-0.00231e-040.11130.00560.0746
3800.0606-0.09820.0049202.435810.12183.1815
3810.0647-0.18690.0093733.814736.69076.0573
3820.0686-0.08070.004136.97356.84872.617
3830.0723-0.02980.001518.60320.93020.9644
3840.0758-0.05920.00373.54013.6771.9176
3850.07910.00915e-041.74330.08720.2952
3860.08230.01417e-044.16440.20820.4563
3870.08540.04740.002447.21772.36091.5365
3880.0884-0.09110.0046174.46538.72332.9535
3890.0913-0.02860.001417.12880.85640.9254
3900.09410.00734e-041.10520.05530.2351
3910.0968-0.05120.002655.03652.75181.6589
3920.09940.00784e-041.27990.0640.253
3930.1020.04450.002241.61972.0811.4426
3940.1045-0.00322e-040.21960.0110.1048
3950.107-0.0116e-042.55570.12780.3575

\begin{tabular}{lllllllll}
\hline
Univariate ARIMA Extrapolation Forecast Performance \tabularnewline
time & % S.E. & PE & MAPE & Sq.E & MSE & RMSE \tabularnewline
376 & 0.039 & 0.0681 & 0.0034 & 95.267 & 4.7634 & 2.1825 \tabularnewline
377 & 0.0473 & 0.0111 & 6e-04 & 2.6323 & 0.1316 & 0.3628 \tabularnewline
378 & 0.0514 & -0.0333 & 0.0017 & 23.3329 & 1.1666 & 1.0801 \tabularnewline
379 & 0.0559 & -0.0023 & 1e-04 & 0.1113 & 0.0056 & 0.0746 \tabularnewline
380 & 0.0606 & -0.0982 & 0.0049 & 202.4358 & 10.1218 & 3.1815 \tabularnewline
381 & 0.0647 & -0.1869 & 0.0093 & 733.8147 & 36.6907 & 6.0573 \tabularnewline
382 & 0.0686 & -0.0807 & 0.004 & 136.9735 & 6.8487 & 2.617 \tabularnewline
383 & 0.0723 & -0.0298 & 0.0015 & 18.6032 & 0.9302 & 0.9644 \tabularnewline
384 & 0.0758 & -0.0592 & 0.003 & 73.5401 & 3.677 & 1.9176 \tabularnewline
385 & 0.0791 & 0.0091 & 5e-04 & 1.7433 & 0.0872 & 0.2952 \tabularnewline
386 & 0.0823 & 0.0141 & 7e-04 & 4.1644 & 0.2082 & 0.4563 \tabularnewline
387 & 0.0854 & 0.0474 & 0.0024 & 47.2177 & 2.3609 & 1.5365 \tabularnewline
388 & 0.0884 & -0.0911 & 0.0046 & 174.4653 & 8.7233 & 2.9535 \tabularnewline
389 & 0.0913 & -0.0286 & 0.0014 & 17.1288 & 0.8564 & 0.9254 \tabularnewline
390 & 0.0941 & 0.0073 & 4e-04 & 1.1052 & 0.0553 & 0.2351 \tabularnewline
391 & 0.0968 & -0.0512 & 0.0026 & 55.0365 & 2.7518 & 1.6589 \tabularnewline
392 & 0.0994 & 0.0078 & 4e-04 & 1.2799 & 0.064 & 0.253 \tabularnewline
393 & 0.102 & 0.0445 & 0.0022 & 41.6197 & 2.081 & 1.4426 \tabularnewline
394 & 0.1045 & -0.0032 & 2e-04 & 0.2196 & 0.011 & 0.1048 \tabularnewline
395 & 0.107 & -0.011 & 6e-04 & 2.5557 & 0.1278 & 0.3575 \tabularnewline
\hline
\end{tabular}
%Source: https://freestatistics.org/blog/index.php?pk=34590&T=2

[TABLE]
[ROW][C]Univariate ARIMA Extrapolation Forecast Performance[/C][/ROW]
[ROW][C]time[/C][C]% S.E.[/C][C]PE[/C][C]MAPE[/C][C]Sq.E[/C][C]MSE[/C][C]RMSE[/C][/ROW]
[ROW][C]376[/C][C]0.039[/C][C]0.0681[/C][C]0.0034[/C][C]95.267[/C][C]4.7634[/C][C]2.1825[/C][/ROW]
[ROW][C]377[/C][C]0.0473[/C][C]0.0111[/C][C]6e-04[/C][C]2.6323[/C][C]0.1316[/C][C]0.3628[/C][/ROW]
[ROW][C]378[/C][C]0.0514[/C][C]-0.0333[/C][C]0.0017[/C][C]23.3329[/C][C]1.1666[/C][C]1.0801[/C][/ROW]
[ROW][C]379[/C][C]0.0559[/C][C]-0.0023[/C][C]1e-04[/C][C]0.1113[/C][C]0.0056[/C][C]0.0746[/C][/ROW]
[ROW][C]380[/C][C]0.0606[/C][C]-0.0982[/C][C]0.0049[/C][C]202.4358[/C][C]10.1218[/C][C]3.1815[/C][/ROW]
[ROW][C]381[/C][C]0.0647[/C][C]-0.1869[/C][C]0.0093[/C][C]733.8147[/C][C]36.6907[/C][C]6.0573[/C][/ROW]
[ROW][C]382[/C][C]0.0686[/C][C]-0.0807[/C][C]0.004[/C][C]136.9735[/C][C]6.8487[/C][C]2.617[/C][/ROW]
[ROW][C]383[/C][C]0.0723[/C][C]-0.0298[/C][C]0.0015[/C][C]18.6032[/C][C]0.9302[/C][C]0.9644[/C][/ROW]
[ROW][C]384[/C][C]0.0758[/C][C]-0.0592[/C][C]0.003[/C][C]73.5401[/C][C]3.677[/C][C]1.9176[/C][/ROW]
[ROW][C]385[/C][C]0.0791[/C][C]0.0091[/C][C]5e-04[/C][C]1.7433[/C][C]0.0872[/C][C]0.2952[/C][/ROW]
[ROW][C]386[/C][C]0.0823[/C][C]0.0141[/C][C]7e-04[/C][C]4.1644[/C][C]0.2082[/C][C]0.4563[/C][/ROW]
[ROW][C]387[/C][C]0.0854[/C][C]0.0474[/C][C]0.0024[/C][C]47.2177[/C][C]2.3609[/C][C]1.5365[/C][/ROW]
[ROW][C]388[/C][C]0.0884[/C][C]-0.0911[/C][C]0.0046[/C][C]174.4653[/C][C]8.7233[/C][C]2.9535[/C][/ROW]
[ROW][C]389[/C][C]0.0913[/C][C]-0.0286[/C][C]0.0014[/C][C]17.1288[/C][C]0.8564[/C][C]0.9254[/C][/ROW]
[ROW][C]390[/C][C]0.0941[/C][C]0.0073[/C][C]4e-04[/C][C]1.1052[/C][C]0.0553[/C][C]0.2351[/C][/ROW]
[ROW][C]391[/C][C]0.0968[/C][C]-0.0512[/C][C]0.0026[/C][C]55.0365[/C][C]2.7518[/C][C]1.6589[/C][/ROW]
[ROW][C]392[/C][C]0.0994[/C][C]0.0078[/C][C]4e-04[/C][C]1.2799[/C][C]0.064[/C][C]0.253[/C][/ROW]
[ROW][C]393[/C][C]0.102[/C][C]0.0445[/C][C]0.0022[/C][C]41.6197[/C][C]2.081[/C][C]1.4426[/C][/ROW]
[ROW][C]394[/C][C]0.1045[/C][C]-0.0032[/C][C]2e-04[/C][C]0.2196[/C][C]0.011[/C][C]0.1048[/C][/ROW]
[ROW][C]395[/C][C]0.107[/C][C]-0.011[/C][C]6e-04[/C][C]2.5557[/C][C]0.1278[/C][C]0.3575[/C][/ROW]
[/TABLE]
Source: https://freestatistics.org/blog/index.php?pk=34590&T=2

Globally Unique Identifier (entire table): ba.freestatistics.org/blog/index.php?pk=34590&T=2

As an alternative you can also use a QR Code:  

The GUIDs for individual cells are displayed in the table below:

Univariate ARIMA Extrapolation Forecast Performance
time% S.E.PEMAPESq.EMSERMSE
3760.0390.06810.003495.2674.76342.1825
3770.04730.01116e-042.63230.13160.3628
3780.0514-0.03330.001723.33291.16661.0801
3790.0559-0.00231e-040.11130.00560.0746
3800.0606-0.09820.0049202.435810.12183.1815
3810.0647-0.18690.0093733.814736.69076.0573
3820.0686-0.08070.004136.97356.84872.617
3830.0723-0.02980.001518.60320.93020.9644
3840.0758-0.05920.00373.54013.6771.9176
3850.07910.00915e-041.74330.08720.2952
3860.08230.01417e-044.16440.20820.4563
3870.08540.04740.002447.21772.36091.5365
3880.0884-0.09110.0046174.46538.72332.9535
3890.0913-0.02860.001417.12880.85640.9254
3900.09410.00734e-041.10520.05530.2351
3910.0968-0.05120.002655.03652.75181.6589
3920.09940.00784e-041.27990.0640.253
3930.1020.04450.002241.61972.0811.4426
3940.1045-0.00322e-040.21960.0110.1048
3950.107-0.0116e-042.55570.12780.3575


Parameters (Session):
par1 = 48 ; par2 = 1 ; par3 = 1 ; par4 = 1 ; par5 = 1 ;
Parameters (R input):
par1 = 20 ; par2 = 1 ; par3 = 1 ; par4 = 0 ; par5 = 1 ; par6 = 0 ; par7 = 1 ; par8 = 2 ; par9 = 0 ; par10 = FALSE ;
R code (references can be found in the software module):
par1 <- as.numeric(par1) #cut off periods
par2 <- as.numeric(par2) #lambda
par3 <- as.numeric(par3) #degree of non-seasonal differencing
par4 <- as.numeric(par4) #degree of seasonal differencing
par5 <- as.numeric(par5) #seasonal period
par6 <- as.numeric(par6) #p
par7 <- as.numeric(par7) #q
par8 <- as.numeric(par8) #P
par9 <- as.numeric(par9) #Q
if (par10 == 'TRUE') par10 <- TRUE
if (par10 == 'FALSE') par10 <- FALSE
if (par2 == 0) x <- log(x)
if (par2 != 0) x <- x^par2
lx <- length(x)
first <- lx - 2*par1
nx <- lx - par1
nx1 <- nx + 1
fx <- lx - nx
if (fx < 1) {
fx <- par5
nx1 <- lx + fx - 1
first <- lx - 2*fx
}
first <- 1
if (fx < 3) fx <- round(lx/10,0)
(arima.out <- arima(x[1:nx], order=c(par6,par3,par7), seasonal=list(order=c(par8,par4,par9), period=par5), include.mean=par10, method='ML'))
(forecast <- predict(arima.out,fx))
(lb <- forecast$pred - 1.96 * forecast$se)
(ub <- forecast$pred + 1.96 * forecast$se)
if (par2 == 0) {
x <- exp(x)
forecast$pred <- exp(forecast$pred)
lb <- exp(lb)
ub <- exp(ub)
}
if (par2 != 0) {
x <- x^(1/par2)
forecast$pred <- forecast$pred^(1/par2)
lb <- lb^(1/par2)
ub <- ub^(1/par2)
}
if (par2 < 0) {
olb <- lb
lb <- ub
ub <- olb
}
(actandfor <- c(x[1:nx], forecast$pred))
(perc.se <- (ub-forecast$pred)/1.96/forecast$pred)
bitmap(file='test1.png')
opar <- par(mar=c(4,4,2,2),las=1)
ylim <- c( min(x[first:nx],lb), max(x[first:nx],ub))
plot(x,ylim=ylim,type='n',xlim=c(first,lx))
usr <- par('usr')
rect(usr[1],usr[3],nx+1,usr[4],border=NA,col='lemonchiffon')
rect(nx1,usr[3],usr[2],usr[4],border=NA,col='lavender')
abline(h= (-3:3)*2 , col ='gray', lty =3)
polygon( c(nx1:lx,lx:nx1), c(lb,rev(ub)), col = 'orange', lty=2,border=NA)
lines(nx1:lx, lb , lty=2)
lines(nx1:lx, ub , lty=2)
lines(x, lwd=2)
lines(nx1:lx, forecast$pred , lwd=2 , col ='white')
box()
par(opar)
dev.off()
prob.dec <- array(NA, dim=fx)
prob.sdec <- array(NA, dim=fx)
prob.ldec <- array(NA, dim=fx)
prob.pval <- array(NA, dim=fx)
perf.pe <- array(0, dim=fx)
perf.mape <- array(0, dim=fx)
perf.se <- array(0, dim=fx)
perf.mse <- array(0, dim=fx)
perf.rmse <- array(0, dim=fx)
for (i in 1:fx) {
locSD <- (ub[i] - forecast$pred[i]) / 1.96
perf.pe[i] = (x[nx+i] - forecast$pred[i]) / forecast$pred[i]
perf.mape[i] = perf.mape[i] + abs(perf.pe[i])
perf.se[i] = (x[nx+i] - forecast$pred[i])^2
perf.mse[i] = perf.mse[i] + perf.se[i]
prob.dec[i] = pnorm((x[nx+i-1] - forecast$pred[i]) / locSD)
prob.sdec[i] = pnorm((x[nx+i-par5] - forecast$pred[i]) / locSD)
prob.ldec[i] = pnorm((x[nx] - forecast$pred[i]) / locSD)
prob.pval[i] = pnorm(abs(x[nx+i] - forecast$pred[i]) / locSD)
}
perf.mape = perf.mape / fx
perf.mse = perf.mse / fx
perf.rmse = sqrt(perf.mse)
bitmap(file='test2.png')
plot(forecast$pred, pch=19, type='b',main='ARIMA Extrapolation Forecast', ylab='Forecast and 95% CI', xlab='time',ylim=c(min(lb),max(ub)))
dum <- forecast$pred
dum[1:12] <- x[(nx+1):lx]
lines(dum, lty=1)
lines(ub,lty=3)
lines(lb,lty=3)
dev.off()
load(file='createtable')
a<-table.start()
a<-table.row.start(a)
a<-table.element(a,'Univariate ARIMA Extrapolation Forecast',9,TRUE)
a<-table.row.end(a)
a<-table.row.start(a)
a<-table.element(a,'time',1,header=TRUE)
a<-table.element(a,'Y[t]',1,header=TRUE)
a<-table.element(a,'F[t]',1,header=TRUE)
a<-table.element(a,'95% LB',1,header=TRUE)
a<-table.element(a,'95% UB',1,header=TRUE)
a<-table.element(a,'p-value
(H0: Y[t] = F[t])',1,header=TRUE)
a<-table.element(a,'P(F[t]>Y[t-1])',1,header=TRUE)
a<-table.element(a,'P(F[t]>Y[t-s])',1,header=TRUE)
mylab <- paste('P(F[t]>Y[',nx,sep='')
mylab <- paste(mylab,'])',sep='')
a<-table.element(a,mylab,1,header=TRUE)
a<-table.row.end(a)
for (i in (nx-par5):nx) {
a<-table.row.start(a)
a<-table.element(a,i,header=TRUE)
a<-table.element(a,x[i])
a<-table.element(a,'-')
a<-table.row.end(a)
}
for (i in 1:fx) {
a<-table.row.start(a)
a<-table.element(a,nx+i,header=TRUE)
a<-table.element(a,round(x[nx+i],4))
a<-table.element(a,round(forecast$pred[i],4))
a<-table.element(a,round(lb[i],4))
a<-table.element(a,round(ub[i],4))
a<-table.element(a,round((1-prob.pval[i]),4))
a<-table.element(a,round((1-prob.dec[i]),4))
a<-table.element(a,round((1-prob.sdec[i]),4))
a<-table.element(a,round((1-prob.ldec[i]),4))
a<-table.row.end(a)
}
a<-table.end(a)
table.save(a,file='mytable.tab')
a<-table.start()
a<-table.row.start(a)
a<-table.element(a,'Univariate ARIMA Extrapolation Forecast Performance',7,TRUE)
a<-table.row.end(a)
a<-table.row.start(a)
a<-table.element(a,'time',1,header=TRUE)
a<-table.element(a,'% S.E.',1,header=TRUE)
a<-table.element(a,'PE',1,header=TRUE)
a<-table.element(a,'MAPE',1,header=TRUE)
a<-table.element(a,'Sq.E',1,header=TRUE)
a<-table.element(a,'MSE',1,header=TRUE)
a<-table.element(a,'RMSE',1,header=TRUE)
a<-table.row.end(a)
for (i in 1:fx) {
a<-table.row.start(a)
a<-table.element(a,nx+i,header=TRUE)
a<-table.element(a,round(perc.se[i],4))
a<-table.element(a,round(perf.pe[i],4))
a<-table.element(a,round(perf.mape[i],4))
a<-table.element(a,round(perf.se[i],4))
a<-table.element(a,round(perf.mse[i],4))
a<-table.element(a,round(perf.rmse[i],4))
a<-table.row.end(a)
}
a<-table.end(a)
table.save(a,file='mytable1.tab')