Free Statistics

of Irreproducible Research!

Author's title

Author*The author of this computation has been verified*
R Software Modulerwasp_autocorrelation.wasp
Title produced by software(Partial) Autocorrelation Function
Date of computationSun, 21 Dec 2008 04:19:00 -0700
Cite this page as followsStatistical Computations at FreeStatistics.org, Office for Research Development and Education, URL https://freestatistics.org/blog/index.php?v=date/2008/Dec/21/t1229858390zmbxxryy0uce0cy.htm/, Retrieved Sat, 18 May 2024 12:38:21 +0000
Statistical Computations at FreeStatistics.org, Office for Research Development and Education, URL https://freestatistics.org/blog/index.php?pk=35501, Retrieved Sat, 18 May 2024 12:38:21 +0000
QR Codes:

Original text written by user:
IsPrivate?No (this computation is public)
User-defined keywords
Estimated Impact183
Family? (F = Feedback message, R = changed R code, M = changed R Module, P = changed Parameters, D = changed Data)
-       [(Partial) Autocorrelation Function] [ACF paper bel 20] [2008-12-21 11:19:00] [00a0a665d7a07edd2e460056b0c0c354] [Current]
-   P     [(Partial) Autocorrelation Function] [ACF paper] [2008-12-21 11:22:09] [82d201ca7b4e7cd2c6f885d29b5b6937]
- RMP     [Spectral Analysis] [spectrum Paper] [2008-12-21 11:26:38] [82d201ca7b4e7cd2c6f885d29b5b6937]
-   P       [Spectral Analysis] [Spectrum Paper] [2008-12-21 11:29:47] [82d201ca7b4e7cd2c6f885d29b5b6937]
Feedback Forum

Post a new message
Dataseries X:
1995
1947
1766
1635
1833
1910
1960
1970
2061
2093
2121
2175
2197
2350
2440
2409
2473
2408
2455
2448
2498
2646
2757
2849
2921
2982
3081
3106
3119
3061
3097
3162
3257
3277
3295
3364
3494
3667
3813
3918
3896
3801
3570
3702
3862
3970
4139
4200
4291
4444
4503
4357
4591
4697
4621
4563
4203
4296
4435
4105
4117


Summary of computational transaction
Raw Inputview raw input (R code)
Raw Outputview raw output of R engine
Computing time1 seconds
R Server'Gwilym Jenkins' @ 72.249.127.135

\begin{tabular}{lllllllll}
\hline
Summary of computational transaction \tabularnewline
Raw Input & view raw input (R code)  \tabularnewline
Raw Output & view raw output of R engine  \tabularnewline
Computing time & 1 seconds \tabularnewline
R Server & 'Gwilym Jenkins' @ 72.249.127.135 \tabularnewline
\hline
\end{tabular}
%Source: https://freestatistics.org/blog/index.php?pk=35501&T=0

[TABLE]
[ROW][C]Summary of computational transaction[/C][/ROW]
[ROW][C]Raw Input[/C][C]view raw input (R code) [/C][/ROW]
[ROW][C]Raw Output[/C][C]view raw output of R engine [/C][/ROW]
[ROW][C]Computing time[/C][C]1 seconds[/C][/ROW]
[ROW][C]R Server[/C][C]'Gwilym Jenkins' @ 72.249.127.135[/C][/ROW]
[/TABLE]
Source: https://freestatistics.org/blog/index.php?pk=35501&T=0

Globally Unique Identifier (entire table): ba.freestatistics.org/blog/index.php?pk=35501&T=0

As an alternative you can also use a QR Code:  

The GUIDs for individual cells are displayed in the table below:

Summary of computational transaction
Raw Inputview raw input (R code)
Raw Outputview raw output of R engine
Computing time1 seconds
R Server'Gwilym Jenkins' @ 72.249.127.135


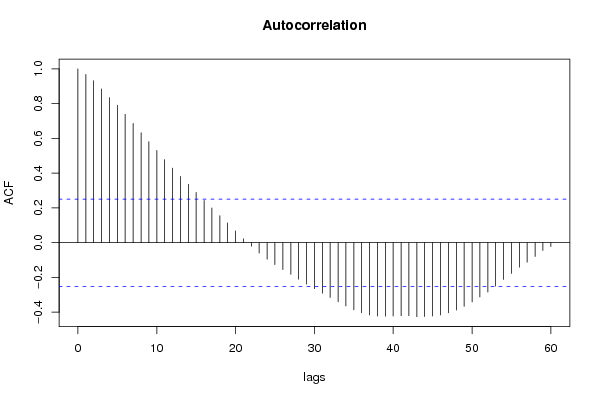
Autocorrelation Function
Time lag kACF(k)T-STATP-value
10.9684017.56350
20.9321057.280
30.8851186.9130
40.8347686.51970
50.7910896.17860
60.7390495.77220
70.6862025.35941e-06
80.6332464.94583e-06
90.5812354.53961.4e-05
100.5308414.1465.3e-05
110.4787623.73930.000205
120.4291763.3520.000691
130.3809842.97560.002094
140.3360592.62470.005472
150.2895072.26110.013665
160.2432781.90010.031077
170.1999831.56190.061741
180.1553711.21350.114812
190.1134780.88630.18947
200.0677460.52910.299325
210.0221790.17320.431525
22-0.020303-0.15860.437264
23-0.059543-0.4650.321778
24-0.094863-0.74090.230797
25-0.125803-0.98260.164854
26-0.154559-1.20710.116018
27-0.181804-1.41990.080359
28-0.210157-1.64140.052933
29-0.238165-1.86010.033845
30-0.265107-2.07050.02132
31-0.290728-2.27070.013355
32-0.315474-2.46390.008288
33-0.340274-2.65760.005016
34-0.363996-2.84290.003037
35-0.386147-3.01590.001866
36-0.403542-3.15180.001258
37-0.41625-3.2510.000937
38-0.422762-3.30190.000804
39-0.423088-3.30440.000798
40-0.422103-3.29670.000817
41-0.420521-3.28440.000848
42-0.420413-3.28350.00085
43-0.425801-3.32560.000749
44-0.4251-3.32010.000761
45-0.42253-3.30010.000809
46-0.415756-3.24720.000948
47-0.403799-3.15380.001251
48-0.387545-3.02680.001808
49-0.366426-2.86190.002881
50-0.341367-2.66620.004904
51-0.312225-2.43860.008836
52-0.284377-2.22110.015035
53-0.24949-1.94860.027975
54-0.211862-1.65470.051562
55-0.17703-1.38260.085907
56-0.141005-1.10130.137549
57-0.112452-0.87830.19162
58-0.079023-0.61720.269704
59-0.044993-0.35140.363248
60-0.022192-0.17330.431484

\begin{tabular}{lllllllll}
\hline
Autocorrelation Function \tabularnewline
Time lag k & ACF(k) & T-STAT & P-value \tabularnewline
1 & 0.968401 & 7.5635 & 0 \tabularnewline
2 & 0.932105 & 7.28 & 0 \tabularnewline
3 & 0.885118 & 6.913 & 0 \tabularnewline
4 & 0.834768 & 6.5197 & 0 \tabularnewline
5 & 0.791089 & 6.1786 & 0 \tabularnewline
6 & 0.739049 & 5.7722 & 0 \tabularnewline
7 & 0.686202 & 5.3594 & 1e-06 \tabularnewline
8 & 0.633246 & 4.9458 & 3e-06 \tabularnewline
9 & 0.581235 & 4.5396 & 1.4e-05 \tabularnewline
10 & 0.530841 & 4.146 & 5.3e-05 \tabularnewline
11 & 0.478762 & 3.7393 & 0.000205 \tabularnewline
12 & 0.429176 & 3.352 & 0.000691 \tabularnewline
13 & 0.380984 & 2.9756 & 0.002094 \tabularnewline
14 & 0.336059 & 2.6247 & 0.005472 \tabularnewline
15 & 0.289507 & 2.2611 & 0.013665 \tabularnewline
16 & 0.243278 & 1.9001 & 0.031077 \tabularnewline
17 & 0.199983 & 1.5619 & 0.061741 \tabularnewline
18 & 0.155371 & 1.2135 & 0.114812 \tabularnewline
19 & 0.113478 & 0.8863 & 0.18947 \tabularnewline
20 & 0.067746 & 0.5291 & 0.299325 \tabularnewline
21 & 0.022179 & 0.1732 & 0.431525 \tabularnewline
22 & -0.020303 & -0.1586 & 0.437264 \tabularnewline
23 & -0.059543 & -0.465 & 0.321778 \tabularnewline
24 & -0.094863 & -0.7409 & 0.230797 \tabularnewline
25 & -0.125803 & -0.9826 & 0.164854 \tabularnewline
26 & -0.154559 & -1.2071 & 0.116018 \tabularnewline
27 & -0.181804 & -1.4199 & 0.080359 \tabularnewline
28 & -0.210157 & -1.6414 & 0.052933 \tabularnewline
29 & -0.238165 & -1.8601 & 0.033845 \tabularnewline
30 & -0.265107 & -2.0705 & 0.02132 \tabularnewline
31 & -0.290728 & -2.2707 & 0.013355 \tabularnewline
32 & -0.315474 & -2.4639 & 0.008288 \tabularnewline
33 & -0.340274 & -2.6576 & 0.005016 \tabularnewline
34 & -0.363996 & -2.8429 & 0.003037 \tabularnewline
35 & -0.386147 & -3.0159 & 0.001866 \tabularnewline
36 & -0.403542 & -3.1518 & 0.001258 \tabularnewline
37 & -0.41625 & -3.251 & 0.000937 \tabularnewline
38 & -0.422762 & -3.3019 & 0.000804 \tabularnewline
39 & -0.423088 & -3.3044 & 0.000798 \tabularnewline
40 & -0.422103 & -3.2967 & 0.000817 \tabularnewline
41 & -0.420521 & -3.2844 & 0.000848 \tabularnewline
42 & -0.420413 & -3.2835 & 0.00085 \tabularnewline
43 & -0.425801 & -3.3256 & 0.000749 \tabularnewline
44 & -0.4251 & -3.3201 & 0.000761 \tabularnewline
45 & -0.42253 & -3.3001 & 0.000809 \tabularnewline
46 & -0.415756 & -3.2472 & 0.000948 \tabularnewline
47 & -0.403799 & -3.1538 & 0.001251 \tabularnewline
48 & -0.387545 & -3.0268 & 0.001808 \tabularnewline
49 & -0.366426 & -2.8619 & 0.002881 \tabularnewline
50 & -0.341367 & -2.6662 & 0.004904 \tabularnewline
51 & -0.312225 & -2.4386 & 0.008836 \tabularnewline
52 & -0.284377 & -2.2211 & 0.015035 \tabularnewline
53 & -0.24949 & -1.9486 & 0.027975 \tabularnewline
54 & -0.211862 & -1.6547 & 0.051562 \tabularnewline
55 & -0.17703 & -1.3826 & 0.085907 \tabularnewline
56 & -0.141005 & -1.1013 & 0.137549 \tabularnewline
57 & -0.112452 & -0.8783 & 0.19162 \tabularnewline
58 & -0.079023 & -0.6172 & 0.269704 \tabularnewline
59 & -0.044993 & -0.3514 & 0.363248 \tabularnewline
60 & -0.022192 & -0.1733 & 0.431484 \tabularnewline
\hline
\end{tabular}
%Source: https://freestatistics.org/blog/index.php?pk=35501&T=1

[TABLE]
[ROW][C]Autocorrelation Function[/C][/ROW]
[ROW][C]Time lag k[/C][C]ACF(k)[/C][C]T-STAT[/C][C]P-value[/C][/ROW]
[ROW][C]1[/C][C]0.968401[/C][C]7.5635[/C][C]0[/C][/ROW]
[ROW][C]2[/C][C]0.932105[/C][C]7.28[/C][C]0[/C][/ROW]
[ROW][C]3[/C][C]0.885118[/C][C]6.913[/C][C]0[/C][/ROW]
[ROW][C]4[/C][C]0.834768[/C][C]6.5197[/C][C]0[/C][/ROW]
[ROW][C]5[/C][C]0.791089[/C][C]6.1786[/C][C]0[/C][/ROW]
[ROW][C]6[/C][C]0.739049[/C][C]5.7722[/C][C]0[/C][/ROW]
[ROW][C]7[/C][C]0.686202[/C][C]5.3594[/C][C]1e-06[/C][/ROW]
[ROW][C]8[/C][C]0.633246[/C][C]4.9458[/C][C]3e-06[/C][/ROW]
[ROW][C]9[/C][C]0.581235[/C][C]4.5396[/C][C]1.4e-05[/C][/ROW]
[ROW][C]10[/C][C]0.530841[/C][C]4.146[/C][C]5.3e-05[/C][/ROW]
[ROW][C]11[/C][C]0.478762[/C][C]3.7393[/C][C]0.000205[/C][/ROW]
[ROW][C]12[/C][C]0.429176[/C][C]3.352[/C][C]0.000691[/C][/ROW]
[ROW][C]13[/C][C]0.380984[/C][C]2.9756[/C][C]0.002094[/C][/ROW]
[ROW][C]14[/C][C]0.336059[/C][C]2.6247[/C][C]0.005472[/C][/ROW]
[ROW][C]15[/C][C]0.289507[/C][C]2.2611[/C][C]0.013665[/C][/ROW]
[ROW][C]16[/C][C]0.243278[/C][C]1.9001[/C][C]0.031077[/C][/ROW]
[ROW][C]17[/C][C]0.199983[/C][C]1.5619[/C][C]0.061741[/C][/ROW]
[ROW][C]18[/C][C]0.155371[/C][C]1.2135[/C][C]0.114812[/C][/ROW]
[ROW][C]19[/C][C]0.113478[/C][C]0.8863[/C][C]0.18947[/C][/ROW]
[ROW][C]20[/C][C]0.067746[/C][C]0.5291[/C][C]0.299325[/C][/ROW]
[ROW][C]21[/C][C]0.022179[/C][C]0.1732[/C][C]0.431525[/C][/ROW]
[ROW][C]22[/C][C]-0.020303[/C][C]-0.1586[/C][C]0.437264[/C][/ROW]
[ROW][C]23[/C][C]-0.059543[/C][C]-0.465[/C][C]0.321778[/C][/ROW]
[ROW][C]24[/C][C]-0.094863[/C][C]-0.7409[/C][C]0.230797[/C][/ROW]
[ROW][C]25[/C][C]-0.125803[/C][C]-0.9826[/C][C]0.164854[/C][/ROW]
[ROW][C]26[/C][C]-0.154559[/C][C]-1.2071[/C][C]0.116018[/C][/ROW]
[ROW][C]27[/C][C]-0.181804[/C][C]-1.4199[/C][C]0.080359[/C][/ROW]
[ROW][C]28[/C][C]-0.210157[/C][C]-1.6414[/C][C]0.052933[/C][/ROW]
[ROW][C]29[/C][C]-0.238165[/C][C]-1.8601[/C][C]0.033845[/C][/ROW]
[ROW][C]30[/C][C]-0.265107[/C][C]-2.0705[/C][C]0.02132[/C][/ROW]
[ROW][C]31[/C][C]-0.290728[/C][C]-2.2707[/C][C]0.013355[/C][/ROW]
[ROW][C]32[/C][C]-0.315474[/C][C]-2.4639[/C][C]0.008288[/C][/ROW]
[ROW][C]33[/C][C]-0.340274[/C][C]-2.6576[/C][C]0.005016[/C][/ROW]
[ROW][C]34[/C][C]-0.363996[/C][C]-2.8429[/C][C]0.003037[/C][/ROW]
[ROW][C]35[/C][C]-0.386147[/C][C]-3.0159[/C][C]0.001866[/C][/ROW]
[ROW][C]36[/C][C]-0.403542[/C][C]-3.1518[/C][C]0.001258[/C][/ROW]
[ROW][C]37[/C][C]-0.41625[/C][C]-3.251[/C][C]0.000937[/C][/ROW]
[ROW][C]38[/C][C]-0.422762[/C][C]-3.3019[/C][C]0.000804[/C][/ROW]
[ROW][C]39[/C][C]-0.423088[/C][C]-3.3044[/C][C]0.000798[/C][/ROW]
[ROW][C]40[/C][C]-0.422103[/C][C]-3.2967[/C][C]0.000817[/C][/ROW]
[ROW][C]41[/C][C]-0.420521[/C][C]-3.2844[/C][C]0.000848[/C][/ROW]
[ROW][C]42[/C][C]-0.420413[/C][C]-3.2835[/C][C]0.00085[/C][/ROW]
[ROW][C]43[/C][C]-0.425801[/C][C]-3.3256[/C][C]0.000749[/C][/ROW]
[ROW][C]44[/C][C]-0.4251[/C][C]-3.3201[/C][C]0.000761[/C][/ROW]
[ROW][C]45[/C][C]-0.42253[/C][C]-3.3001[/C][C]0.000809[/C][/ROW]
[ROW][C]46[/C][C]-0.415756[/C][C]-3.2472[/C][C]0.000948[/C][/ROW]
[ROW][C]47[/C][C]-0.403799[/C][C]-3.1538[/C][C]0.001251[/C][/ROW]
[ROW][C]48[/C][C]-0.387545[/C][C]-3.0268[/C][C]0.001808[/C][/ROW]
[ROW][C]49[/C][C]-0.366426[/C][C]-2.8619[/C][C]0.002881[/C][/ROW]
[ROW][C]50[/C][C]-0.341367[/C][C]-2.6662[/C][C]0.004904[/C][/ROW]
[ROW][C]51[/C][C]-0.312225[/C][C]-2.4386[/C][C]0.008836[/C][/ROW]
[ROW][C]52[/C][C]-0.284377[/C][C]-2.2211[/C][C]0.015035[/C][/ROW]
[ROW][C]53[/C][C]-0.24949[/C][C]-1.9486[/C][C]0.027975[/C][/ROW]
[ROW][C]54[/C][C]-0.211862[/C][C]-1.6547[/C][C]0.051562[/C][/ROW]
[ROW][C]55[/C][C]-0.17703[/C][C]-1.3826[/C][C]0.085907[/C][/ROW]
[ROW][C]56[/C][C]-0.141005[/C][C]-1.1013[/C][C]0.137549[/C][/ROW]
[ROW][C]57[/C][C]-0.112452[/C][C]-0.8783[/C][C]0.19162[/C][/ROW]
[ROW][C]58[/C][C]-0.079023[/C][C]-0.6172[/C][C]0.269704[/C][/ROW]
[ROW][C]59[/C][C]-0.044993[/C][C]-0.3514[/C][C]0.363248[/C][/ROW]
[ROW][C]60[/C][C]-0.022192[/C][C]-0.1733[/C][C]0.431484[/C][/ROW]
[/TABLE]
Source: https://freestatistics.org/blog/index.php?pk=35501&T=1

Globally Unique Identifier (entire table): ba.freestatistics.org/blog/index.php?pk=35501&T=1

As an alternative you can also use a QR Code:  

The GUIDs for individual cells are displayed in the table below:

Autocorrelation Function
Time lag kACF(k)T-STATP-value
10.9684017.56350
20.9321057.280
30.8851186.9130
40.8347686.51970
50.7910896.17860
60.7390495.77220
70.6862025.35941e-06
80.6332464.94583e-06
90.5812354.53961.4e-05
100.5308414.1465.3e-05
110.4787623.73930.000205
120.4291763.3520.000691
130.3809842.97560.002094
140.3360592.62470.005472
150.2895072.26110.013665
160.2432781.90010.031077
170.1999831.56190.061741
180.1553711.21350.114812
190.1134780.88630.18947
200.0677460.52910.299325
210.0221790.17320.431525
22-0.020303-0.15860.437264
23-0.059543-0.4650.321778
24-0.094863-0.74090.230797
25-0.125803-0.98260.164854
26-0.154559-1.20710.116018
27-0.181804-1.41990.080359
28-0.210157-1.64140.052933
29-0.238165-1.86010.033845
30-0.265107-2.07050.02132
31-0.290728-2.27070.013355
32-0.315474-2.46390.008288
33-0.340274-2.65760.005016
34-0.363996-2.84290.003037
35-0.386147-3.01590.001866
36-0.403542-3.15180.001258
37-0.41625-3.2510.000937
38-0.422762-3.30190.000804
39-0.423088-3.30440.000798
40-0.422103-3.29670.000817
41-0.420521-3.28440.000848
42-0.420413-3.28350.00085
43-0.425801-3.32560.000749
44-0.4251-3.32010.000761
45-0.42253-3.30010.000809
46-0.415756-3.24720.000948
47-0.403799-3.15380.001251
48-0.387545-3.02680.001808
49-0.366426-2.86190.002881
50-0.341367-2.66620.004904
51-0.312225-2.43860.008836
52-0.284377-2.22110.015035
53-0.24949-1.94860.027975
54-0.211862-1.65470.051562
55-0.17703-1.38260.085907
56-0.141005-1.10130.137549
57-0.112452-0.87830.19162
58-0.079023-0.61720.269704
59-0.044993-0.35140.363248
60-0.022192-0.17330.431484


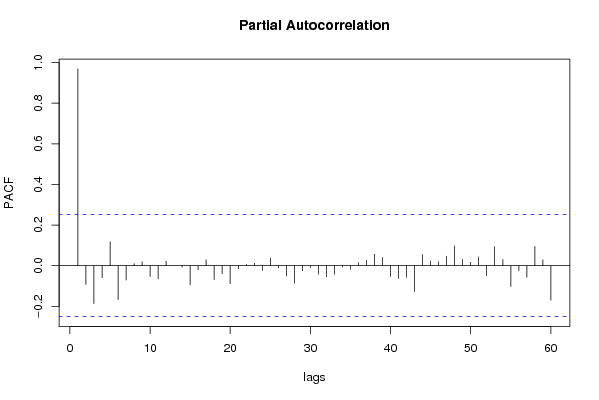
Partial Autocorrelation Function
Time lag kPACF(k)T-STATP-value
10.9684017.56350
2-0.091567-0.71520.238618
3-0.186656-1.45780.075009
4-0.059553-0.46510.321748
50.1176770.91910.180834
6-0.166354-1.29930.099371
7-0.070761-0.55270.291258
80.0098510.07690.469461
90.0189290.14780.441479
10-0.053222-0.41570.339551
11-0.065583-0.51220.305174
120.0221770.17320.431531
13-8.9e-05-7e-040.499725
14-0.006535-0.0510.47973
15-0.094456-0.73770.231754
16-0.019883-0.15530.438552
170.0287660.22470.411493
18-0.06749-0.52710.300014
19-0.039095-0.30530.380572
20-0.088808-0.69360.245279
21-0.015521-0.12120.451957
220.0063940.04990.480167
230.0117610.09190.463556
24-0.023541-0.18390.427365
250.0370670.28950.386589
26-0.009945-0.07770.469172
27-0.050285-0.39270.347941
28-0.085936-0.67120.252319
29-0.024781-0.19350.423589
30-0.008947-0.06990.472259
31-0.041087-0.32090.374693
32-0.054192-0.42330.3368
33-0.042114-0.32890.37167
34-0.006274-0.0490.480538
35-0.01779-0.13890.444977
360.0139780.10920.456713
370.02670.20850.417754
380.0568380.44390.329335
390.0405850.3170.376171
40-0.052998-0.41390.340189
41-0.063533-0.49620.310766
42-0.056433-0.44080.330475
43-0.126938-0.99140.1627
440.0544420.42520.336091
450.0229550.17930.429155
460.018760.14650.441996
470.0469830.36690.357463
480.0965510.75410.22685
490.0304630.23790.406368
500.0162680.12710.449656
510.042180.32940.371476
52-0.049362-0.38550.350594
530.0935050.73030.234002
540.0302650.23640.406966
55-0.102035-0.79690.214295
56-0.023917-0.18680.426219
57-0.056574-0.44190.330077
580.0938580.73310.233166
590.0291820.22790.410236
60-0.169816-1.32630.094841

\begin{tabular}{lllllllll}
\hline
Partial Autocorrelation Function \tabularnewline
Time lag k & PACF(k) & T-STAT & P-value \tabularnewline
1 & 0.968401 & 7.5635 & 0 \tabularnewline
2 & -0.091567 & -0.7152 & 0.238618 \tabularnewline
3 & -0.186656 & -1.4578 & 0.075009 \tabularnewline
4 & -0.059553 & -0.4651 & 0.321748 \tabularnewline
5 & 0.117677 & 0.9191 & 0.180834 \tabularnewline
6 & -0.166354 & -1.2993 & 0.099371 \tabularnewline
7 & -0.070761 & -0.5527 & 0.291258 \tabularnewline
8 & 0.009851 & 0.0769 & 0.469461 \tabularnewline
9 & 0.018929 & 0.1478 & 0.441479 \tabularnewline
10 & -0.053222 & -0.4157 & 0.339551 \tabularnewline
11 & -0.065583 & -0.5122 & 0.305174 \tabularnewline
12 & 0.022177 & 0.1732 & 0.431531 \tabularnewline
13 & -8.9e-05 & -7e-04 & 0.499725 \tabularnewline
14 & -0.006535 & -0.051 & 0.47973 \tabularnewline
15 & -0.094456 & -0.7377 & 0.231754 \tabularnewline
16 & -0.019883 & -0.1553 & 0.438552 \tabularnewline
17 & 0.028766 & 0.2247 & 0.411493 \tabularnewline
18 & -0.06749 & -0.5271 & 0.300014 \tabularnewline
19 & -0.039095 & -0.3053 & 0.380572 \tabularnewline
20 & -0.088808 & -0.6936 & 0.245279 \tabularnewline
21 & -0.015521 & -0.1212 & 0.451957 \tabularnewline
22 & 0.006394 & 0.0499 & 0.480167 \tabularnewline
23 & 0.011761 & 0.0919 & 0.463556 \tabularnewline
24 & -0.023541 & -0.1839 & 0.427365 \tabularnewline
25 & 0.037067 & 0.2895 & 0.386589 \tabularnewline
26 & -0.009945 & -0.0777 & 0.469172 \tabularnewline
27 & -0.050285 & -0.3927 & 0.347941 \tabularnewline
28 & -0.085936 & -0.6712 & 0.252319 \tabularnewline
29 & -0.024781 & -0.1935 & 0.423589 \tabularnewline
30 & -0.008947 & -0.0699 & 0.472259 \tabularnewline
31 & -0.041087 & -0.3209 & 0.374693 \tabularnewline
32 & -0.054192 & -0.4233 & 0.3368 \tabularnewline
33 & -0.042114 & -0.3289 & 0.37167 \tabularnewline
34 & -0.006274 & -0.049 & 0.480538 \tabularnewline
35 & -0.01779 & -0.1389 & 0.444977 \tabularnewline
36 & 0.013978 & 0.1092 & 0.456713 \tabularnewline
37 & 0.0267 & 0.2085 & 0.417754 \tabularnewline
38 & 0.056838 & 0.4439 & 0.329335 \tabularnewline
39 & 0.040585 & 0.317 & 0.376171 \tabularnewline
40 & -0.052998 & -0.4139 & 0.340189 \tabularnewline
41 & -0.063533 & -0.4962 & 0.310766 \tabularnewline
42 & -0.056433 & -0.4408 & 0.330475 \tabularnewline
43 & -0.126938 & -0.9914 & 0.1627 \tabularnewline
44 & 0.054442 & 0.4252 & 0.336091 \tabularnewline
45 & 0.022955 & 0.1793 & 0.429155 \tabularnewline
46 & 0.01876 & 0.1465 & 0.441996 \tabularnewline
47 & 0.046983 & 0.3669 & 0.357463 \tabularnewline
48 & 0.096551 & 0.7541 & 0.22685 \tabularnewline
49 & 0.030463 & 0.2379 & 0.406368 \tabularnewline
50 & 0.016268 & 0.1271 & 0.449656 \tabularnewline
51 & 0.04218 & 0.3294 & 0.371476 \tabularnewline
52 & -0.049362 & -0.3855 & 0.350594 \tabularnewline
53 & 0.093505 & 0.7303 & 0.234002 \tabularnewline
54 & 0.030265 & 0.2364 & 0.406966 \tabularnewline
55 & -0.102035 & -0.7969 & 0.214295 \tabularnewline
56 & -0.023917 & -0.1868 & 0.426219 \tabularnewline
57 & -0.056574 & -0.4419 & 0.330077 \tabularnewline
58 & 0.093858 & 0.7331 & 0.233166 \tabularnewline
59 & 0.029182 & 0.2279 & 0.410236 \tabularnewline
60 & -0.169816 & -1.3263 & 0.094841 \tabularnewline
\hline
\end{tabular}
%Source: https://freestatistics.org/blog/index.php?pk=35501&T=2

[TABLE]
[ROW][C]Partial Autocorrelation Function[/C][/ROW]
[ROW][C]Time lag k[/C][C]PACF(k)[/C][C]T-STAT[/C][C]P-value[/C][/ROW]
[ROW][C]1[/C][C]0.968401[/C][C]7.5635[/C][C]0[/C][/ROW]
[ROW][C]2[/C][C]-0.091567[/C][C]-0.7152[/C][C]0.238618[/C][/ROW]
[ROW][C]3[/C][C]-0.186656[/C][C]-1.4578[/C][C]0.075009[/C][/ROW]
[ROW][C]4[/C][C]-0.059553[/C][C]-0.4651[/C][C]0.321748[/C][/ROW]
[ROW][C]5[/C][C]0.117677[/C][C]0.9191[/C][C]0.180834[/C][/ROW]
[ROW][C]6[/C][C]-0.166354[/C][C]-1.2993[/C][C]0.099371[/C][/ROW]
[ROW][C]7[/C][C]-0.070761[/C][C]-0.5527[/C][C]0.291258[/C][/ROW]
[ROW][C]8[/C][C]0.009851[/C][C]0.0769[/C][C]0.469461[/C][/ROW]
[ROW][C]9[/C][C]0.018929[/C][C]0.1478[/C][C]0.441479[/C][/ROW]
[ROW][C]10[/C][C]-0.053222[/C][C]-0.4157[/C][C]0.339551[/C][/ROW]
[ROW][C]11[/C][C]-0.065583[/C][C]-0.5122[/C][C]0.305174[/C][/ROW]
[ROW][C]12[/C][C]0.022177[/C][C]0.1732[/C][C]0.431531[/C][/ROW]
[ROW][C]13[/C][C]-8.9e-05[/C][C]-7e-04[/C][C]0.499725[/C][/ROW]
[ROW][C]14[/C][C]-0.006535[/C][C]-0.051[/C][C]0.47973[/C][/ROW]
[ROW][C]15[/C][C]-0.094456[/C][C]-0.7377[/C][C]0.231754[/C][/ROW]
[ROW][C]16[/C][C]-0.019883[/C][C]-0.1553[/C][C]0.438552[/C][/ROW]
[ROW][C]17[/C][C]0.028766[/C][C]0.2247[/C][C]0.411493[/C][/ROW]
[ROW][C]18[/C][C]-0.06749[/C][C]-0.5271[/C][C]0.300014[/C][/ROW]
[ROW][C]19[/C][C]-0.039095[/C][C]-0.3053[/C][C]0.380572[/C][/ROW]
[ROW][C]20[/C][C]-0.088808[/C][C]-0.6936[/C][C]0.245279[/C][/ROW]
[ROW][C]21[/C][C]-0.015521[/C][C]-0.1212[/C][C]0.451957[/C][/ROW]
[ROW][C]22[/C][C]0.006394[/C][C]0.0499[/C][C]0.480167[/C][/ROW]
[ROW][C]23[/C][C]0.011761[/C][C]0.0919[/C][C]0.463556[/C][/ROW]
[ROW][C]24[/C][C]-0.023541[/C][C]-0.1839[/C][C]0.427365[/C][/ROW]
[ROW][C]25[/C][C]0.037067[/C][C]0.2895[/C][C]0.386589[/C][/ROW]
[ROW][C]26[/C][C]-0.009945[/C][C]-0.0777[/C][C]0.469172[/C][/ROW]
[ROW][C]27[/C][C]-0.050285[/C][C]-0.3927[/C][C]0.347941[/C][/ROW]
[ROW][C]28[/C][C]-0.085936[/C][C]-0.6712[/C][C]0.252319[/C][/ROW]
[ROW][C]29[/C][C]-0.024781[/C][C]-0.1935[/C][C]0.423589[/C][/ROW]
[ROW][C]30[/C][C]-0.008947[/C][C]-0.0699[/C][C]0.472259[/C][/ROW]
[ROW][C]31[/C][C]-0.041087[/C][C]-0.3209[/C][C]0.374693[/C][/ROW]
[ROW][C]32[/C][C]-0.054192[/C][C]-0.4233[/C][C]0.3368[/C][/ROW]
[ROW][C]33[/C][C]-0.042114[/C][C]-0.3289[/C][C]0.37167[/C][/ROW]
[ROW][C]34[/C][C]-0.006274[/C][C]-0.049[/C][C]0.480538[/C][/ROW]
[ROW][C]35[/C][C]-0.01779[/C][C]-0.1389[/C][C]0.444977[/C][/ROW]
[ROW][C]36[/C][C]0.013978[/C][C]0.1092[/C][C]0.456713[/C][/ROW]
[ROW][C]37[/C][C]0.0267[/C][C]0.2085[/C][C]0.417754[/C][/ROW]
[ROW][C]38[/C][C]0.056838[/C][C]0.4439[/C][C]0.329335[/C][/ROW]
[ROW][C]39[/C][C]0.040585[/C][C]0.317[/C][C]0.376171[/C][/ROW]
[ROW][C]40[/C][C]-0.052998[/C][C]-0.4139[/C][C]0.340189[/C][/ROW]
[ROW][C]41[/C][C]-0.063533[/C][C]-0.4962[/C][C]0.310766[/C][/ROW]
[ROW][C]42[/C][C]-0.056433[/C][C]-0.4408[/C][C]0.330475[/C][/ROW]
[ROW][C]43[/C][C]-0.126938[/C][C]-0.9914[/C][C]0.1627[/C][/ROW]
[ROW][C]44[/C][C]0.054442[/C][C]0.4252[/C][C]0.336091[/C][/ROW]
[ROW][C]45[/C][C]0.022955[/C][C]0.1793[/C][C]0.429155[/C][/ROW]
[ROW][C]46[/C][C]0.01876[/C][C]0.1465[/C][C]0.441996[/C][/ROW]
[ROW][C]47[/C][C]0.046983[/C][C]0.3669[/C][C]0.357463[/C][/ROW]
[ROW][C]48[/C][C]0.096551[/C][C]0.7541[/C][C]0.22685[/C][/ROW]
[ROW][C]49[/C][C]0.030463[/C][C]0.2379[/C][C]0.406368[/C][/ROW]
[ROW][C]50[/C][C]0.016268[/C][C]0.1271[/C][C]0.449656[/C][/ROW]
[ROW][C]51[/C][C]0.04218[/C][C]0.3294[/C][C]0.371476[/C][/ROW]
[ROW][C]52[/C][C]-0.049362[/C][C]-0.3855[/C][C]0.350594[/C][/ROW]
[ROW][C]53[/C][C]0.093505[/C][C]0.7303[/C][C]0.234002[/C][/ROW]
[ROW][C]54[/C][C]0.030265[/C][C]0.2364[/C][C]0.406966[/C][/ROW]
[ROW][C]55[/C][C]-0.102035[/C][C]-0.7969[/C][C]0.214295[/C][/ROW]
[ROW][C]56[/C][C]-0.023917[/C][C]-0.1868[/C][C]0.426219[/C][/ROW]
[ROW][C]57[/C][C]-0.056574[/C][C]-0.4419[/C][C]0.330077[/C][/ROW]
[ROW][C]58[/C][C]0.093858[/C][C]0.7331[/C][C]0.233166[/C][/ROW]
[ROW][C]59[/C][C]0.029182[/C][C]0.2279[/C][C]0.410236[/C][/ROW]
[ROW][C]60[/C][C]-0.169816[/C][C]-1.3263[/C][C]0.094841[/C][/ROW]
[/TABLE]
Source: https://freestatistics.org/blog/index.php?pk=35501&T=2

Globally Unique Identifier (entire table): ba.freestatistics.org/blog/index.php?pk=35501&T=2

As an alternative you can also use a QR Code:  

The GUIDs for individual cells are displayed in the table below:

Partial Autocorrelation Function
Time lag kPACF(k)T-STATP-value
10.9684017.56350
2-0.091567-0.71520.238618
3-0.186656-1.45780.075009
4-0.059553-0.46510.321748
50.1176770.91910.180834
6-0.166354-1.29930.099371
7-0.070761-0.55270.291258
80.0098510.07690.469461
90.0189290.14780.441479
10-0.053222-0.41570.339551
11-0.065583-0.51220.305174
120.0221770.17320.431531
13-8.9e-05-7e-040.499725
14-0.006535-0.0510.47973
15-0.094456-0.73770.231754
16-0.019883-0.15530.438552
170.0287660.22470.411493
18-0.06749-0.52710.300014
19-0.039095-0.30530.380572
20-0.088808-0.69360.245279
21-0.015521-0.12120.451957
220.0063940.04990.480167
230.0117610.09190.463556
24-0.023541-0.18390.427365
250.0370670.28950.386589
26-0.009945-0.07770.469172
27-0.050285-0.39270.347941
28-0.085936-0.67120.252319
29-0.024781-0.19350.423589
30-0.008947-0.06990.472259
31-0.041087-0.32090.374693
32-0.054192-0.42330.3368
33-0.042114-0.32890.37167
34-0.006274-0.0490.480538
35-0.01779-0.13890.444977
360.0139780.10920.456713
370.02670.20850.417754
380.0568380.44390.329335
390.0405850.3170.376171
40-0.052998-0.41390.340189
41-0.063533-0.49620.310766
42-0.056433-0.44080.330475
43-0.126938-0.99140.1627
440.0544420.42520.336091
450.0229550.17930.429155
460.018760.14650.441996
470.0469830.36690.357463
480.0965510.75410.22685
490.0304630.23790.406368
500.0162680.12710.449656
510.042180.32940.371476
52-0.049362-0.38550.350594
530.0935050.73030.234002
540.0302650.23640.406966
55-0.102035-0.79690.214295
56-0.023917-0.18680.426219
57-0.056574-0.44190.330077
580.0938580.73310.233166
590.0291820.22790.410236
60-0.169816-1.32630.094841


Parameters (Session):
par1 = 60 ; par2 = 1 ; par3 = 0 ; par4 = 0 ; par5 = 12 ;
Parameters (R input):
par1 = 60 ; par2 = 1 ; par3 = 0 ; par4 = 0 ; par5 = 12 ;
R code (references can be found in the software module):
if (par1 == 'Default') {
par1 = 10*log10(length(x))
} else {
par1 <- as.numeric(par1)
}
par2 <- as.numeric(par2)
par3 <- as.numeric(par3)
par4 <- as.numeric(par4)
par5 <- as.numeric(par5)
if (par2 == 0) {
x <- log(x)
} else {
x <- (x ^ par2 - 1) / par2
}
if (par3 > 0) x <- diff(x,lag=1,difference=par3)
if (par4 > 0) x <- diff(x,lag=par5,difference=par4)
bitmap(file='pic1.png')
racf <- acf(x,par1,main='Autocorrelation',xlab='lags',ylab='ACF')
dev.off()
bitmap(file='pic2.png')
rpacf <- pacf(x,par1,main='Partial Autocorrelation',xlab='lags',ylab='PACF')
dev.off()
(myacf <- c(racf$acf))
(mypacf <- c(rpacf$acf))
lengthx <- length(x)
sqrtn <- sqrt(lengthx)
load(file='createtable')
a<-table.start()
a<-table.row.start(a)
a<-table.element(a,'Autocorrelation Function',4,TRUE)
a<-table.row.end(a)
a<-table.row.start(a)
a<-table.element(a,'Time lag k',header=TRUE)
a<-table.element(a,hyperlink('basics.htm','ACF(k)','click here for more information about the Autocorrelation Function'),header=TRUE)
a<-table.element(a,'T-STAT',header=TRUE)
a<-table.element(a,'P-value',header=TRUE)
a<-table.row.end(a)
for (i in 2:(par1+1)) {
a<-table.row.start(a)
a<-table.element(a,i-1,header=TRUE)
a<-table.element(a,round(myacf[i],6))
mytstat <- myacf[i]*sqrtn
a<-table.element(a,round(mytstat,4))
a<-table.element(a,round(1-pt(abs(mytstat),lengthx),6))
a<-table.row.end(a)
}
a<-table.end(a)
table.save(a,file='mytable.tab')
a<-table.start()
a<-table.row.start(a)
a<-table.element(a,'Partial Autocorrelation Function',4,TRUE)
a<-table.row.end(a)
a<-table.row.start(a)
a<-table.element(a,'Time lag k',header=TRUE)
a<-table.element(a,hyperlink('basics.htm','PACF(k)','click here for more information about the Partial Autocorrelation Function'),header=TRUE)
a<-table.element(a,'T-STAT',header=TRUE)
a<-table.element(a,'P-value',header=TRUE)
a<-table.row.end(a)
for (i in 1:par1) {
a<-table.row.start(a)
a<-table.element(a,i,header=TRUE)
a<-table.element(a,round(mypacf[i],6))
mytstat <- mypacf[i]*sqrtn
a<-table.element(a,round(mytstat,4))
a<-table.element(a,round(1-pt(abs(mytstat),lengthx),6))
a<-table.row.end(a)
}
a<-table.end(a)
table.save(a,file='mytable1.tab')