Free Statistics

of Irreproducible Research!

Author's title

Author*The author of this computation has been verified*
R Software Modulerwasp_centraltendency.wasp
Title produced by softwareCentral Tendency
Date of computationSun, 21 Dec 2008 06:10:13 -0700
Cite this page as followsStatistical Computations at FreeStatistics.org, Office for Research Development and Education, URL https://freestatistics.org/blog/index.php?v=date/2008/Dec/21/t1229865273g3zzmn8i3f3utrk.htm/, Retrieved Sat, 18 May 2024 11:57:55 +0000
Statistical Computations at FreeStatistics.org, Office for Research Development and Education, URL https://freestatistics.org/blog/index.php?pk=35556, Retrieved Sat, 18 May 2024 11:57:55 +0000
QR Codes:

Original text written by user:
IsPrivate?No (this computation is public)
User-defined keywords
Estimated Impact168
Family? (F = Feedback message, R = changed R code, M = changed R Module, P = changed Parameters, D = changed Data)
-     [Standard Deviation-Mean Plot] [dollarkoers] [2007-11-29 14:04:00] [707a919fab5d6f3020ea3c395672cd86]
- RMPD    [Central Tendency] [] [2008-12-21 13:10:13] [e7fa5259715477c9f32960f5b339b707] [Current]
Feedback Forum

Post a new message
Dataseries X:
467
460
448
443
436
431
484
510
513
503
471
471
476
475
470
461
455
456
517
525
523
519
509
512
519
517
510
509
501
507
569
580
578
565
547
555


Summary of computational transaction
Raw Inputview raw input (R code)
Raw Outputview raw output of R engine
Computing time1 seconds
R Server'Gwilym Jenkins' @ 72.249.127.135

\begin{tabular}{lllllllll}
\hline
Summary of computational transaction \tabularnewline
Raw Input & view raw input (R code)  \tabularnewline
Raw Output & view raw output of R engine  \tabularnewline
Computing time & 1 seconds \tabularnewline
R Server & 'Gwilym Jenkins' @ 72.249.127.135 \tabularnewline
\hline
\end{tabular}
%Source: https://freestatistics.org/blog/index.php?pk=35556&T=0

[TABLE]
[ROW][C]Summary of computational transaction[/C][/ROW]
[ROW][C]Raw Input[/C][C]view raw input (R code) [/C][/ROW]
[ROW][C]Raw Output[/C][C]view raw output of R engine [/C][/ROW]
[ROW][C]Computing time[/C][C]1 seconds[/C][/ROW]
[ROW][C]R Server[/C][C]'Gwilym Jenkins' @ 72.249.127.135[/C][/ROW]
[/TABLE]
Source: https://freestatistics.org/blog/index.php?pk=35556&T=0

Globally Unique Identifier (entire table): ba.freestatistics.org/blog/index.php?pk=35556&T=0

As an alternative you can also use a QR Code:  

The GUIDs for individual cells are displayed in the table below:

Summary of computational transaction
Raw Inputview raw input (R code)
Raw Outputview raw output of R engine
Computing time1 seconds
R Server'Gwilym Jenkins' @ 72.249.127.135


Central Tendency - Ungrouped Data
MeasureValueS.E.Value/S.E.
Arithmetic Mean499.7777777777786.7206281725378774.3647416501916
Geometric Mean498.209543743724
Harmonic Mean496.655840144954
Quadratic Mean501.356825690712
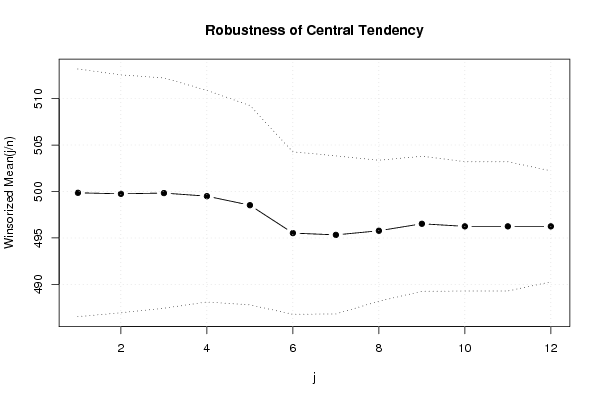
Winsorized Mean ( 1 / 12 )499.8611111111116.6625168962861275.0258676851909
Winsorized Mean ( 2 / 12 )499.756.3987070866662178.1017154295736
Winsorized Mean ( 3 / 12 )499.8333333333336.1944035161292980.6911161069573
Winsorized Mean ( 4 / 12 )499.55.6920300727601987.7542798641227
Winsorized Mean ( 5 / 12 )498.5277777777785.3621966168091292.9708127850105
Winsorized Mean ( 6 / 12 )495.5277777777784.37044295294405113.381591548742
Winsorized Mean ( 7 / 12 )495.3333333333334.25179700571156116.499760611322
Winsorized Mean ( 8 / 12 )495.7777777777783.79224587122136130.734608095995
Winsorized Mean ( 9 / 12 )496.5277777777783.63263123646984136.685434181395
Winsorized Mean ( 10 / 12 )496.253.47836282416138142.667693132226
Winsorized Mean ( 11 / 12 )496.253.47836282416138142.667693132226
Winsorized Mean ( 12 / 12 )496.252.98312050318252166.352649673581
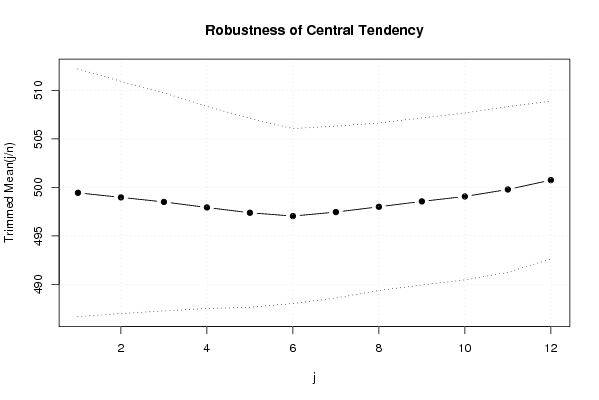
Trimmed Mean ( 1 / 12 )499.4411764705886.3848906953502178.2223534122997
Trimmed Mean ( 2 / 12 )498.968755.9852783734477483.366005533436
Trimmed Mean ( 3 / 12 )498.55.6215410821171788.6767512178807
Trimmed Mean ( 4 / 12 )497.9285714285715.2088469134541195.5928595525536
Trimmed Mean ( 5 / 12 )497.3846153846154.86813087589601102.171578386965
Trimmed Mean ( 6 / 12 )497.0416666666674.50984396990076110.212608237443
Trimmed Mean ( 7 / 12 )497.4545454545454.4306719574451112.275192167781
Trimmed Mean ( 8 / 12 )4984.31704089687174115.356794595313
Trimmed Mean ( 9 / 12 )498.5555555555564.30626707171719115.774416043534
Trimmed Mean ( 10 / 12 )499.06254.29967900933701116.069710998485
Trimmed Mean ( 11 / 12 )499.7857142857144.27126685716886117.011118948674
Trimmed Mean ( 12 / 12 )500.754.06784322274697123.09963107719
Median508
Midrange505.5
Midmean - Weighted Average at Xnp498
Midmean - Weighted Average at X(n+1)p499.631578947368
Midmean - Empirical Distribution Function498
Midmean - Empirical Distribution Function - Averaging499.631578947368
Midmean - Empirical Distribution Function - Interpolation499.631578947368
Midmean - Closest Observation498
Midmean - True Basic - Statistics Graphics Toolkit499.631578947368
Midmean - MS Excel (old versions)498
Number of observations36

\begin{tabular}{lllllllll}
\hline
Central Tendency - Ungrouped Data \tabularnewline
Measure & Value & S.E. & Value/S.E. \tabularnewline
Arithmetic Mean & 499.777777777778 & 6.72062817253787 & 74.3647416501916 \tabularnewline
Geometric Mean & 498.209543743724 &  &  \tabularnewline
Harmonic Mean & 496.655840144954 &  &  \tabularnewline
Quadratic Mean & 501.356825690712 &  &  \tabularnewline
Winsorized Mean ( 1 / 12 ) & 499.861111111111 & 6.66251689628612 & 75.0258676851909 \tabularnewline
Winsorized Mean ( 2 / 12 ) & 499.75 & 6.39870708666621 & 78.1017154295736 \tabularnewline
Winsorized Mean ( 3 / 12 ) & 499.833333333333 & 6.19440351612929 & 80.6911161069573 \tabularnewline
Winsorized Mean ( 4 / 12 ) & 499.5 & 5.69203007276019 & 87.7542798641227 \tabularnewline
Winsorized Mean ( 5 / 12 ) & 498.527777777778 & 5.36219661680912 & 92.9708127850105 \tabularnewline
Winsorized Mean ( 6 / 12 ) & 495.527777777778 & 4.37044295294405 & 113.381591548742 \tabularnewline
Winsorized Mean ( 7 / 12 ) & 495.333333333333 & 4.25179700571156 & 116.499760611322 \tabularnewline
Winsorized Mean ( 8 / 12 ) & 495.777777777778 & 3.79224587122136 & 130.734608095995 \tabularnewline
Winsorized Mean ( 9 / 12 ) & 496.527777777778 & 3.63263123646984 & 136.685434181395 \tabularnewline
Winsorized Mean ( 10 / 12 ) & 496.25 & 3.47836282416138 & 142.667693132226 \tabularnewline
Winsorized Mean ( 11 / 12 ) & 496.25 & 3.47836282416138 & 142.667693132226 \tabularnewline
Winsorized Mean ( 12 / 12 ) & 496.25 & 2.98312050318252 & 166.352649673581 \tabularnewline
Trimmed Mean ( 1 / 12 ) & 499.441176470588 & 6.38489069535021 & 78.2223534122997 \tabularnewline
Trimmed Mean ( 2 / 12 ) & 498.96875 & 5.98527837344774 & 83.366005533436 \tabularnewline
Trimmed Mean ( 3 / 12 ) & 498.5 & 5.62154108211717 & 88.6767512178807 \tabularnewline
Trimmed Mean ( 4 / 12 ) & 497.928571428571 & 5.20884691345411 & 95.5928595525536 \tabularnewline
Trimmed Mean ( 5 / 12 ) & 497.384615384615 & 4.86813087589601 & 102.171578386965 \tabularnewline
Trimmed Mean ( 6 / 12 ) & 497.041666666667 & 4.50984396990076 & 110.212608237443 \tabularnewline
Trimmed Mean ( 7 / 12 ) & 497.454545454545 & 4.4306719574451 & 112.275192167781 \tabularnewline
Trimmed Mean ( 8 / 12 ) & 498 & 4.31704089687174 & 115.356794595313 \tabularnewline
Trimmed Mean ( 9 / 12 ) & 498.555555555556 & 4.30626707171719 & 115.774416043534 \tabularnewline
Trimmed Mean ( 10 / 12 ) & 499.0625 & 4.29967900933701 & 116.069710998485 \tabularnewline
Trimmed Mean ( 11 / 12 ) & 499.785714285714 & 4.27126685716886 & 117.011118948674 \tabularnewline
Trimmed Mean ( 12 / 12 ) & 500.75 & 4.06784322274697 & 123.09963107719 \tabularnewline
Median & 508 &  &  \tabularnewline
Midrange & 505.5 &  &  \tabularnewline
Midmean - Weighted Average at Xnp & 498 &  &  \tabularnewline
Midmean - Weighted Average at X(n+1)p & 499.631578947368 &  &  \tabularnewline
Midmean - Empirical Distribution Function & 498 &  &  \tabularnewline
Midmean - Empirical Distribution Function - Averaging & 499.631578947368 &  &  \tabularnewline
Midmean - Empirical Distribution Function - Interpolation & 499.631578947368 &  &  \tabularnewline
Midmean - Closest Observation & 498 &  &  \tabularnewline
Midmean - True Basic - Statistics Graphics Toolkit & 499.631578947368 &  &  \tabularnewline
Midmean - MS Excel (old versions) & 498 &  &  \tabularnewline
Number of observations & 36 &  &  \tabularnewline
\hline
\end{tabular}
%Source: https://freestatistics.org/blog/index.php?pk=35556&T=1

[TABLE]
[ROW][C]Central Tendency - Ungrouped Data[/C][/ROW]
[ROW][C]Measure[/C][C]Value[/C][C]S.E.[/C][C]Value/S.E.[/C][/ROW]
[ROW][C]Arithmetic Mean[/C][C]499.777777777778[/C][C]6.72062817253787[/C][C]74.3647416501916[/C][/ROW]
[ROW][C]Geometric Mean[/C][C]498.209543743724[/C][C][/C][C][/C][/ROW]
[ROW][C]Harmonic Mean[/C][C]496.655840144954[/C][C][/C][C][/C][/ROW]
[ROW][C]Quadratic Mean[/C][C]501.356825690712[/C][C][/C][C][/C][/ROW]
[ROW][C]Winsorized Mean ( 1 / 12 )[/C][C]499.861111111111[/C][C]6.66251689628612[/C][C]75.0258676851909[/C][/ROW]
[ROW][C]Winsorized Mean ( 2 / 12 )[/C][C]499.75[/C][C]6.39870708666621[/C][C]78.1017154295736[/C][/ROW]
[ROW][C]Winsorized Mean ( 3 / 12 )[/C][C]499.833333333333[/C][C]6.19440351612929[/C][C]80.6911161069573[/C][/ROW]
[ROW][C]Winsorized Mean ( 4 / 12 )[/C][C]499.5[/C][C]5.69203007276019[/C][C]87.7542798641227[/C][/ROW]
[ROW][C]Winsorized Mean ( 5 / 12 )[/C][C]498.527777777778[/C][C]5.36219661680912[/C][C]92.9708127850105[/C][/ROW]
[ROW][C]Winsorized Mean ( 6 / 12 )[/C][C]495.527777777778[/C][C]4.37044295294405[/C][C]113.381591548742[/C][/ROW]
[ROW][C]Winsorized Mean ( 7 / 12 )[/C][C]495.333333333333[/C][C]4.25179700571156[/C][C]116.499760611322[/C][/ROW]
[ROW][C]Winsorized Mean ( 8 / 12 )[/C][C]495.777777777778[/C][C]3.79224587122136[/C][C]130.734608095995[/C][/ROW]
[ROW][C]Winsorized Mean ( 9 / 12 )[/C][C]496.527777777778[/C][C]3.63263123646984[/C][C]136.685434181395[/C][/ROW]
[ROW][C]Winsorized Mean ( 10 / 12 )[/C][C]496.25[/C][C]3.47836282416138[/C][C]142.667693132226[/C][/ROW]
[ROW][C]Winsorized Mean ( 11 / 12 )[/C][C]496.25[/C][C]3.47836282416138[/C][C]142.667693132226[/C][/ROW]
[ROW][C]Winsorized Mean ( 12 / 12 )[/C][C]496.25[/C][C]2.98312050318252[/C][C]166.352649673581[/C][/ROW]
[ROW][C]Trimmed Mean ( 1 / 12 )[/C][C]499.441176470588[/C][C]6.38489069535021[/C][C]78.2223534122997[/C][/ROW]
[ROW][C]Trimmed Mean ( 2 / 12 )[/C][C]498.96875[/C][C]5.98527837344774[/C][C]83.366005533436[/C][/ROW]
[ROW][C]Trimmed Mean ( 3 / 12 )[/C][C]498.5[/C][C]5.62154108211717[/C][C]88.6767512178807[/C][/ROW]
[ROW][C]Trimmed Mean ( 4 / 12 )[/C][C]497.928571428571[/C][C]5.20884691345411[/C][C]95.5928595525536[/C][/ROW]
[ROW][C]Trimmed Mean ( 5 / 12 )[/C][C]497.384615384615[/C][C]4.86813087589601[/C][C]102.171578386965[/C][/ROW]
[ROW][C]Trimmed Mean ( 6 / 12 )[/C][C]497.041666666667[/C][C]4.50984396990076[/C][C]110.212608237443[/C][/ROW]
[ROW][C]Trimmed Mean ( 7 / 12 )[/C][C]497.454545454545[/C][C]4.4306719574451[/C][C]112.275192167781[/C][/ROW]
[ROW][C]Trimmed Mean ( 8 / 12 )[/C][C]498[/C][C]4.31704089687174[/C][C]115.356794595313[/C][/ROW]
[ROW][C]Trimmed Mean ( 9 / 12 )[/C][C]498.555555555556[/C][C]4.30626707171719[/C][C]115.774416043534[/C][/ROW]
[ROW][C]Trimmed Mean ( 10 / 12 )[/C][C]499.0625[/C][C]4.29967900933701[/C][C]116.069710998485[/C][/ROW]
[ROW][C]Trimmed Mean ( 11 / 12 )[/C][C]499.785714285714[/C][C]4.27126685716886[/C][C]117.011118948674[/C][/ROW]
[ROW][C]Trimmed Mean ( 12 / 12 )[/C][C]500.75[/C][C]4.06784322274697[/C][C]123.09963107719[/C][/ROW]
[ROW][C]Median[/C][C]508[/C][C][/C][C][/C][/ROW]
[ROW][C]Midrange[/C][C]505.5[/C][C][/C][C][/C][/ROW]
[ROW][C]Midmean - Weighted Average at Xnp[/C][C]498[/C][C][/C][C][/C][/ROW]
[ROW][C]Midmean - Weighted Average at X(n+1)p[/C][C]499.631578947368[/C][C][/C][C][/C][/ROW]
[ROW][C]Midmean - Empirical Distribution Function[/C][C]498[/C][C][/C][C][/C][/ROW]
[ROW][C]Midmean - Empirical Distribution Function - Averaging[/C][C]499.631578947368[/C][C][/C][C][/C][/ROW]
[ROW][C]Midmean - Empirical Distribution Function - Interpolation[/C][C]499.631578947368[/C][C][/C][C][/C][/ROW]
[ROW][C]Midmean - Closest Observation[/C][C]498[/C][C][/C][C][/C][/ROW]
[ROW][C]Midmean - True Basic - Statistics Graphics Toolkit[/C][C]499.631578947368[/C][C][/C][C][/C][/ROW]
[ROW][C]Midmean - MS Excel (old versions)[/C][C]498[/C][C][/C][C][/C][/ROW]
[ROW][C]Number of observations[/C][C]36[/C][C][/C][C][/C][/ROW]
[/TABLE]
Source: https://freestatistics.org/blog/index.php?pk=35556&T=1

Globally Unique Identifier (entire table): ba.freestatistics.org/blog/index.php?pk=35556&T=1

As an alternative you can also use a QR Code:  

The GUIDs for individual cells are displayed in the table below:

Central Tendency - Ungrouped Data
MeasureValueS.E.Value/S.E.
Arithmetic Mean499.7777777777786.7206281725378774.3647416501916
Geometric Mean498.209543743724
Harmonic Mean496.655840144954
Quadratic Mean501.356825690712
Winsorized Mean ( 1 / 12 )499.8611111111116.6625168962861275.0258676851909
Winsorized Mean ( 2 / 12 )499.756.3987070866662178.1017154295736
Winsorized Mean ( 3 / 12 )499.8333333333336.1944035161292980.6911161069573
Winsorized Mean ( 4 / 12 )499.55.6920300727601987.7542798641227
Winsorized Mean ( 5 / 12 )498.5277777777785.3621966168091292.9708127850105
Winsorized Mean ( 6 / 12 )495.5277777777784.37044295294405113.381591548742
Winsorized Mean ( 7 / 12 )495.3333333333334.25179700571156116.499760611322
Winsorized Mean ( 8 / 12 )495.7777777777783.79224587122136130.734608095995
Winsorized Mean ( 9 / 12 )496.5277777777783.63263123646984136.685434181395
Winsorized Mean ( 10 / 12 )496.253.47836282416138142.667693132226
Winsorized Mean ( 11 / 12 )496.253.47836282416138142.667693132226
Winsorized Mean ( 12 / 12 )496.252.98312050318252166.352649673581
Trimmed Mean ( 1 / 12 )499.4411764705886.3848906953502178.2223534122997
Trimmed Mean ( 2 / 12 )498.968755.9852783734477483.366005533436
Trimmed Mean ( 3 / 12 )498.55.6215410821171788.6767512178807
Trimmed Mean ( 4 / 12 )497.9285714285715.2088469134541195.5928595525536
Trimmed Mean ( 5 / 12 )497.3846153846154.86813087589601102.171578386965
Trimmed Mean ( 6 / 12 )497.0416666666674.50984396990076110.212608237443
Trimmed Mean ( 7 / 12 )497.4545454545454.4306719574451112.275192167781
Trimmed Mean ( 8 / 12 )4984.31704089687174115.356794595313
Trimmed Mean ( 9 / 12 )498.5555555555564.30626707171719115.774416043534
Trimmed Mean ( 10 / 12 )499.06254.29967900933701116.069710998485
Trimmed Mean ( 11 / 12 )499.7857142857144.27126685716886117.011118948674
Trimmed Mean ( 12 / 12 )500.754.06784322274697123.09963107719
Median508
Midrange505.5
Midmean - Weighted Average at Xnp498
Midmean - Weighted Average at X(n+1)p499.631578947368
Midmean - Empirical Distribution Function498
Midmean - Empirical Distribution Function - Averaging499.631578947368
Midmean - Empirical Distribution Function - Interpolation499.631578947368
Midmean - Closest Observation498
Midmean - True Basic - Statistics Graphics Toolkit499.631578947368
Midmean - MS Excel (old versions)498
Number of observations36


Parameters (Session):
Parameters (R input):
R code (references can be found in the software module):
geomean <- function(x) {
return(exp(mean(log(x))))
}
harmean <- function(x) {
return(1/mean(1/x))
}
quamean <- function(x) {
return(sqrt(mean(x*x)))
}
winmean <- function(x) {
x <-sort(x[!is.na(x)])
n<-length(x)
denom <- 3
nodenom <- n/denom
if (nodenom>40) denom <- n/40
sqrtn = sqrt(n)
roundnodenom = floor(nodenom)
win <- array(NA,dim=c(roundnodenom,2))
for (j in 1:roundnodenom) {
win[j,1] <- (j*x[j+1]+sum(x[(j+1):(n-j)])+j*x[n-j])/n
win[j,2] <- sd(c(rep(x[j+1],j),x[(j+1):(n-j)],rep(x[n-j],j)))/sqrtn
}
return(win)
}
trimean <- function(x) {
x <-sort(x[!is.na(x)])
n<-length(x)
denom <- 3
nodenom <- n/denom
if (nodenom>40) denom <- n/40
sqrtn = sqrt(n)
roundnodenom = floor(nodenom)
tri <- array(NA,dim=c(roundnodenom,2))
for (j in 1:roundnodenom) {
tri[j,1] <- mean(x,trim=j/n)
tri[j,2] <- sd(x[(j+1):(n-j)]) / sqrt(n-j*2)
}
return(tri)
}
midrange <- function(x) {
return((max(x)+min(x))/2)
}
q1 <- function(data,n,p,i,f) {
np <- n*p;
i <<- floor(np)
f <<- np - i
qvalue <- (1-f)*data[i] + f*data[i+1]
}
q2 <- function(data,n,p,i,f) {
np <- (n+1)*p
i <<- floor(np)
f <<- np - i
qvalue <- (1-f)*data[i] + f*data[i+1]
}
q3 <- function(data,n,p,i,f) {
np <- n*p
i <<- floor(np)
f <<- np - i
if (f==0) {
qvalue <- data[i]
} else {
qvalue <- data[i+1]
}
}
q4 <- function(data,n,p,i,f) {
np <- n*p
i <<- floor(np)
f <<- np - i
if (f==0) {
qvalue <- (data[i]+data[i+1])/2
} else {
qvalue <- data[i+1]
}
}
q5 <- function(data,n,p,i,f) {
np <- (n-1)*p
i <<- floor(np)
f <<- np - i
if (f==0) {
qvalue <- data[i+1]
} else {
qvalue <- data[i+1] + f*(data[i+2]-data[i+1])
}
}
q6 <- function(data,n,p,i,f) {
np <- n*p+0.5
i <<- floor(np)
f <<- np - i
qvalue <- data[i]
}
q7 <- function(data,n,p,i,f) {
np <- (n+1)*p
i <<- floor(np)
f <<- np - i
if (f==0) {
qvalue <- data[i]
} else {
qvalue <- f*data[i] + (1-f)*data[i+1]
}
}
q8 <- function(data,n,p,i,f) {
np <- (n+1)*p
i <<- floor(np)
f <<- np - i
if (f==0) {
qvalue <- data[i]
} else {
if (f == 0.5) {
qvalue <- (data[i]+data[i+1])/2
} else {
if (f < 0.5) {
qvalue <- data[i]
} else {
qvalue <- data[i+1]
}
}
}
}
midmean <- function(x,def) {
x <-sort(x[!is.na(x)])
n<-length(x)
if (def==1) {
qvalue1 <- q1(x,n,0.25,i,f)
qvalue3 <- q1(x,n,0.75,i,f)
}
if (def==2) {
qvalue1 <- q2(x,n,0.25,i,f)
qvalue3 <- q2(x,n,0.75,i,f)
}
if (def==3) {
qvalue1 <- q3(x,n,0.25,i,f)
qvalue3 <- q3(x,n,0.75,i,f)
}
if (def==4) {
qvalue1 <- q4(x,n,0.25,i,f)
qvalue3 <- q4(x,n,0.75,i,f)
}
if (def==5) {
qvalue1 <- q5(x,n,0.25,i,f)
qvalue3 <- q5(x,n,0.75,i,f)
}
if (def==6) {
qvalue1 <- q6(x,n,0.25,i,f)
qvalue3 <- q6(x,n,0.75,i,f)
}
if (def==7) {
qvalue1 <- q7(x,n,0.25,i,f)
qvalue3 <- q7(x,n,0.75,i,f)
}
if (def==8) {
qvalue1 <- q8(x,n,0.25,i,f)
qvalue3 <- q8(x,n,0.75,i,f)
}
midm <- 0
myn <- 0
roundno4 <- round(n/4)
round3no4 <- round(3*n/4)
for (i in 1:n) {
if ((x[i]>=qvalue1) & (x[i]<=qvalue3)){
midm = midm + x[i]
myn = myn + 1
}
}
midm = midm / myn
return(midm)
}
(arm <- mean(x))
sqrtn <- sqrt(length(x))
(armse <- sd(x) / sqrtn)
(armose <- arm / armse)
(geo <- geomean(x))
(har <- harmean(x))
(qua <- quamean(x))
(win <- winmean(x))
(tri <- trimean(x))
(midr <- midrange(x))
midm <- array(NA,dim=8)
for (j in 1:8) midm[j] <- midmean(x,j)
midm
bitmap(file='test1.png')
lb <- win[,1] - 2*win[,2]
ub <- win[,1] + 2*win[,2]
if ((ylimmin == '') | (ylimmax == '')) plot(win[,1],type='b',main=main, xlab='j', pch=19, ylab='Winsorized Mean(j/n)', ylim=c(min(lb),max(ub))) else plot(win[,1],type='l',main=main, xlab='j', pch=19, ylab='Winsorized Mean(j/n)', ylim=c(ylimmin,ylimmax))
lines(ub,lty=3)
lines(lb,lty=3)
grid()
dev.off()
bitmap(file='test2.png')
lb <- tri[,1] - 2*tri[,2]
ub <- tri[,1] + 2*tri[,2]
if ((ylimmin == '') | (ylimmax == '')) plot(tri[,1],type='b',main=main, xlab='j', pch=19, ylab='Trimmed Mean(j/n)', ylim=c(min(lb),max(ub))) else plot(tri[,1],type='l',main=main, xlab='j', pch=19, ylab='Trimmed Mean(j/n)', ylim=c(ylimmin,ylimmax))
lines(ub,lty=3)
lines(lb,lty=3)
grid()
dev.off()
load(file='createtable')
a<-table.start()
a<-table.row.start(a)
a<-table.element(a,'Central Tendency - Ungrouped Data',4,TRUE)
a<-table.row.end(a)
a<-table.row.start(a)
a<-table.element(a,'Measure',header=TRUE)
a<-table.element(a,'Value',header=TRUE)
a<-table.element(a,'S.E.',header=TRUE)
a<-table.element(a,'Value/S.E.',header=TRUE)
a<-table.row.end(a)
a<-table.row.start(a)
a<-table.element(a,hyperlink('arithmetic_mean.htm', 'Arithmetic Mean', 'click to view the definition of the Arithmetic Mean'),header=TRUE)
a<-table.element(a,arm)
a<-table.element(a,hyperlink('arithmetic_mean_standard_error.htm', armse, 'click to view the definition of the Standard Error of the Arithmetic Mean'))
a<-table.element(a,armose)
a<-table.row.end(a)
a<-table.row.start(a)
a<-table.element(a,hyperlink('geometric_mean.htm', 'Geometric Mean', 'click to view the definition of the Geometric Mean'),header=TRUE)
a<-table.element(a,geo)
a<-table.element(a,'')
a<-table.row.end(a)
a<-table.row.start(a)
a<-table.element(a,hyperlink('harmonic_mean.htm', 'Harmonic Mean', 'click to view the definition of the Harmonic Mean'),header=TRUE)
a<-table.element(a,har)
a<-table.element(a,'')
a<-table.row.end(a)
a<-table.row.start(a)
a<-table.element(a,hyperlink('quadratic_mean.htm', 'Quadratic Mean', 'click to view the definition of the Quadratic Mean'),header=TRUE)
a<-table.element(a,qua)
a<-table.element(a,'')
a<-table.row.end(a)
for (j in 1:length(win[,1])) {
a<-table.row.start(a)
mylabel <- paste('Winsorized Mean (',j)
mylabel <- paste(mylabel,'/')
mylabel <- paste(mylabel,length(win[,1]))
mylabel <- paste(mylabel,')')
a<-table.element(a,hyperlink('winsorized_mean.htm', mylabel, 'click to view the definition of the Winsorized Mean'),header=TRUE)
a<-table.element(a,win[j,1])
a<-table.element(a,win[j,2])
a<-table.element(a,win[j,1]/win[j,2])
a<-table.row.end(a)
}
for (j in 1:length(tri[,1])) {
a<-table.row.start(a)
mylabel <- paste('Trimmed Mean (',j)
mylabel <- paste(mylabel,'/')
mylabel <- paste(mylabel,length(tri[,1]))
mylabel <- paste(mylabel,')')
a<-table.element(a,hyperlink('arithmetic_mean.htm', mylabel, 'click to view the definition of the Trimmed Mean'),header=TRUE)
a<-table.element(a,tri[j,1])
a<-table.element(a,tri[j,2])
a<-table.element(a,tri[j,1]/tri[j,2])
a<-table.row.end(a)
}
a<-table.row.start(a)
a<-table.element(a,hyperlink('median_1.htm', 'Median', 'click to view the definition of the Median'),header=TRUE)
a<-table.element(a,median(x))
a<-table.element(a,'')
a<-table.row.end(a)
a<-table.row.start(a)
a<-table.element(a,hyperlink('midrange.htm', 'Midrange', 'click to view the definition of the Midrange'),header=TRUE)
a<-table.element(a,midr)
a<-table.element(a,'')
a<-table.row.end(a)
a<-table.row.start(a)
mymid <- hyperlink('midmean.htm', 'Midmean', 'click to view the definition of the Midmean')
mylabel <- paste(mymid,hyperlink('method_1.htm','Weighted Average at Xnp',''),sep=' - ')
a<-table.element(a,mylabel,header=TRUE)
a<-table.element(a,midm[1])
a<-table.element(a,'')
a<-table.row.end(a)
a<-table.row.start(a)
mymid <- hyperlink('midmean.htm', 'Midmean', 'click to view the definition of the Midmean')
mylabel <- paste(mymid,hyperlink('method_2.htm','Weighted Average at X(n+1)p',''),sep=' - ')
a<-table.element(a,mylabel,header=TRUE)
a<-table.element(a,midm[2])
a<-table.element(a,'')
a<-table.row.end(a)
a<-table.row.start(a)
mymid <- hyperlink('midmean.htm', 'Midmean', 'click to view the definition of the Midmean')
mylabel <- paste(mymid,hyperlink('method_3.htm','Empirical Distribution Function',''),sep=' - ')
a<-table.element(a,mylabel,header=TRUE)
a<-table.element(a,midm[3])
a<-table.element(a,'')
a<-table.row.end(a)
a<-table.row.start(a)
mymid <- hyperlink('midmean.htm', 'Midmean', 'click to view the definition of the Midmean')
mylabel <- paste(mymid,hyperlink('method_4.htm','Empirical Distribution Function - Averaging',''),sep=' - ')
a<-table.element(a,mylabel,header=TRUE)
a<-table.element(a,midm[4])
a<-table.element(a,'')
a<-table.row.end(a)
a<-table.row.start(a)
mymid <- hyperlink('midmean.htm', 'Midmean', 'click to view the definition of the Midmean')
mylabel <- paste(mymid,hyperlink('method_5.htm','Empirical Distribution Function - Interpolation',''),sep=' - ')
a<-table.element(a,mylabel,header=TRUE)
a<-table.element(a,midm[5])
a<-table.element(a,'')
a<-table.row.end(a)
a<-table.row.start(a)
mymid <- hyperlink('midmean.htm', 'Midmean', 'click to view the definition of the Midmean')
mylabel <- paste(mymid,hyperlink('method_6.htm','Closest Observation',''),sep=' - ')
a<-table.element(a,mylabel,header=TRUE)
a<-table.element(a,midm[6])
a<-table.element(a,'')
a<-table.row.end(a)
a<-table.row.start(a)
mymid <- hyperlink('midmean.htm', 'Midmean', 'click to view the definition of the Midmean')
mylabel <- paste(mymid,hyperlink('method_7.htm','True Basic - Statistics Graphics Toolkit',''),sep=' - ')
a<-table.element(a,mylabel,header=TRUE)
a<-table.element(a,midm[7])
a<-table.element(a,'')
a<-table.row.end(a)
a<-table.row.start(a)
mymid <- hyperlink('midmean.htm', 'Midmean', 'click to view the definition of the Midmean')
mylabel <- paste(mymid,hyperlink('method_8.htm','MS Excel (old versions)',''),sep=' - ')
a<-table.element(a,mylabel,header=TRUE)
a<-table.element(a,midm[8])
a<-table.element(a,'')
a<-table.row.end(a)
a<-table.row.start(a)
a<-table.element(a,'Number of observations',header=TRUE)
a<-table.element(a,length(x))
a<-table.element(a,'')
a<-table.row.end(a)
a<-table.end(a)
table.save(a,file='mytable.tab')