Free Statistics

of Irreproducible Research!

Author's title

Author*Unverified author*
R Software Modulerwasp_autocorrelation.wasp
Title produced by software(Partial) Autocorrelation Function
Date of computationMon, 22 Dec 2008 17:38:36 -0700
Cite this page as followsStatistical Computations at FreeStatistics.org, Office for Research Development and Education, URL https://freestatistics.org/blog/index.php?v=date/2008/Dec/23/t12299927509rwz2yr0t7dqwdd.htm/, Retrieved Sat, 18 May 2024 10:44:17 +0000
Statistical Computations at FreeStatistics.org, Office for Research Development and Education, URL https://freestatistics.org/blog/index.php?pk=36260, Retrieved Sat, 18 May 2024 10:44:17 +0000
QR Codes:

Original text written by user:
IsPrivate?No (this computation is public)
User-defined keywords
Estimated Impact165
Family? (F = Feedback message, R = changed R code, M = changed R Module, P = changed Parameters, D = changed Data)
-       [(Partial) Autocorrelation Function] [ACF productie] [2008-12-23 00:38:36] [af8fa2ce3787e7eb62013778260b011d] [Current]
Feedback Forum

Post a new message
Dataseries X:
98.6
98
106.8
96.6
100.1
107.7
91.5
97.8
107.4
117.5
105.6
97.4
99.5
98
104.3
100.6
101.1
103.9
96.9
95.5
108.4
117
103.8
100.8
110.6
104
112.6
107.3
98.9
109.8
104.9
102.2
123.9
124.9
112.7
121.9
100.6
104.3
120.4
107.5
102.9
125.6
107.5
108.8
128.4
121.1
119.5
128.7
108.7
105.5
119.8
111.3
110.6
120.1
97.5
107.7
127.3
117.2
119.8
116.2


Summary of computational transaction
Raw Inputview raw input (R code)
Raw Outputview raw output of R engine
Computing time4 seconds
R Server'Sir Ronald Aylmer Fisher' @ 193.190.124.24

\begin{tabular}{lllllllll}
\hline
Summary of computational transaction \tabularnewline
Raw Input & view raw input (R code)  \tabularnewline
Raw Output & view raw output of R engine  \tabularnewline
Computing time & 4 seconds \tabularnewline
R Server & 'Sir Ronald Aylmer Fisher' @ 193.190.124.24 \tabularnewline
\hline
\end{tabular}
%Source: https://freestatistics.org/blog/index.php?pk=36260&T=0

[TABLE]
[ROW][C]Summary of computational transaction[/C][/ROW]
[ROW][C]Raw Input[/C][C]view raw input (R code) [/C][/ROW]
[ROW][C]Raw Output[/C][C]view raw output of R engine [/C][/ROW]
[ROW][C]Computing time[/C][C]4 seconds[/C][/ROW]
[ROW][C]R Server[/C][C]'Sir Ronald Aylmer Fisher' @ 193.190.124.24[/C][/ROW]
[/TABLE]
Source: https://freestatistics.org/blog/index.php?pk=36260&T=0

Globally Unique Identifier (entire table): ba.freestatistics.org/blog/index.php?pk=36260&T=0

As an alternative you can also use a QR Code:  

The GUIDs for individual cells are displayed in the table below:

Summary of computational transaction
Raw Inputview raw input (R code)
Raw Outputview raw output of R engine
Computing time4 seconds
R Server'Sir Ronald Aylmer Fisher' @ 193.190.124.24


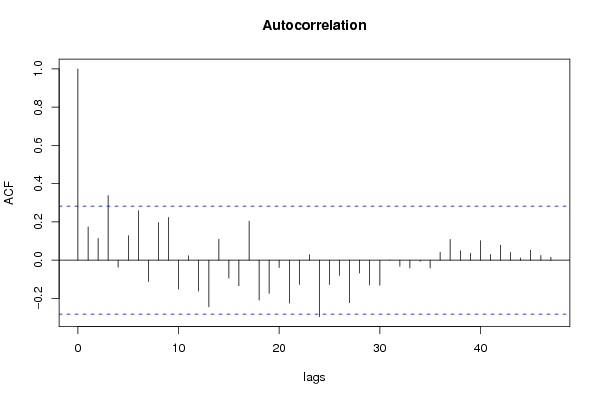
Autocorrelation Function
Time lag kACF(k)T-STATP-value
10.1734161.20150.117734
20.1136460.78740.217471
30.3376382.33920.011767
4-0.037148-0.25740.398998
50.12790.88610.189987
60.258461.79070.039827
7-0.112313-0.77810.220156
80.1964521.36110.089926
90.2231511.5460.064332
10-0.150604-1.04340.150992
110.0228310.15820.437491
12-0.16127-1.11730.134711
13-0.244235-1.69210.048554
140.1089320.75470.227057
15-0.094023-0.65140.258945
16-0.134039-0.92870.178858
170.2035741.41040.082435
18-0.209045-1.44830.077016
19-0.17308-1.19910.118181
20-0.038313-0.26540.395904
21-0.224526-1.55560.063191
22-0.127111-0.88060.191448
230.0284840.19730.422197
24-0.295514-2.04740.023058
25-0.127955-0.88650.189884
26-0.079941-0.55390.291126
27-0.222635-1.54250.064764
28-0.067416-0.46710.321282
29-0.12999-0.90060.18615
30-0.131311-0.90980.18375
31-0.000516-0.00360.49858
32-0.031866-0.22080.413101
33-0.041424-0.2870.387676
34-0.005687-0.03940.484368
35-0.041636-0.28850.387118
360.0407050.2820.389573
370.1085960.75240.227749
380.0496460.3440.366191
390.0360240.24960.401988
400.1016870.70450.24226
410.0298610.20690.418489
420.0782620.54220.295089
430.0402690.2790.390726
440.0114390.07920.468582
450.0512970.35540.361924
460.0243640.16880.433333
470.0149650.10370.458927
48NANANA
49NANANA
50NANANA
51NANANA
52NANANA
53NANANA
54NANANA
55NANANA
56NANANA
57NANANA
58NANANA
59NANANA
60NANANA

\begin{tabular}{lllllllll}
\hline
Autocorrelation Function \tabularnewline
Time lag k & ACF(k) & T-STAT & P-value \tabularnewline
1 & 0.173416 & 1.2015 & 0.117734 \tabularnewline
2 & 0.113646 & 0.7874 & 0.217471 \tabularnewline
3 & 0.337638 & 2.3392 & 0.011767 \tabularnewline
4 & -0.037148 & -0.2574 & 0.398998 \tabularnewline
5 & 0.1279 & 0.8861 & 0.189987 \tabularnewline
6 & 0.25846 & 1.7907 & 0.039827 \tabularnewline
7 & -0.112313 & -0.7781 & 0.220156 \tabularnewline
8 & 0.196452 & 1.3611 & 0.089926 \tabularnewline
9 & 0.223151 & 1.546 & 0.064332 \tabularnewline
10 & -0.150604 & -1.0434 & 0.150992 \tabularnewline
11 & 0.022831 & 0.1582 & 0.437491 \tabularnewline
12 & -0.16127 & -1.1173 & 0.134711 \tabularnewline
13 & -0.244235 & -1.6921 & 0.048554 \tabularnewline
14 & 0.108932 & 0.7547 & 0.227057 \tabularnewline
15 & -0.094023 & -0.6514 & 0.258945 \tabularnewline
16 & -0.134039 & -0.9287 & 0.178858 \tabularnewline
17 & 0.203574 & 1.4104 & 0.082435 \tabularnewline
18 & -0.209045 & -1.4483 & 0.077016 \tabularnewline
19 & -0.17308 & -1.1991 & 0.118181 \tabularnewline
20 & -0.038313 & -0.2654 & 0.395904 \tabularnewline
21 & -0.224526 & -1.5556 & 0.063191 \tabularnewline
22 & -0.127111 & -0.8806 & 0.191448 \tabularnewline
23 & 0.028484 & 0.1973 & 0.422197 \tabularnewline
24 & -0.295514 & -2.0474 & 0.023058 \tabularnewline
25 & -0.127955 & -0.8865 & 0.189884 \tabularnewline
26 & -0.079941 & -0.5539 & 0.291126 \tabularnewline
27 & -0.222635 & -1.5425 & 0.064764 \tabularnewline
28 & -0.067416 & -0.4671 & 0.321282 \tabularnewline
29 & -0.12999 & -0.9006 & 0.18615 \tabularnewline
30 & -0.131311 & -0.9098 & 0.18375 \tabularnewline
31 & -0.000516 & -0.0036 & 0.49858 \tabularnewline
32 & -0.031866 & -0.2208 & 0.413101 \tabularnewline
33 & -0.041424 & -0.287 & 0.387676 \tabularnewline
34 & -0.005687 & -0.0394 & 0.484368 \tabularnewline
35 & -0.041636 & -0.2885 & 0.387118 \tabularnewline
36 & 0.040705 & 0.282 & 0.389573 \tabularnewline
37 & 0.108596 & 0.7524 & 0.227749 \tabularnewline
38 & 0.049646 & 0.344 & 0.366191 \tabularnewline
39 & 0.036024 & 0.2496 & 0.401988 \tabularnewline
40 & 0.101687 & 0.7045 & 0.24226 \tabularnewline
41 & 0.029861 & 0.2069 & 0.418489 \tabularnewline
42 & 0.078262 & 0.5422 & 0.295089 \tabularnewline
43 & 0.040269 & 0.279 & 0.390726 \tabularnewline
44 & 0.011439 & 0.0792 & 0.468582 \tabularnewline
45 & 0.051297 & 0.3554 & 0.361924 \tabularnewline
46 & 0.024364 & 0.1688 & 0.433333 \tabularnewline
47 & 0.014965 & 0.1037 & 0.458927 \tabularnewline
48 & NA & NA & NA \tabularnewline
49 & NA & NA & NA \tabularnewline
50 & NA & NA & NA \tabularnewline
51 & NA & NA & NA \tabularnewline
52 & NA & NA & NA \tabularnewline
53 & NA & NA & NA \tabularnewline
54 & NA & NA & NA \tabularnewline
55 & NA & NA & NA \tabularnewline
56 & NA & NA & NA \tabularnewline
57 & NA & NA & NA \tabularnewline
58 & NA & NA & NA \tabularnewline
59 & NA & NA & NA \tabularnewline
60 & NA & NA & NA \tabularnewline
\hline
\end{tabular}
%Source: https://freestatistics.org/blog/index.php?pk=36260&T=1

[TABLE]
[ROW][C]Autocorrelation Function[/C][/ROW]
[ROW][C]Time lag k[/C][C]ACF(k)[/C][C]T-STAT[/C][C]P-value[/C][/ROW]
[ROW][C]1[/C][C]0.173416[/C][C]1.2015[/C][C]0.117734[/C][/ROW]
[ROW][C]2[/C][C]0.113646[/C][C]0.7874[/C][C]0.217471[/C][/ROW]
[ROW][C]3[/C][C]0.337638[/C][C]2.3392[/C][C]0.011767[/C][/ROW]
[ROW][C]4[/C][C]-0.037148[/C][C]-0.2574[/C][C]0.398998[/C][/ROW]
[ROW][C]5[/C][C]0.1279[/C][C]0.8861[/C][C]0.189987[/C][/ROW]
[ROW][C]6[/C][C]0.25846[/C][C]1.7907[/C][C]0.039827[/C][/ROW]
[ROW][C]7[/C][C]-0.112313[/C][C]-0.7781[/C][C]0.220156[/C][/ROW]
[ROW][C]8[/C][C]0.196452[/C][C]1.3611[/C][C]0.089926[/C][/ROW]
[ROW][C]9[/C][C]0.223151[/C][C]1.546[/C][C]0.064332[/C][/ROW]
[ROW][C]10[/C][C]-0.150604[/C][C]-1.0434[/C][C]0.150992[/C][/ROW]
[ROW][C]11[/C][C]0.022831[/C][C]0.1582[/C][C]0.437491[/C][/ROW]
[ROW][C]12[/C][C]-0.16127[/C][C]-1.1173[/C][C]0.134711[/C][/ROW]
[ROW][C]13[/C][C]-0.244235[/C][C]-1.6921[/C][C]0.048554[/C][/ROW]
[ROW][C]14[/C][C]0.108932[/C][C]0.7547[/C][C]0.227057[/C][/ROW]
[ROW][C]15[/C][C]-0.094023[/C][C]-0.6514[/C][C]0.258945[/C][/ROW]
[ROW][C]16[/C][C]-0.134039[/C][C]-0.9287[/C][C]0.178858[/C][/ROW]
[ROW][C]17[/C][C]0.203574[/C][C]1.4104[/C][C]0.082435[/C][/ROW]
[ROW][C]18[/C][C]-0.209045[/C][C]-1.4483[/C][C]0.077016[/C][/ROW]
[ROW][C]19[/C][C]-0.17308[/C][C]-1.1991[/C][C]0.118181[/C][/ROW]
[ROW][C]20[/C][C]-0.038313[/C][C]-0.2654[/C][C]0.395904[/C][/ROW]
[ROW][C]21[/C][C]-0.224526[/C][C]-1.5556[/C][C]0.063191[/C][/ROW]
[ROW][C]22[/C][C]-0.127111[/C][C]-0.8806[/C][C]0.191448[/C][/ROW]
[ROW][C]23[/C][C]0.028484[/C][C]0.1973[/C][C]0.422197[/C][/ROW]
[ROW][C]24[/C][C]-0.295514[/C][C]-2.0474[/C][C]0.023058[/C][/ROW]
[ROW][C]25[/C][C]-0.127955[/C][C]-0.8865[/C][C]0.189884[/C][/ROW]
[ROW][C]26[/C][C]-0.079941[/C][C]-0.5539[/C][C]0.291126[/C][/ROW]
[ROW][C]27[/C][C]-0.222635[/C][C]-1.5425[/C][C]0.064764[/C][/ROW]
[ROW][C]28[/C][C]-0.067416[/C][C]-0.4671[/C][C]0.321282[/C][/ROW]
[ROW][C]29[/C][C]-0.12999[/C][C]-0.9006[/C][C]0.18615[/C][/ROW]
[ROW][C]30[/C][C]-0.131311[/C][C]-0.9098[/C][C]0.18375[/C][/ROW]
[ROW][C]31[/C][C]-0.000516[/C][C]-0.0036[/C][C]0.49858[/C][/ROW]
[ROW][C]32[/C][C]-0.031866[/C][C]-0.2208[/C][C]0.413101[/C][/ROW]
[ROW][C]33[/C][C]-0.041424[/C][C]-0.287[/C][C]0.387676[/C][/ROW]
[ROW][C]34[/C][C]-0.005687[/C][C]-0.0394[/C][C]0.484368[/C][/ROW]
[ROW][C]35[/C][C]-0.041636[/C][C]-0.2885[/C][C]0.387118[/C][/ROW]
[ROW][C]36[/C][C]0.040705[/C][C]0.282[/C][C]0.389573[/C][/ROW]
[ROW][C]37[/C][C]0.108596[/C][C]0.7524[/C][C]0.227749[/C][/ROW]
[ROW][C]38[/C][C]0.049646[/C][C]0.344[/C][C]0.366191[/C][/ROW]
[ROW][C]39[/C][C]0.036024[/C][C]0.2496[/C][C]0.401988[/C][/ROW]
[ROW][C]40[/C][C]0.101687[/C][C]0.7045[/C][C]0.24226[/C][/ROW]
[ROW][C]41[/C][C]0.029861[/C][C]0.2069[/C][C]0.418489[/C][/ROW]
[ROW][C]42[/C][C]0.078262[/C][C]0.5422[/C][C]0.295089[/C][/ROW]
[ROW][C]43[/C][C]0.040269[/C][C]0.279[/C][C]0.390726[/C][/ROW]
[ROW][C]44[/C][C]0.011439[/C][C]0.0792[/C][C]0.468582[/C][/ROW]
[ROW][C]45[/C][C]0.051297[/C][C]0.3554[/C][C]0.361924[/C][/ROW]
[ROW][C]46[/C][C]0.024364[/C][C]0.1688[/C][C]0.433333[/C][/ROW]
[ROW][C]47[/C][C]0.014965[/C][C]0.1037[/C][C]0.458927[/C][/ROW]
[ROW][C]48[/C][C]NA[/C][C]NA[/C][C]NA[/C][/ROW]
[ROW][C]49[/C][C]NA[/C][C]NA[/C][C]NA[/C][/ROW]
[ROW][C]50[/C][C]NA[/C][C]NA[/C][C]NA[/C][/ROW]
[ROW][C]51[/C][C]NA[/C][C]NA[/C][C]NA[/C][/ROW]
[ROW][C]52[/C][C]NA[/C][C]NA[/C][C]NA[/C][/ROW]
[ROW][C]53[/C][C]NA[/C][C]NA[/C][C]NA[/C][/ROW]
[ROW][C]54[/C][C]NA[/C][C]NA[/C][C]NA[/C][/ROW]
[ROW][C]55[/C][C]NA[/C][C]NA[/C][C]NA[/C][/ROW]
[ROW][C]56[/C][C]NA[/C][C]NA[/C][C]NA[/C][/ROW]
[ROW][C]57[/C][C]NA[/C][C]NA[/C][C]NA[/C][/ROW]
[ROW][C]58[/C][C]NA[/C][C]NA[/C][C]NA[/C][/ROW]
[ROW][C]59[/C][C]NA[/C][C]NA[/C][C]NA[/C][/ROW]
[ROW][C]60[/C][C]NA[/C][C]NA[/C][C]NA[/C][/ROW]
[/TABLE]
Source: https://freestatistics.org/blog/index.php?pk=36260&T=1

Globally Unique Identifier (entire table): ba.freestatistics.org/blog/index.php?pk=36260&T=1

As an alternative you can also use a QR Code:  

The GUIDs for individual cells are displayed in the table below:

Autocorrelation Function
Time lag kACF(k)T-STATP-value
10.1734161.20150.117734
20.1136460.78740.217471
30.3376382.33920.011767
4-0.037148-0.25740.398998
50.12790.88610.189987
60.258461.79070.039827
7-0.112313-0.77810.220156
80.1964521.36110.089926
90.2231511.5460.064332
10-0.150604-1.04340.150992
110.0228310.15820.437491
12-0.16127-1.11730.134711
13-0.244235-1.69210.048554
140.1089320.75470.227057
15-0.094023-0.65140.258945
16-0.134039-0.92870.178858
170.2035741.41040.082435
18-0.209045-1.44830.077016
19-0.17308-1.19910.118181
20-0.038313-0.26540.395904
21-0.224526-1.55560.063191
22-0.127111-0.88060.191448
230.0284840.19730.422197
24-0.295514-2.04740.023058
25-0.127955-0.88650.189884
26-0.079941-0.55390.291126
27-0.222635-1.54250.064764
28-0.067416-0.46710.321282
29-0.12999-0.90060.18615
30-0.131311-0.90980.18375
31-0.000516-0.00360.49858
32-0.031866-0.22080.413101
33-0.041424-0.2870.387676
34-0.005687-0.03940.484368
35-0.041636-0.28850.387118
360.0407050.2820.389573
370.1085960.75240.227749
380.0496460.3440.366191
390.0360240.24960.401988
400.1016870.70450.24226
410.0298610.20690.418489
420.0782620.54220.295089
430.0402690.2790.390726
440.0114390.07920.468582
450.0512970.35540.361924
460.0243640.16880.433333
470.0149650.10370.458927
48NANANA
49NANANA
50NANANA
51NANANA
52NANANA
53NANANA
54NANANA
55NANANA
56NANANA
57NANANA
58NANANA
59NANANA
60NANANA


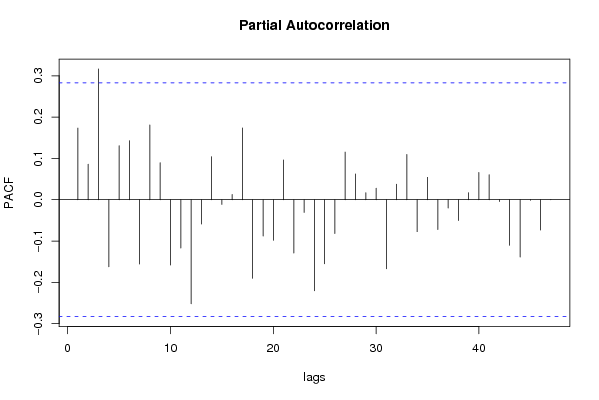
Partial Autocorrelation Function
Time lag kPACF(k)T-STATP-value
10.1734161.20150.117734
20.0861640.5970.276669
30.3164832.19270.016606
4-0.162095-1.1230.133506
50.1307310.90570.184802
60.1430350.9910.163333
7-0.155552-1.07770.143277
80.1807691.25240.108245
90.0896760.62130.268674
10-0.158151-1.09570.139338
11-0.117073-0.81110.210655
12-0.251947-1.74550.043645
13-0.05884-0.40770.342669
140.1041070.72130.23712
15-0.011241-0.07790.469124
160.0126490.08760.465267
170.1736651.20320.117403
18-0.189911-1.31570.097255
19-0.087649-0.60730.273273
20-0.09821-0.68040.249755
210.0964390.66820.253619
22-0.128811-0.89240.188308
23-0.030605-0.2120.416487
24-0.22009-1.52480.066933
25-0.154984-1.07380.14415
26-0.08181-0.56680.286747
270.1152190.79830.214326
280.0624630.43280.333566
290.0167730.11620.453987
300.0279970.1940.423509
31-0.166985-1.15690.126517
320.0375480.26010.397935
330.1095590.7590.225768
34-0.077248-0.53520.297495
350.0541710.37530.354543
36-0.072001-0.49880.310087
37-0.020041-0.13880.445075
38-0.05053-0.35010.363903
390.0169160.11720.453596
400.0660310.45750.324696
410.0605260.41930.338421
42-0.004491-0.03110.487653
43-0.110121-0.76290.224615
44-0.138577-0.96010.17091
45-0.001297-0.0090.496433
46-0.073492-0.50920.306485
47-0.000109-8e-040.499699
48NANANA
49NANANA
50NANANA
51NANANA
52NANANA
53NANANA
54NANANA
55NANANA
56NANANA
57NANANA
58NANANA
59NANANA
60NANANA

\begin{tabular}{lllllllll}
\hline
Partial Autocorrelation Function \tabularnewline
Time lag k & PACF(k) & T-STAT & P-value \tabularnewline
1 & 0.173416 & 1.2015 & 0.117734 \tabularnewline
2 & 0.086164 & 0.597 & 0.276669 \tabularnewline
3 & 0.316483 & 2.1927 & 0.016606 \tabularnewline
4 & -0.162095 & -1.123 & 0.133506 \tabularnewline
5 & 0.130731 & 0.9057 & 0.184802 \tabularnewline
6 & 0.143035 & 0.991 & 0.163333 \tabularnewline
7 & -0.155552 & -1.0777 & 0.143277 \tabularnewline
8 & 0.180769 & 1.2524 & 0.108245 \tabularnewline
9 & 0.089676 & 0.6213 & 0.268674 \tabularnewline
10 & -0.158151 & -1.0957 & 0.139338 \tabularnewline
11 & -0.117073 & -0.8111 & 0.210655 \tabularnewline
12 & -0.251947 & -1.7455 & 0.043645 \tabularnewline
13 & -0.05884 & -0.4077 & 0.342669 \tabularnewline
14 & 0.104107 & 0.7213 & 0.23712 \tabularnewline
15 & -0.011241 & -0.0779 & 0.469124 \tabularnewline
16 & 0.012649 & 0.0876 & 0.465267 \tabularnewline
17 & 0.173665 & 1.2032 & 0.117403 \tabularnewline
18 & -0.189911 & -1.3157 & 0.097255 \tabularnewline
19 & -0.087649 & -0.6073 & 0.273273 \tabularnewline
20 & -0.09821 & -0.6804 & 0.249755 \tabularnewline
21 & 0.096439 & 0.6682 & 0.253619 \tabularnewline
22 & -0.128811 & -0.8924 & 0.188308 \tabularnewline
23 & -0.030605 & -0.212 & 0.416487 \tabularnewline
24 & -0.22009 & -1.5248 & 0.066933 \tabularnewline
25 & -0.154984 & -1.0738 & 0.14415 \tabularnewline
26 & -0.08181 & -0.5668 & 0.286747 \tabularnewline
27 & 0.115219 & 0.7983 & 0.214326 \tabularnewline
28 & 0.062463 & 0.4328 & 0.333566 \tabularnewline
29 & 0.016773 & 0.1162 & 0.453987 \tabularnewline
30 & 0.027997 & 0.194 & 0.423509 \tabularnewline
31 & -0.166985 & -1.1569 & 0.126517 \tabularnewline
32 & 0.037548 & 0.2601 & 0.397935 \tabularnewline
33 & 0.109559 & 0.759 & 0.225768 \tabularnewline
34 & -0.077248 & -0.5352 & 0.297495 \tabularnewline
35 & 0.054171 & 0.3753 & 0.354543 \tabularnewline
36 & -0.072001 & -0.4988 & 0.310087 \tabularnewline
37 & -0.020041 & -0.1388 & 0.445075 \tabularnewline
38 & -0.05053 & -0.3501 & 0.363903 \tabularnewline
39 & 0.016916 & 0.1172 & 0.453596 \tabularnewline
40 & 0.066031 & 0.4575 & 0.324696 \tabularnewline
41 & 0.060526 & 0.4193 & 0.338421 \tabularnewline
42 & -0.004491 & -0.0311 & 0.487653 \tabularnewline
43 & -0.110121 & -0.7629 & 0.224615 \tabularnewline
44 & -0.138577 & -0.9601 & 0.17091 \tabularnewline
45 & -0.001297 & -0.009 & 0.496433 \tabularnewline
46 & -0.073492 & -0.5092 & 0.306485 \tabularnewline
47 & -0.000109 & -8e-04 & 0.499699 \tabularnewline
48 & NA & NA & NA \tabularnewline
49 & NA & NA & NA \tabularnewline
50 & NA & NA & NA \tabularnewline
51 & NA & NA & NA \tabularnewline
52 & NA & NA & NA \tabularnewline
53 & NA & NA & NA \tabularnewline
54 & NA & NA & NA \tabularnewline
55 & NA & NA & NA \tabularnewline
56 & NA & NA & NA \tabularnewline
57 & NA & NA & NA \tabularnewline
58 & NA & NA & NA \tabularnewline
59 & NA & NA & NA \tabularnewline
60 & NA & NA & NA \tabularnewline
\hline
\end{tabular}
%Source: https://freestatistics.org/blog/index.php?pk=36260&T=2

[TABLE]
[ROW][C]Partial Autocorrelation Function[/C][/ROW]
[ROW][C]Time lag k[/C][C]PACF(k)[/C][C]T-STAT[/C][C]P-value[/C][/ROW]
[ROW][C]1[/C][C]0.173416[/C][C]1.2015[/C][C]0.117734[/C][/ROW]
[ROW][C]2[/C][C]0.086164[/C][C]0.597[/C][C]0.276669[/C][/ROW]
[ROW][C]3[/C][C]0.316483[/C][C]2.1927[/C][C]0.016606[/C][/ROW]
[ROW][C]4[/C][C]-0.162095[/C][C]-1.123[/C][C]0.133506[/C][/ROW]
[ROW][C]5[/C][C]0.130731[/C][C]0.9057[/C][C]0.184802[/C][/ROW]
[ROW][C]6[/C][C]0.143035[/C][C]0.991[/C][C]0.163333[/C][/ROW]
[ROW][C]7[/C][C]-0.155552[/C][C]-1.0777[/C][C]0.143277[/C][/ROW]
[ROW][C]8[/C][C]0.180769[/C][C]1.2524[/C][C]0.108245[/C][/ROW]
[ROW][C]9[/C][C]0.089676[/C][C]0.6213[/C][C]0.268674[/C][/ROW]
[ROW][C]10[/C][C]-0.158151[/C][C]-1.0957[/C][C]0.139338[/C][/ROW]
[ROW][C]11[/C][C]-0.117073[/C][C]-0.8111[/C][C]0.210655[/C][/ROW]
[ROW][C]12[/C][C]-0.251947[/C][C]-1.7455[/C][C]0.043645[/C][/ROW]
[ROW][C]13[/C][C]-0.05884[/C][C]-0.4077[/C][C]0.342669[/C][/ROW]
[ROW][C]14[/C][C]0.104107[/C][C]0.7213[/C][C]0.23712[/C][/ROW]
[ROW][C]15[/C][C]-0.011241[/C][C]-0.0779[/C][C]0.469124[/C][/ROW]
[ROW][C]16[/C][C]0.012649[/C][C]0.0876[/C][C]0.465267[/C][/ROW]
[ROW][C]17[/C][C]0.173665[/C][C]1.2032[/C][C]0.117403[/C][/ROW]
[ROW][C]18[/C][C]-0.189911[/C][C]-1.3157[/C][C]0.097255[/C][/ROW]
[ROW][C]19[/C][C]-0.087649[/C][C]-0.6073[/C][C]0.273273[/C][/ROW]
[ROW][C]20[/C][C]-0.09821[/C][C]-0.6804[/C][C]0.249755[/C][/ROW]
[ROW][C]21[/C][C]0.096439[/C][C]0.6682[/C][C]0.253619[/C][/ROW]
[ROW][C]22[/C][C]-0.128811[/C][C]-0.8924[/C][C]0.188308[/C][/ROW]
[ROW][C]23[/C][C]-0.030605[/C][C]-0.212[/C][C]0.416487[/C][/ROW]
[ROW][C]24[/C][C]-0.22009[/C][C]-1.5248[/C][C]0.066933[/C][/ROW]
[ROW][C]25[/C][C]-0.154984[/C][C]-1.0738[/C][C]0.14415[/C][/ROW]
[ROW][C]26[/C][C]-0.08181[/C][C]-0.5668[/C][C]0.286747[/C][/ROW]
[ROW][C]27[/C][C]0.115219[/C][C]0.7983[/C][C]0.214326[/C][/ROW]
[ROW][C]28[/C][C]0.062463[/C][C]0.4328[/C][C]0.333566[/C][/ROW]
[ROW][C]29[/C][C]0.016773[/C][C]0.1162[/C][C]0.453987[/C][/ROW]
[ROW][C]30[/C][C]0.027997[/C][C]0.194[/C][C]0.423509[/C][/ROW]
[ROW][C]31[/C][C]-0.166985[/C][C]-1.1569[/C][C]0.126517[/C][/ROW]
[ROW][C]32[/C][C]0.037548[/C][C]0.2601[/C][C]0.397935[/C][/ROW]
[ROW][C]33[/C][C]0.109559[/C][C]0.759[/C][C]0.225768[/C][/ROW]
[ROW][C]34[/C][C]-0.077248[/C][C]-0.5352[/C][C]0.297495[/C][/ROW]
[ROW][C]35[/C][C]0.054171[/C][C]0.3753[/C][C]0.354543[/C][/ROW]
[ROW][C]36[/C][C]-0.072001[/C][C]-0.4988[/C][C]0.310087[/C][/ROW]
[ROW][C]37[/C][C]-0.020041[/C][C]-0.1388[/C][C]0.445075[/C][/ROW]
[ROW][C]38[/C][C]-0.05053[/C][C]-0.3501[/C][C]0.363903[/C][/ROW]
[ROW][C]39[/C][C]0.016916[/C][C]0.1172[/C][C]0.453596[/C][/ROW]
[ROW][C]40[/C][C]0.066031[/C][C]0.4575[/C][C]0.324696[/C][/ROW]
[ROW][C]41[/C][C]0.060526[/C][C]0.4193[/C][C]0.338421[/C][/ROW]
[ROW][C]42[/C][C]-0.004491[/C][C]-0.0311[/C][C]0.487653[/C][/ROW]
[ROW][C]43[/C][C]-0.110121[/C][C]-0.7629[/C][C]0.224615[/C][/ROW]
[ROW][C]44[/C][C]-0.138577[/C][C]-0.9601[/C][C]0.17091[/C][/ROW]
[ROW][C]45[/C][C]-0.001297[/C][C]-0.009[/C][C]0.496433[/C][/ROW]
[ROW][C]46[/C][C]-0.073492[/C][C]-0.5092[/C][C]0.306485[/C][/ROW]
[ROW][C]47[/C][C]-0.000109[/C][C]-8e-04[/C][C]0.499699[/C][/ROW]
[ROW][C]48[/C][C]NA[/C][C]NA[/C][C]NA[/C][/ROW]
[ROW][C]49[/C][C]NA[/C][C]NA[/C][C]NA[/C][/ROW]
[ROW][C]50[/C][C]NA[/C][C]NA[/C][C]NA[/C][/ROW]
[ROW][C]51[/C][C]NA[/C][C]NA[/C][C]NA[/C][/ROW]
[ROW][C]52[/C][C]NA[/C][C]NA[/C][C]NA[/C][/ROW]
[ROW][C]53[/C][C]NA[/C][C]NA[/C][C]NA[/C][/ROW]
[ROW][C]54[/C][C]NA[/C][C]NA[/C][C]NA[/C][/ROW]
[ROW][C]55[/C][C]NA[/C][C]NA[/C][C]NA[/C][/ROW]
[ROW][C]56[/C][C]NA[/C][C]NA[/C][C]NA[/C][/ROW]
[ROW][C]57[/C][C]NA[/C][C]NA[/C][C]NA[/C][/ROW]
[ROW][C]58[/C][C]NA[/C][C]NA[/C][C]NA[/C][/ROW]
[ROW][C]59[/C][C]NA[/C][C]NA[/C][C]NA[/C][/ROW]
[ROW][C]60[/C][C]NA[/C][C]NA[/C][C]NA[/C][/ROW]
[/TABLE]
Source: https://freestatistics.org/blog/index.php?pk=36260&T=2

Globally Unique Identifier (entire table): ba.freestatistics.org/blog/index.php?pk=36260&T=2

As an alternative you can also use a QR Code:  

The GUIDs for individual cells are displayed in the table below:

Partial Autocorrelation Function
Time lag kPACF(k)T-STATP-value
10.1734161.20150.117734
20.0861640.5970.276669
30.3164832.19270.016606
4-0.162095-1.1230.133506
50.1307310.90570.184802
60.1430350.9910.163333
7-0.155552-1.07770.143277
80.1807691.25240.108245
90.0896760.62130.268674
10-0.158151-1.09570.139338
11-0.117073-0.81110.210655
12-0.251947-1.74550.043645
13-0.05884-0.40770.342669
140.1041070.72130.23712
15-0.011241-0.07790.469124
160.0126490.08760.465267
170.1736651.20320.117403
18-0.189911-1.31570.097255
19-0.087649-0.60730.273273
20-0.09821-0.68040.249755
210.0964390.66820.253619
22-0.128811-0.89240.188308
23-0.030605-0.2120.416487
24-0.22009-1.52480.066933
25-0.154984-1.07380.14415
26-0.08181-0.56680.286747
270.1152190.79830.214326
280.0624630.43280.333566
290.0167730.11620.453987
300.0279970.1940.423509
31-0.166985-1.15690.126517
320.0375480.26010.397935
330.1095590.7590.225768
34-0.077248-0.53520.297495
350.0541710.37530.354543
36-0.072001-0.49880.310087
37-0.020041-0.13880.445075
38-0.05053-0.35010.363903
390.0169160.11720.453596
400.0660310.45750.324696
410.0605260.41930.338421
42-0.004491-0.03110.487653
43-0.110121-0.76290.224615
44-0.138577-0.96010.17091
45-0.001297-0.0090.496433
46-0.073492-0.50920.306485
47-0.000109-8e-040.499699
48NANANA
49NANANA
50NANANA
51NANANA
52NANANA
53NANANA
54NANANA
55NANANA
56NANANA
57NANANA
58NANANA
59NANANA
60NANANA


Parameters (Session):
par1 = 60 ; par2 = 1 ; par3 = 0 ; par4 = 1 ; par5 = 12 ;
Parameters (R input):
par1 = 60 ; par2 = 1 ; par3 = 0 ; par4 = 1 ; par5 = 12 ;
R code (references can be found in the software module):
if (par1 == 'Default') {
par1 = 10*log10(length(x))
} else {
par1 <- as.numeric(par1)
}
par2 <- as.numeric(par2)
par3 <- as.numeric(par3)
par4 <- as.numeric(par4)
par5 <- as.numeric(par5)
if (par2 == 0) {
x <- log(x)
} else {
x <- (x ^ par2 - 1) / par2
}
if (par3 > 0) x <- diff(x,lag=1,difference=par3)
if (par4 > 0) x <- diff(x,lag=par5,difference=par4)
bitmap(file='pic1.png')
racf <- acf(x,par1,main='Autocorrelation',xlab='lags',ylab='ACF')
dev.off()
bitmap(file='pic2.png')
rpacf <- pacf(x,par1,main='Partial Autocorrelation',xlab='lags',ylab='PACF')
dev.off()
(myacf <- c(racf$acf))
(mypacf <- c(rpacf$acf))
lengthx <- length(x)
sqrtn <- sqrt(lengthx)
load(file='createtable')
a<-table.start()
a<-table.row.start(a)
a<-table.element(a,'Autocorrelation Function',4,TRUE)
a<-table.row.end(a)
a<-table.row.start(a)
a<-table.element(a,'Time lag k',header=TRUE)
a<-table.element(a,hyperlink('basics.htm','ACF(k)','click here for more information about the Autocorrelation Function'),header=TRUE)
a<-table.element(a,'T-STAT',header=TRUE)
a<-table.element(a,'P-value',header=TRUE)
a<-table.row.end(a)
for (i in 2:(par1+1)) {
a<-table.row.start(a)
a<-table.element(a,i-1,header=TRUE)
a<-table.element(a,round(myacf[i],6))
mytstat <- myacf[i]*sqrtn
a<-table.element(a,round(mytstat,4))
a<-table.element(a,round(1-pt(abs(mytstat),lengthx),6))
a<-table.row.end(a)
}
a<-table.end(a)
table.save(a,file='mytable.tab')
a<-table.start()
a<-table.row.start(a)
a<-table.element(a,'Partial Autocorrelation Function',4,TRUE)
a<-table.row.end(a)
a<-table.row.start(a)
a<-table.element(a,'Time lag k',header=TRUE)
a<-table.element(a,hyperlink('basics.htm','PACF(k)','click here for more information about the Partial Autocorrelation Function'),header=TRUE)
a<-table.element(a,'T-STAT',header=TRUE)
a<-table.element(a,'P-value',header=TRUE)
a<-table.row.end(a)
for (i in 1:par1) {
a<-table.row.start(a)
a<-table.element(a,i,header=TRUE)
a<-table.element(a,round(mypacf[i],6))
mytstat <- mypacf[i]*sqrtn
a<-table.element(a,round(mytstat,4))
a<-table.element(a,round(1-pt(abs(mytstat),lengthx),6))
a<-table.row.end(a)
}
a<-table.end(a)
table.save(a,file='mytable1.tab')