Free Statistics
of Irreproducible Research!
Description of Statistical Computation | |||||||||||||||||||||||||||||||||||||||||
|---|---|---|---|---|---|---|---|---|---|---|---|---|---|---|---|---|---|---|---|---|---|---|---|---|---|---|---|---|---|---|---|---|---|---|---|---|---|---|---|---|---|
| Author's title | |||||||||||||||||||||||||||||||||||||||||
| Author | *Unverified author* | ||||||||||||||||||||||||||||||||||||||||
| R Software Module | rwasp_univariatedataseries.wasp | ||||||||||||||||||||||||||||||||||||||||
| Title produced by software | Univariate Data Series | ||||||||||||||||||||||||||||||||||||||||
| Date of computation | Fri, 15 Feb 2008 03:27:14 -0700 | ||||||||||||||||||||||||||||||||||||||||
| Cite this page as follows | Statistical Computations at FreeStatistics.org, Office for Research Development and Education, URL https://freestatistics.org/blog/index.php?v=date/2008/Feb/15/t1203071615cc649izltrlgzv2.htm/, Retrieved Wed, 15 May 2024 17:04:00 +0000 | ||||||||||||||||||||||||||||||||||||||||
| Statistical Computations at FreeStatistics.org, Office for Research Development and Education, URL https://freestatistics.org/blog/index.php?pk=8211, Retrieved Wed, 15 May 2024 17:04:00 +0000 | |||||||||||||||||||||||||||||||||||||||||
| QR Codes: | |||||||||||||||||||||||||||||||||||||||||
|
| |||||||||||||||||||||||||||||||||||||||||
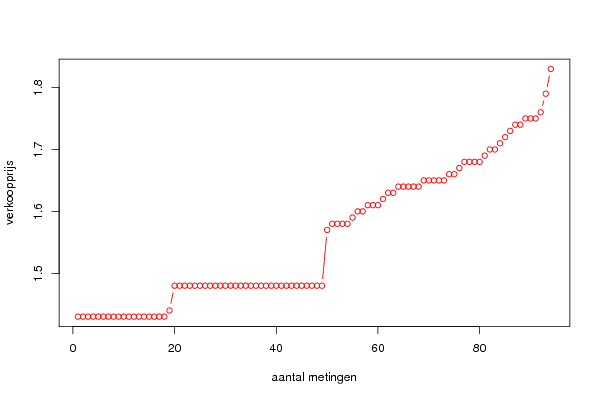
| Original text written by user: | We zien de eerste jaren een geleidelijke stijging van de verkoopprijs, maar de laatste drie jaar wordt de prijs bijna elke meting aangepast en verhoogt de prijs zeer snel. Dit gebeurt omdat de laatste jaren de grondstofprijzen voor het maken van brood ook zeer sterk gestegen zijn. | ||||||||||||||||||||||||||||||||||||||||
| IsPrivate? | No (this computation is public) | ||||||||||||||||||||||||||||||||||||||||
| User-defined keywords | verkoopprijs, brood, verloop | ||||||||||||||||||||||||||||||||||||||||
| Estimated Impact | 267 | ||||||||||||||||||||||||||||||||||||||||
Tree of Dependent Computations | |||||||||||||||||||||||||||||||||||||||||
| Family? (F = Feedback message, R = changed R code, M = changed R Module, P = changed Parameters, D = changed Data) | |||||||||||||||||||||||||||||||||||||||||
| - [Univariate Data Series] [verloop van verko...] [2008-02-15 10:27:14] [3244ffc2cb3525df557e4a14321135d8] [Current] | |||||||||||||||||||||||||||||||||||||||||
| Feedback Forum | |||||||||||||||||||||||||||||||||||||||||
Post a new message | |||||||||||||||||||||||||||||||||||||||||
Dataset | |||||||||||||||||||||||||||||||||||||||||
| Dataseries X: | |||||||||||||||||||||||||||||||||||||||||
1.43 1.43 1.43 1.43 1.43 1.43 1.43 1.43 1.43 1.43 1.43 1.43 1.43 1.43 1.43 1.43 1.43 1.43 1.44 1.48 1.48 1.48 1.48 1.48 1.48 1.48 1.48 1.48 1.48 1.48 1.48 1.48 1.48 1.48 1.48 1.48 1.48 1.48 1.48 1.48 1.48 1.48 1.48 1.48 1.48 1.48 1.48 1.48 1.48 1.57 1.58 1.58 1.58 1.58 1.59 1.6 1.6 1.61 1.61 1.61 1.62 1.63 1.63 1.64 1.64 1.64 1.64 1.64 1.65 1.65 1.65 1.65 1.65 1.66 1.66 1.67 1.68 1.68 1.68 1.68 1.69 1.7 1.7 1.71 1.72 1.73 1.74 1.74 1.75 1.75 1.75 1.76 1.79 1.83 | |||||||||||||||||||||||||||||||||||||||||
Tables (Output of Computation) | |||||||||||||||||||||||||||||||||||||||||
| |||||||||||||||||||||||||||||||||||||||||
Figures (Output of Computation) | |||||||||||||||||||||||||||||||||||||||||
Input Parameters & R Code | |||||||||||||||||||||||||||||||||||||||||
| Parameters (Session): | |||||||||||||||||||||||||||||||||||||||||
| par1 = Verkoopprijs van brood ; par2 = http://www.belgostat.be ; par3 = Verkoopprijs van een (bruin) brood tussen januari 2000 en oktober 2007 ; | |||||||||||||||||||||||||||||||||||||||||
| Parameters (R input): | |||||||||||||||||||||||||||||||||||||||||
| par1 = ; par2 = ; par3 = ; | |||||||||||||||||||||||||||||||||||||||||
| R code (references can be found in the software module): | |||||||||||||||||||||||||||||||||||||||||
bitmap(file='test1.png') | |||||||||||||||||||||||||||||||||||||||||