Free Statistics
of Irreproducible Research!
Description of Statistical Computation | |||||||||||||||||||||||||||||||||||||||||
|---|---|---|---|---|---|---|---|---|---|---|---|---|---|---|---|---|---|---|---|---|---|---|---|---|---|---|---|---|---|---|---|---|---|---|---|---|---|---|---|---|---|
| Author's title | |||||||||||||||||||||||||||||||||||||||||
| Author | *Unverified author* | ||||||||||||||||||||||||||||||||||||||||
| R Software Module | rwasp_univariatedataseries.wasp | ||||||||||||||||||||||||||||||||||||||||
| Title produced by software | Univariate Data Series | ||||||||||||||||||||||||||||||||||||||||
| Date of computation | Fri, 15 Feb 2008 06:38:30 -0700 | ||||||||||||||||||||||||||||||||||||||||
| Cite this page as follows | Statistical Computations at FreeStatistics.org, Office for Research Development and Education, URL https://freestatistics.org/blog/index.php?v=date/2008/Feb/15/t1203083367vdp28miut9wizx8.htm/, Retrieved Wed, 15 May 2024 14:43:25 +0000 | ||||||||||||||||||||||||||||||||||||||||
| Statistical Computations at FreeStatistics.org, Office for Research Development and Education, URL https://freestatistics.org/blog/index.php?pk=8221, Retrieved Wed, 15 May 2024 14:43:25 +0000 | |||||||||||||||||||||||||||||||||||||||||
| QR Codes: | |||||||||||||||||||||||||||||||||||||||||
|
| |||||||||||||||||||||||||||||||||||||||||
| Original text written by user: | Bron: Belgostat | ||||||||||||||||||||||||||||||||||||||||
| IsPrivate? | No (this computation is public) | ||||||||||||||||||||||||||||||||||||||||
| User-defined keywords | Periode: januari 2001 - oktober 2007 | ||||||||||||||||||||||||||||||||||||||||
| Estimated Impact | 298 | ||||||||||||||||||||||||||||||||||||||||
Tree of Dependent Computations | |||||||||||||||||||||||||||||||||||||||||
| Family? (F = Feedback message, R = changed R code, M = changed R Module, P = changed Parameters, D = changed Data) | |||||||||||||||||||||||||||||||||||||||||
| - [Univariate Data Series] [Prijsevolutie bro...] [2008-02-15 13:38:30] [f4f7490cd61f26de3cba7cf1cf8e38c9] [Current] | |||||||||||||||||||||||||||||||||||||||||
| Feedback Forum | |||||||||||||||||||||||||||||||||||||||||
Post a new message | |||||||||||||||||||||||||||||||||||||||||
Dataset | |||||||||||||||||||||||||||||||||||||||||
| Dataseries X: | |||||||||||||||||||||||||||||||||||||||||
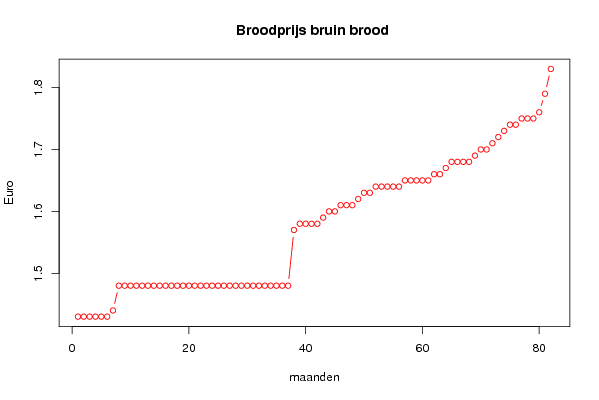
1.43 1.43 1.43 1.43 1.43 1.43 1.44 1.48 1.48 1.48 1.48 1.48 1.48 1.48 1.48 1.48 1.48 1.48 1.48 1.48 1.48 1.48 1.48 1.48 1.48 1.48 1.48 1.48 1.48 1.48 1.48 1.48 1.48 1.48 1.48 1.48 1.48 1.57 1.58 1.58 1.58 1.58 1.59 1.6 1.6 1.61 1.61 1.61 1.62 1.63 1.63 1.64 1.64 1.64 1.64 1.64 1.65 1.65 1.65 1.65 1.65 1.66 1.66 1.67 1.68 1.68 1.68 1.68 1.69 1.7 1.7 1.71 1.72 1.73 1.74 1.74 1.75 1.75 1.75 1.76 1.79 1.83 | |||||||||||||||||||||||||||||||||||||||||
Tables (Output of Computation) | |||||||||||||||||||||||||||||||||||||||||
| |||||||||||||||||||||||||||||||||||||||||
Figures (Output of Computation) | |||||||||||||||||||||||||||||||||||||||||
Input Parameters & R Code | |||||||||||||||||||||||||||||||||||||||||
| Parameters (Session): | |||||||||||||||||||||||||||||||||||||||||
| par1 = Broodprijs bruin brood ; par2 = Belgostat ; | |||||||||||||||||||||||||||||||||||||||||
| Parameters (R input): | |||||||||||||||||||||||||||||||||||||||||
| par1 = Broodprijs bruin brood ; par2 = Belgostat ; par3 = ; | |||||||||||||||||||||||||||||||||||||||||
| R code (references can be found in the software module): | |||||||||||||||||||||||||||||||||||||||||
bitmap(file='test1.png') | |||||||||||||||||||||||||||||||||||||||||