Free Statistics

of Irreproducible Research!

Author's title

Author*The author of this computation has been verified*
R Software Modulerwasp_meanplot.wasp
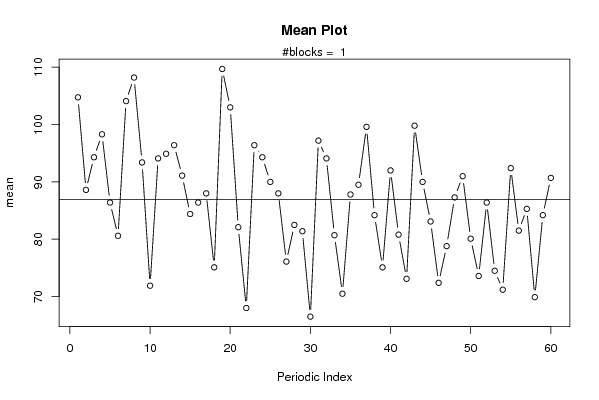
Title produced by softwareMean Plot
Date of computationSun, 02 Nov 2008 06:40:23 -0700
Cite this page as followsStatistical Computations at FreeStatistics.org, Office for Research Development and Education, URL https://freestatistics.org/blog/index.php?v=date/2008/Nov/02/t1225633276rbk2nmmfbbhuguh.htm/, Retrieved Mon, 27 May 2024 11:16:22 +0000
Statistical Computations at FreeStatistics.org, Office for Research Development and Education, URL https://freestatistics.org/blog/index.php?pk=20557, Retrieved Mon, 27 May 2024 11:16:22 +0000
QR Codes:

Original text written by user:
IsPrivate?No (this computation is public)
User-defined keywords
Estimated Impact196
Family? (F = Feedback message, R = changed R code, M = changed R Module, P = changed Parameters, D = changed Data)
F     [Mean Plot] [workshop 3] [2007-10-26 12:14:28] [e9ffc5de6f8a7be62f22b142b5b6b1a8]
F    D  [Mean Plot] [Hypothesis Testin...] [2008-10-30 12:52:34] [38f43994ada0e6172896e12525dcc585]
F   P     [Mean Plot] [Hypothesis Testin...] [2008-10-30 13:25:08] [38f43994ada0e6172896e12525dcc585]
F    D        [Mean Plot] [Hypothesis Testin...] [2008-11-02 13:40:23] [382e90e66f02be5ed86892bdc1574692] [Current]
Feedback Forum
2008-11-10 09:40:59 [Steffi Van Isveldt] [reply
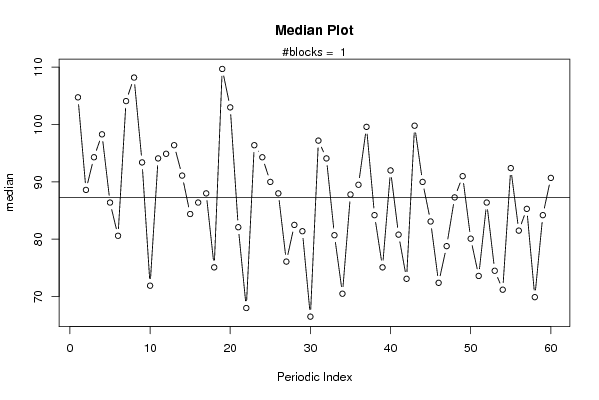
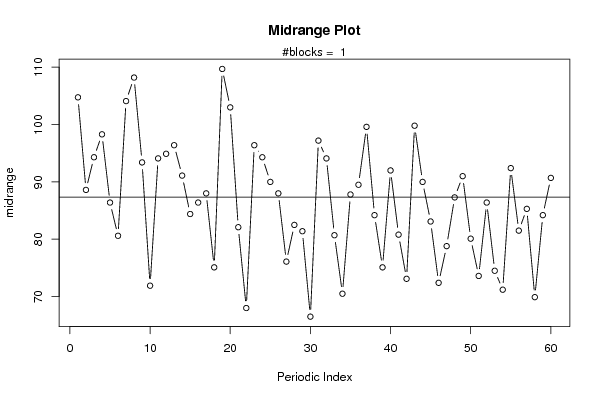
Correcte interpretatie van de gemaakte grafiek. Het is inderdaad belangrijk om de blockwidth op 60 zet zodat je een goede analyse kan maken.

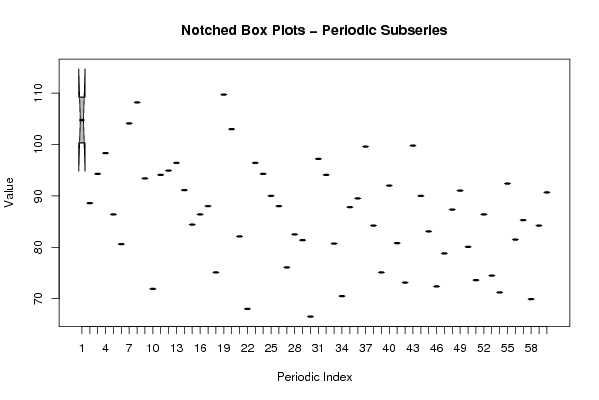
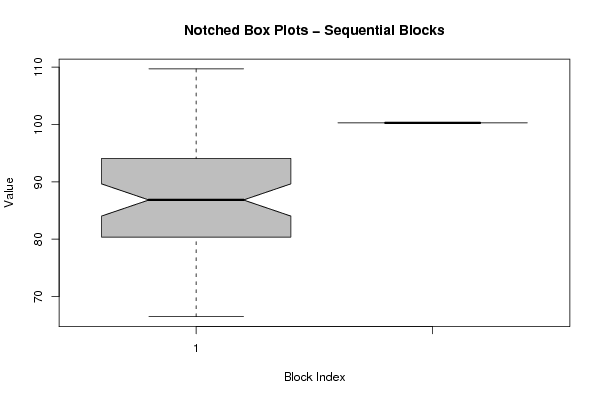
Ik heb voor deze berekening gebruik gemaakt van de notched box plots - sequential blocks omdat ik deze ook gemakkelijk te analyseren vind. Je kan hier ook een duidelijke daling van de productie merken.
http://www.freestatistics.org/blog/index.php?v=date/2008/Nov/03/t1225738203bdele41lo4ucqkt.htm/
2008-11-10 14:29:29 [Michael Van Spaandonck] [reply
We zien inderdaad een dalende trend doorheen de jaren, wat dat betreft kan ik niets toevoegen.

De studente heeft ervoor gekozen de blockwidth op 60 te zetten om zo de eerste 3 grafieken meer gedetaileerd te kunnen bespreken en zo de vraagstelling op te lossen.
Op zich kan dit absoluut geen kwaad, maar hiermee heeft ze wel 2 berekeningen gemaakt voor vragen 2 en 3, terwijl de grafiek 'notched box plots- sequential blocks' uit de berekening voor Q2, waar de blockwidth ingesteld was op 12, op zich ook ruim had kunnen volstaan.
Dit is echter geen verkeerde oplossing en bovendien laat deze toe in grotere mate in detail te treden.
2008-11-11 09:35:23 [Tim Damen] [reply
Zoals in een vorig bericht is opgemerkt is een blockwidth van 60 inderdaad ruim maar hoe groter de blockwidth, hoe duidelijker je de dalende trend kan opmerken aan de hand van de mean plot
2008-11-11 17:54:22 [Evelien Blockx] [reply
Analyseren met notched box-plots

Ik kan op deze manier 5 jaren vergelijken. Het 6de jaar heeft immers te weinig observaties om te kunnen vergelijken.
Ook hier moet ik weer kijken of de daling significant is. Voor de eerste 4 jaar is de daling over de jaren heen niet significant, want de betrouwbaarheidsintervallen overlappen elkaar. Je kan dus spreken van toeval.

Als je jaar 1 zou vergelijken met jaar 5 kan je nog net spreken van een significante daling. Hun betrouwbaarheidsintervallen overlappen net niet meer.

Post a new message
Dataseries X:
109.20
88.60
94.30
98.30
86.40
80.60
104.10
108.20
93.40
71.90
94.10
94.90
96.40
91.10
84.40
86.40
88.00
75.10
109.70
103.00
82.10
68.00
96.40
94.30
90.00
88.00
76.10
82.50
81.40
66.50
97.20
94.10
80.70
70.50
87.80
89.50
99.60
84.20
75.10
92.00
80.80
73.10
99.80
90.00
83.10
72.40
78.80
87.30
91.00
80.10
73.60
86.40
74.50
71.20
92.40
81.50
85.30
69.90
84.20
90.70
100.30


Summary of computational transaction
Raw Inputview raw input (R code)
Raw Outputview raw output of R engine
Computing time3 seconds
R Server'Gwilym Jenkins' @ 72.249.127.135

\begin{tabular}{lllllllll}
\hline
Summary of computational transaction \tabularnewline
Raw Input & view raw input (R code)  \tabularnewline
Raw Output & view raw output of R engine  \tabularnewline
Computing time & 3 seconds \tabularnewline
R Server & 'Gwilym Jenkins' @ 72.249.127.135 \tabularnewline
\hline
\end{tabular}
%Source: https://freestatistics.org/blog/index.php?pk=20557&T=0

[TABLE]
[ROW][C]Summary of computational transaction[/C][/ROW]
[ROW][C]Raw Input[/C][C]view raw input (R code) [/C][/ROW]
[ROW][C]Raw Output[/C][C]view raw output of R engine [/C][/ROW]
[ROW][C]Computing time[/C][C]3 seconds[/C][/ROW]
[ROW][C]R Server[/C][C]'Gwilym Jenkins' @ 72.249.127.135[/C][/ROW]
[/TABLE]
Source: https://freestatistics.org/blog/index.php?pk=20557&T=0

Globally Unique Identifier (entire table): ba.freestatistics.org/blog/index.php?pk=20557&T=0

As an alternative you can also use a QR Code:  

The GUIDs for individual cells are displayed in the table below:

Summary of computational transaction
Raw Inputview raw input (R code)
Raw Outputview raw output of R engine
Computing time3 seconds
R Server'Gwilym Jenkins' @ 72.249.127.135


Parameters (Session):
par1 = 60 ;
Parameters (R input):
par1 = 60 ;
R code (references can be found in the software module):
par1 <- as.numeric(par1)
(n <- length(x))
(np <- floor(n / par1))
arr <- array(NA,dim=c(par1,np+1))
ari <- array(0,dim=par1)
j <- 0
for (i in 1:n)
{
j = j + 1
ari[j] = ari[j] + 1
arr[j,ari[j]] <- x[i]
if (j == par1) j = 0
}
ari
arr
arr.mean <- array(NA,dim=par1)
arr.median <- array(NA,dim=par1)
arr.midrange <- array(NA,dim=par1)
for (j in 1:par1)
{
arr.mean[j] <- mean(arr[j,],na.rm=TRUE)
arr.median[j] <- median(arr[j,],na.rm=TRUE)
arr.midrange[j] <- (quantile(arr[j,],0.75,na.rm=TRUE) + quantile(arr[j,],0.25,na.rm=TRUE)) / 2
}
overall.mean <- mean(x)
overall.median <- median(x)
overall.midrange <- (quantile(x,0.75) + quantile(x,0.25)) / 2
bitmap(file='plot1.png')
plot(arr.mean,type='b',ylab='mean',main='Mean Plot',xlab='Periodic Index')
mtext(paste('#blocks = ',np))
abline(overall.mean,0)
dev.off()
bitmap(file='plot2.png')
plot(arr.median,type='b',ylab='median',main='Median Plot',xlab='Periodic Index')
mtext(paste('#blocks = ',np))
abline(overall.median,0)
dev.off()
bitmap(file='plot3.png')
plot(arr.midrange,type='b',ylab='midrange',main='Midrange Plot',xlab='Periodic Index')
mtext(paste('#blocks = ',np))
abline(overall.midrange,0)
dev.off()
bitmap(file='plot4.png')
z <- data.frame(t(arr))
names(z) <- c(1:par1)
(boxplot(z,notch=TRUE,col='grey',xlab='Periodic Index',ylab='Value',main='Notched Box Plots - Periodic Subseries'))
dev.off()
bitmap(file='plot5.png')
z <- data.frame(arr)
names(z) <- c(1:np)
(boxplot(z,notch=TRUE,col='grey',xlab='Block Index',ylab='Value',main='Notched Box Plots - Sequential Blocks'))
dev.off()
bitmap(file='plot6.png')
z <- data.frame(cbind(arr.mean,arr.median,arr.midrange))
names(z) <- list('mean','median','midrange')
(boxplot(z,notch=TRUE,col='grey',ylab='Overall Central Tendency',main='Notched Box Plots'))
dev.off()