Free Statistics

of Irreproducible Research!

Author's title

Author*The author of this computation has been verified*
R Software Modulerwasp_meanplot.wasp
Title produced by softwareMean Plot
Date of computationTue, 04 Nov 2008 07:47:28 -0700
Cite this page as followsStatistical Computations at FreeStatistics.org, Office for Research Development and Education, URL https://freestatistics.org/blog/index.php?v=date/2008/Nov/04/t1225810221ukfha6ziup1heey.htm/, Retrieved Sun, 19 May 2024 03:02:33 +0000
Statistical Computations at FreeStatistics.org, Office for Research Development and Education, URL https://freestatistics.org/blog/index.php?pk=21571, Retrieved Sun, 19 May 2024 03:02:33 +0000
QR Codes:

Original text written by user:
IsPrivate?No (this computation is public)
User-defined keywordsMean plot
Estimated Impact165
Family? (F = Feedback message, R = changed R code, M = changed R Module, P = changed Parameters, D = changed Data)
F     [Mean Plot] [workshop 3] [2007-10-26 12:14:28] [e9ffc5de6f8a7be62f22b142b5b6b1a8]
F    D    [Mean Plot] [Mean Plot] [2008-11-04 14:47:28] [3bdbbe597ac6c61989658933956ee6ac] [Current]
Feedback Forum
2008-11-09 19:24:29 [006ad2c49b6a7c2ad6ab685cfc1dae56] [reply
Goed opgelost.
2008-11-10 18:39:58 [Loïque Verhasselt] [reply
Correct opgelost. Mean plot is de beste methode om seizoenaliteit aan te geven met behulp van tijdseries.
2008-11-11 22:05:05 [f4fb14dccb656c9eb858fa18c7d28649] [reply
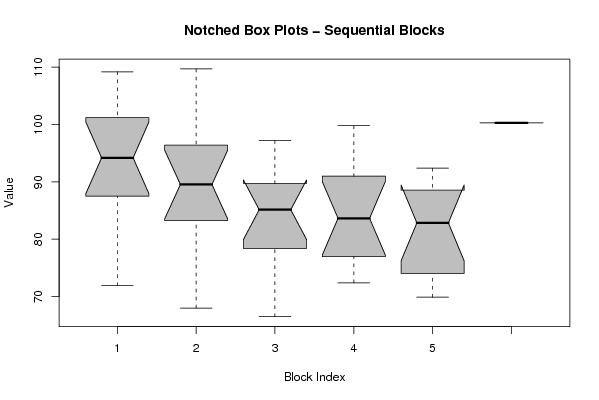
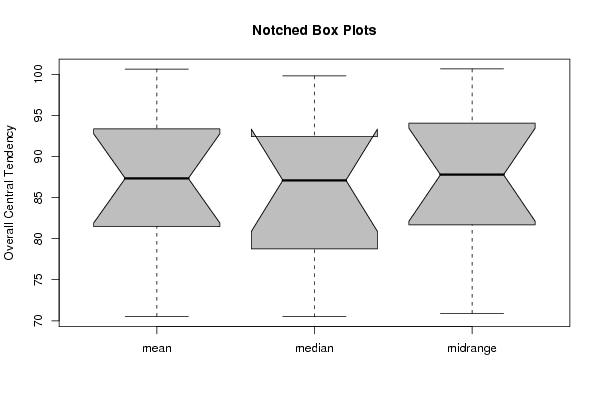
Goede methode gebruikt en goede conclusies. Bij de grafiek met de 'Notched box plots', valt nog op te merken dat het in (bijna)elke maand om 'significante' verschillen gaat.
2008-11-12 09:42:22 [76d4ba45ca37c54e4ca3ca97939a2cd4] [reply
Q2: Je spreekt enkel over de piek in maand 7, maar je vermeldt er niet eens bij over welke maand het in werkelijkheid gaat. Je kon er beter bij zeggen dat het over september gaat. Dit is de maand waarin de herfst begint. En ook in de maanden maart en juni zijn er sterke stijgingen merkbaar op de grafiek. Dit zijn eveneens de beginmaanden van een nieuw seizoen. Dit heb je er niet bij vermeld. Met andere woorden, de wijze waarop jij de situatie uitlegt, wijst op een mogelijke maar onzekere seizoenaliteit, terwijl deze in feite zeer duidelijk merkbaar is. Je besluit om met een notched boxplot te werken was goed. Maar ook hier is je uitleg onvolledig. Wederom ben je vergeten de uitleg van de student te bekritiseren.
2008-11-12 09:47:42 [Maarten Van Gucht] [reply
Q2: student heeft het goed beschreven, heeft inderdaad met periodieke analyse gewerkt. Deze heeft betrekking op seizoenaliteit. In de tweede grafiek worden de gemiddelden van iedere maand apart verrekend. De notches wijken serieus uit, dus er is sprake van seizoenaliteit. De inkepingen zijn zeer groot dus er is sprake van een hoge betrouwbaarheid.

Post a new message
Dataseries X:
109.20
88.60
94.30
98.30
86.40
80.60
104.10
108.20
93.40
71.90
94.10
94.90
96.40
91.10
84.40
86.40
88.00
75.10
109.70
103.00
82.10
68.00
96.40
94.30
90.00
88.00
76.10
82.50
81.40
66.50
97.20
94.10
80.70
70.50
87.80
89.50
99.60
84.20
75.10
92.00
80.80
73.10
99.80
90.00
83.10
72.40
78.80
87.30
91.00
80.10
73.60
86.40
74.50
71.20
92.40
81.50
85.30
69.90
84.20
90.70
100.30


Summary of computational transaction
Raw Inputview raw input (R code)
Raw Outputview raw output of R engine
Computing time2 seconds
R Server'George Udny Yule' @ 72.249.76.132

\begin{tabular}{lllllllll}
\hline
Summary of computational transaction \tabularnewline
Raw Input & view raw input (R code)  \tabularnewline
Raw Output & view raw output of R engine  \tabularnewline
Computing time & 2 seconds \tabularnewline
R Server & 'George Udny Yule' @ 72.249.76.132 \tabularnewline
\hline
\end{tabular}
%Source: https://freestatistics.org/blog/index.php?pk=21571&T=0

[TABLE]
[ROW][C]Summary of computational transaction[/C][/ROW]
[ROW][C]Raw Input[/C][C]view raw input (R code) [/C][/ROW]
[ROW][C]Raw Output[/C][C]view raw output of R engine [/C][/ROW]
[ROW][C]Computing time[/C][C]2 seconds[/C][/ROW]
[ROW][C]R Server[/C][C]'George Udny Yule' @ 72.249.76.132[/C][/ROW]
[/TABLE]
Source: https://freestatistics.org/blog/index.php?pk=21571&T=0

Globally Unique Identifier (entire table): ba.freestatistics.org/blog/index.php?pk=21571&T=0

As an alternative you can also use a QR Code:  

The GUIDs for individual cells are displayed in the table below:

Summary of computational transaction
Raw Inputview raw input (R code)
Raw Outputview raw output of R engine
Computing time2 seconds
R Server'George Udny Yule' @ 72.249.76.132


Parameters (Session):
par1 = 12 ;
Parameters (R input):
par1 = 12 ;
R code (references can be found in the software module):
par1 <- as.numeric(par1)
(n <- length(x))
(np <- floor(n / par1))
arr <- array(NA,dim=c(par1,np+1))
ari <- array(0,dim=par1)
j <- 0
for (i in 1:n)
{
j = j + 1
ari[j] = ari[j] + 1
arr[j,ari[j]] <- x[i]
if (j == par1) j = 0
}
ari
arr
arr.mean <- array(NA,dim=par1)
arr.median <- array(NA,dim=par1)
arr.midrange <- array(NA,dim=par1)
for (j in 1:par1)
{
arr.mean[j] <- mean(arr[j,],na.rm=TRUE)
arr.median[j] <- median(arr[j,],na.rm=TRUE)
arr.midrange[j] <- (quantile(arr[j,],0.75,na.rm=TRUE) + quantile(arr[j,],0.25,na.rm=TRUE)) / 2
}
overall.mean <- mean(x)
overall.median <- median(x)
overall.midrange <- (quantile(x,0.75) + quantile(x,0.25)) / 2
bitmap(file='plot1.png')
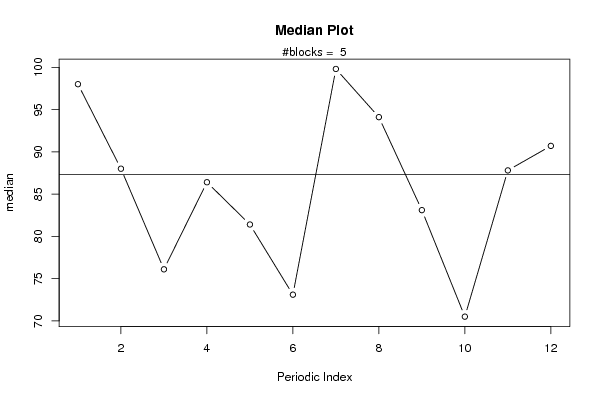
plot(arr.mean,type='b',ylab='mean',main='Mean Plot',xlab='Periodic Index')
mtext(paste('#blocks = ',np))
abline(overall.mean,0)
dev.off()
bitmap(file='plot2.png')
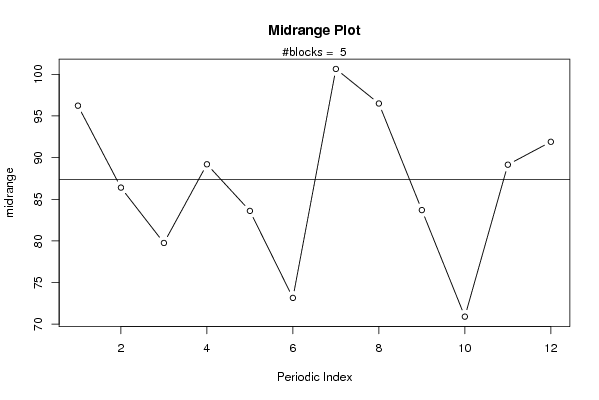
plot(arr.median,type='b',ylab='median',main='Median Plot',xlab='Periodic Index')
mtext(paste('#blocks = ',np))
abline(overall.median,0)
dev.off()
bitmap(file='plot3.png')
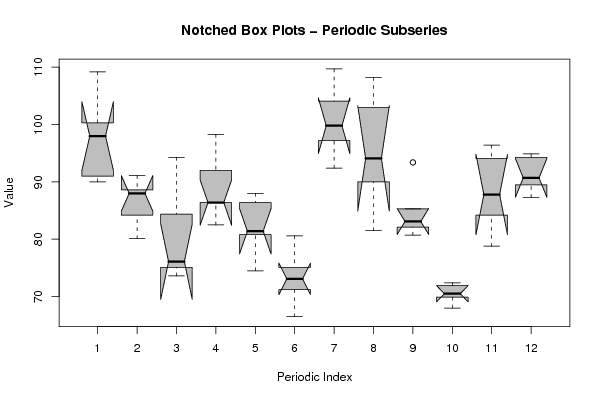
plot(arr.midrange,type='b',ylab='midrange',main='Midrange Plot',xlab='Periodic Index')
mtext(paste('#blocks = ',np))
abline(overall.midrange,0)
dev.off()
bitmap(file='plot4.png')
z <- data.frame(t(arr))
names(z) <- c(1:par1)
(boxplot(z,notch=TRUE,col='grey',xlab='Periodic Index',ylab='Value',main='Notched Box Plots - Periodic Subseries'))
dev.off()
bitmap(file='plot5.png')
z <- data.frame(arr)
names(z) <- c(1:np)
(boxplot(z,notch=TRUE,col='grey',xlab='Block Index',ylab='Value',main='Notched Box Plots - Sequential Blocks'))
dev.off()
bitmap(file='plot6.png')
z <- data.frame(cbind(arr.mean,arr.median,arr.midrange))
names(z) <- list('mean','median','midrange')
(boxplot(z,notch=TRUE,col='grey',ylab='Overall Central Tendency',main='Notched Box Plots'))
dev.off()