Free Statistics

of Irreproducible Research!

Author's title

Author*The author of this computation has been verified*
R Software Modulerwasp_bidensity.wasp
Title produced by softwareBivariate Kernel Density Estimation
Date of computationSun, 09 Nov 2008 10:40:29 -0700
Cite this page as followsStatistical Computations at FreeStatistics.org, Office for Research Development and Education, URL https://freestatistics.org/blog/index.php?v=date/2008/Nov/09/t1226252454gmx0ubsw5xdivmy.htm/, Retrieved Sun, 19 May 2024 02:48:09 +0000
Statistical Computations at FreeStatistics.org, Office for Research Development and Education, URL https://freestatistics.org/blog/index.php?pk=22793, Retrieved Sun, 19 May 2024 02:48:09 +0000
QR Codes:

Original text written by user:
IsPrivate?No (this computation is public)
User-defined keywords
Estimated Impact181
Family? (F = Feedback message, R = changed R code, M = changed R Module, P = changed Parameters, D = changed Data)
F       [Bivariate Kernel Density Estimation] [invoer - werkloos...] [2008-11-09 17:40:29] [54ae75b68e6a45c6d55fa4235827d5b3] [Current]
Feedback Forum
2008-11-15 10:52:03 [Tom Ardies] [reply
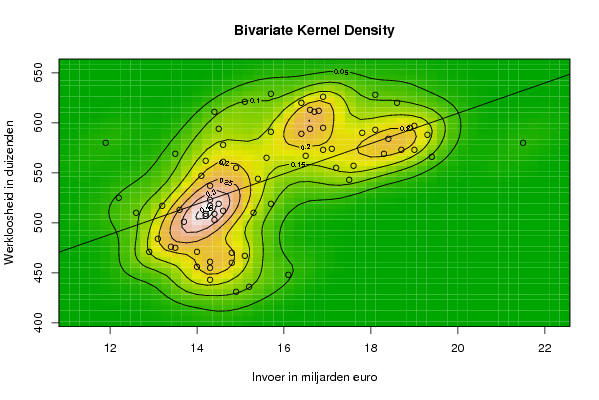
Er is een grote bundel van punten links onder in de grafiek en twee kleinere iets hoger. Een van die kleiner bundels die boven de rechte licht kan eventueel wijzen op seizonaliteit. Er zitten ongeveer zes punten dit kunnen dus vijf dezelfde maanden zijn en één uitzondering. Een analyse van deze punten zou dit kunnen verklaren
2008-11-22 09:58:59 [Astrid Sniekers] [reply
Invoer – werkloosheid

De correlatie is 0.547538942847347. Er is een miniem positief verband tussen de twee datasets.
2008-11-23 16:05:50 [6af4ee214cbc060e38f4dce8356a5567] [reply
Als je kijkt naar de grafiek dan zie je dat niet alle punten dicht in de buurt van de rechte liggen. Zo zie je dat er links onderaan een groot deel punten tamelijk ver van de rechte ligt, en dat er ook 2 kleinere groepen rechts boven tamelijk ver van de rechte liggen.Die 2 kleinere groepen rechts boven kunnen wijzen op seizoenaliteit.->oplossing kan misschien zijn om deze punten te analyseren.
2008-11-24 19:06:25 [Dorien Peeters] [reply
Als je kijkt naar de grafiek dan zie je dat niet alle punten dicht in de buurt van de rechte liggen. Zo zie je dat er links onderaan een groot deel punten tamelijk ver van de rechte ligt, en dat er ook 2 kleinere groepen rechts boven tamelijk ver van de rechte liggen.Die 2 kleinere groepen rechts boven kunnen wijzen op seizoenaliteit.->oplossing kan misschien zijn om deze punten te analyseren
2008-11-24 19:08:41 [Liese Tormans] [reply
De Bivariate Density gaat met behulp van hoogtelijnen de punten van gelijkaardige observaties verbinden. De grafiek bestaat uit verschillende kleuren die intensiteit weergeven.
Een rode kleur geeft een sterke intensiteit weer terwijl de gele en groene kleur wijzen op een eerder zwakke correlatie.
Ook is het mogelijk om aan de hand van deze grafiek de clusters af te lezen.

Het voordeel hier is dat we meer info krijgen dan bij de scatter plot of gewone correlatie.
Want bij de andere grafieken is niet echt rekening gehouden met de invloed van de derde variabele.

Op deze grafiek is er duidelijk een verband zichtbaar tussen de dataset werkloosheid en invoer. Ook zien we op dat er 3 clusters aanwezig zijn.
De correlatie is 0.54 we kunnen dus spreken van een zwak positief verband. Dit is ook zichtbaar op de grafiek de punten liggen al meer verspreid rond de rechte. Ook zien we twee kleinere clusters rechts boven dit kan eventueel wijzen op seizoenaliteit. Maar omdat zeker te weten moeten we eerst een analyse van de punten uitvoeren.

Post a new message
Dataseries X:
15,1
14,8
16,1
14,3
15,2
14,9
13,1
12,6
13,6
14,4
14
12,9
13,4
13,5
14,8
14,3
14,3
14
13,2
12,2
14,3
15,7
14,2
14,6
14,5
14,3
15,3
14,4
13,7
14,2
13,5
11,9
14,6
15,6
14,1
14,9
14,2
14,6
17,2
15,4
14,3
17,5
14,5
14,4
16,6
16,7
16,6
16,9
15,7
16,4
18,4
16,9
16,5
18,3
15,1
15,7
18,1
16,8
18,9
19
18,1
17,8
21,5
17,1
18,7
19
16,4
16,9
18,6
19,3
19,4
17,6
Dataseries Y:
467
460
448
443
436
431
484
510
513
503
471
471
476
475
470
461
455
456
517
525
523
519
509
512
519
517
510
509
501
507
569
580
578
565
547
555
562
561
555
544
537
543
594
611
613
611
594
595
591
589
584
573
567
569
621
629
628
612
595
597
593
590
580
574
573
573
620
626
620
588
566
557


Summary of computational transaction
Raw Inputview raw input (R code)
Raw Outputview raw output of R engine
Computing time3 seconds
R Server'Sir Ronald Aylmer Fisher' @ 193.190.124.24

\begin{tabular}{lllllllll}
\hline
Summary of computational transaction \tabularnewline
Raw Input & view raw input (R code)  \tabularnewline
Raw Output & view raw output of R engine  \tabularnewline
Computing time & 3 seconds \tabularnewline
R Server & 'Sir Ronald Aylmer Fisher' @ 193.190.124.24 \tabularnewline
\hline
\end{tabular}
%Source: https://freestatistics.org/blog/index.php?pk=22793&T=0

[TABLE]
[ROW][C]Summary of computational transaction[/C][/ROW]
[ROW][C]Raw Input[/C][C]view raw input (R code) [/C][/ROW]
[ROW][C]Raw Output[/C][C]view raw output of R engine [/C][/ROW]
[ROW][C]Computing time[/C][C]3 seconds[/C][/ROW]
[ROW][C]R Server[/C][C]'Sir Ronald Aylmer Fisher' @ 193.190.124.24[/C][/ROW]
[/TABLE]
Source: https://freestatistics.org/blog/index.php?pk=22793&T=0

Globally Unique Identifier (entire table): ba.freestatistics.org/blog/index.php?pk=22793&T=0

As an alternative you can also use a QR Code:  

The GUIDs for individual cells are displayed in the table below:

Summary of computational transaction
Raw Inputview raw input (R code)
Raw Outputview raw output of R engine
Computing time3 seconds
R Server'Sir Ronald Aylmer Fisher' @ 193.190.124.24


Bandwidth
x axis0.637379794413632
y axis21.3901917936107
Correlation
correlation used in KDE0.547538942847347
correlation(x,y)0.547538942847347

\begin{tabular}{lllllllll}
\hline
Bandwidth \tabularnewline
x axis & 0.637379794413632 \tabularnewline
y axis & 21.3901917936107 \tabularnewline
Correlation \tabularnewline
correlation used in KDE & 0.547538942847347 \tabularnewline
correlation(x,y) & 0.547538942847347 \tabularnewline
\hline
\end{tabular}
%Source: https://freestatistics.org/blog/index.php?pk=22793&T=1

[TABLE]
[ROW][C]Bandwidth[/C][/ROW]
[ROW][C]x axis[/C][C]0.637379794413632[/C][/ROW]
[ROW][C]y axis[/C][C]21.3901917936107[/C][/ROW]
[ROW][C]Correlation[/C][/ROW]
[ROW][C]correlation used in KDE[/C][C]0.547538942847347[/C][/ROW]
[ROW][C]correlation(x,y)[/C][C]0.547538942847347[/C][/ROW]
[/TABLE]
Source: https://freestatistics.org/blog/index.php?pk=22793&T=1

Globally Unique Identifier (entire table): ba.freestatistics.org/blog/index.php?pk=22793&T=1

As an alternative you can also use a QR Code:  

The GUIDs for individual cells are displayed in the table below:

Bandwidth
x axis0.637379794413632
y axis21.3901917936107
Correlation
correlation used in KDE0.547538942847347
correlation(x,y)0.547538942847347


Parameters (Session):
par1 = 50 ; par2 = 50 ; par3 = 0 ; par4 = 0 ; par5 = 0 ; par6 = Y ; par7 = Y ;
Parameters (R input):
par1 = 50 ; par2 = 50 ; par3 = 0 ; par4 = 0 ; par5 = 0 ; par6 = Y ; par7 = Y ;
R code (references can be found in the software module):
par1 <- as(par1,'numeric')
par2 <- as(par2,'numeric')
par3 <- as(par3,'numeric')
par4 <- as(par4,'numeric')
par5 <- as(par5,'numeric')
library('GenKern')
if (par3==0) par3 <- dpik(x)
if (par4==0) par4 <- dpik(y)
if (par5==0) par5 <- cor(x,y)
if (par1 > 500) par1 <- 500
if (par2 > 500) par2 <- 500
bitmap(file='bidensity.png')
op <- KernSur(x,y, xgridsize=par1, ygridsize=par2, correlation=par5, xbandwidth=par3, ybandwidth=par4)
image(op$xords, op$yords, op$zden, col=terrain.colors(100), axes=TRUE,main=main,xlab=xlab,ylab=ylab)
if (par6=='Y') contour(op$xords, op$yords, op$zden, add=TRUE)
if (par7=='Y') points(x,y)
(r<-lm(y ~ x))
abline(r)
box()
dev.off()
load(file='createtable')
a<-table.start()
a<-table.row.start(a)
a<-table.element(a,'Bandwidth',2,TRUE)
a<-table.row.end(a)
a<-table.row.start(a)
a<-table.element(a,'x axis',header=TRUE)
a<-table.element(a,par3)
a<-table.row.end(a)
a<-table.row.start(a)
a<-table.element(a,'y axis',header=TRUE)
a<-table.element(a,par4)
a<-table.row.end(a)
a<-table.row.start(a)
a<-table.element(a,'Correlation',2,TRUE)
a<-table.row.end(a)
a<-table.row.start(a)
a<-table.element(a,'correlation used in KDE',header=TRUE)
a<-table.element(a,par5)
a<-table.row.end(a)
a<-table.row.start(a)
a<-table.element(a,'correlation(x,y)',header=TRUE)
a<-table.element(a,cor(x,y))
a<-table.row.end(a)
a<-table.end(a)
table.save(a,file='mytable.tab')