Free Statistics

of Irreproducible Research!

Author's title

Author*The author of this computation has been verified*
R Software Modulerwasp_hierarchicalclustering.wasp
Title produced by softwareHierarchical Clustering
Date of computationMon, 10 Nov 2008 02:56:50 -0700
Cite this page as followsStatistical Computations at FreeStatistics.org, Office for Research Development and Education, URL https://freestatistics.org/blog/index.php?v=date/2008/Nov/10/t1226311059xfrcwn6k3wqbaxp.htm/, Retrieved Sun, 19 May 2024 04:22:23 +0000
Statistical Computations at FreeStatistics.org, Office for Research Development and Education, URL https://freestatistics.org/blog/index.php?pk=22899, Retrieved Sun, 19 May 2024 04:22:23 +0000
QR Codes:

Original text written by user:
IsPrivate?No (this computation is public)
User-defined keywords
Estimated Impact200
Family? (F = Feedback message, R = changed R code, M = changed R Module, P = changed Parameters, D = changed Data)
F     [Univariate Data Series] [VMAW] [2008-10-13 16:54:40] [cbd3d88cd5aad6543e769146e7e26b0c]
F RMPD    [Hierarchical Clustering] [Opdracht 4 Q22] [2008-11-10 09:56:50] [2ae704d6b0222e84f58032588d68322b] [Current]
Feedback Forum
2008-11-19 15:29:39 [Mehmet Yilmaz] [reply
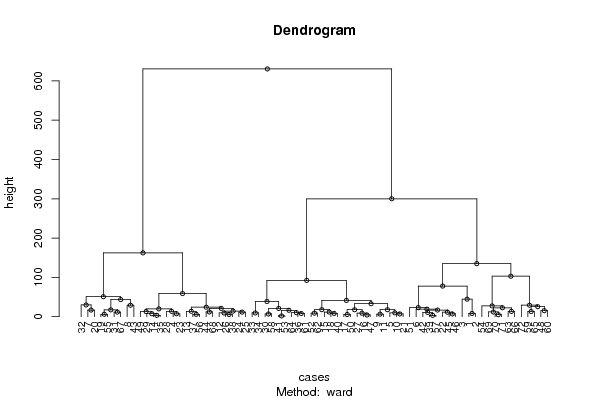
Deze boomstructuurdiagram toont aan waar en hoe de clusters zich bevinden of geplaatst zijn. Dit wordt puur exploratief gebruikt.
Deze clusters zijn geproduceerd door een clustering algoritme.
Meestal wordt dit gebruikt voor niet tijdreeksen vb marketing welke producten behoren samen?
2008-11-24 17:29:51 [Jan Cavents] [reply
het dendrogram is ook een manier om de clusters grafisch weer te geven. deze gegevens worden enkel exploratief gebruikt: bv om doelgroepen te achterhalen in een markt.
2008-11-24 18:58:06 [Steven Hulsmans] [reply
Op deze figuur zien we welke observaties gelijkaardig gezien kunnen worden.Het zijn allemaal clusters.

Post a new message
Dataseries X:
97.3	104.8	124.9	93.5
101	105.6	132	94.7
113.2	118.3	151.4	112.9
101	89.9	108.9	99.2
105.7	90.2	121.3	105.6
113.9	107	123.4	113
86.4	64.5	90.3	83.1
96.5	92.6	79.3	81.1
103.3	95.8	117.2	96.9
114.9	94.3	116.9	104.3
105.8	91.2	120.8	97.7
94.2	86.3	96.1	102.6
98.4	77.6	100.8	89.9
99.4	82.5	105.3	96
108.8	97.7	116.1	112.7
112.6	83.3	112.8	107.1
104.4	84.2	114.5	106.2
112.2	92.8	117.2	121
81.1	77.4	77.1	101.2
97.1	72.5	80.1	83.2
112.6	88.8	120.3	105.1
113.8	93.4	133.4	113.3
107.8	92.6	109.4	99.1
103.2	90.7	93.2	100.3
103.3	81.6	91.2	93.5
101.2	84.1	99.2	98.8
107.7	88.1	108.2	106.2
110.4	85.3	101.5	98.3
101.9	82.9	106.9	102.1
115.9	84.8	104.4	117.1
89.9	71.2	77.9	101.5
88.6	68.9	60	80.5
117.2	94.3	99.5	105.9
123.9	97.6	95	109.5
100	85.6	105.6	97.2
103.6	91.9	102.5	114.5
94.1	75.8	93.3	93.5
98.7	79.8	97.3	100.9
119.5	99	127	121.1
112.7	88.5	111.7	116.5
104.4	86.7	96.4	109.3
124.7	97.9	133	118.1
89.1	94.3	72.2	108.3
97	72.9	95.8	105.4
121.6	91.8	124.1	116.2
118.8	93.2	127.6	111.2
114	86.5	110.7	105.8
111.5	98.9	104.6	122.7
97.2	77.2	112.7	99.5
102.5	79.4	115.3	107.9
113.4	90.4	139.4	124.6
109.8	81.4	119	115
104.9	85.8	97.4	110.3
126.1	103.6	154	132.7
80	73.6	81.5	99.7
96.8	75.7	88.8	96.5
117.2	99.2	127.7	118.7
112.3	88.7	105.1	112.9
117.3	94.6	114.9	130.5
111.1	98.7	106.4	137.9
102.2	84.2	104.5	115
104.3	87.7	121.6	116.8
122.9	103.3	141.4	140.9
107.6	88.2	99	120.7
121.3	93.4	126.7	134.2
131.5	106.3	134.1	147.3
89	73.1	81.3	112.4
104.4	78.6	88.6	107.1
128.9	101.6	132.7	128.4
135.9	101.4	132.9	137.7
133.3	98.5	134.4	135
121.3	99	103.7	151


Summary of computational transaction
Raw Inputview raw input (R code)
Raw Outputview raw output of R engine
Computing time2 seconds
R Server'Gwilym Jenkins' @ 72.249.127.135

\begin{tabular}{lllllllll}
\hline
Summary of computational transaction \tabularnewline
Raw Input & view raw input (R code)  \tabularnewline
Raw Output & view raw output of R engine  \tabularnewline
Computing time & 2 seconds \tabularnewline
R Server & 'Gwilym Jenkins' @ 72.249.127.135 \tabularnewline
\hline
\end{tabular}
%Source: https://freestatistics.org/blog/index.php?pk=22899&T=0

[TABLE]
[ROW][C]Summary of computational transaction[/C][/ROW]
[ROW][C]Raw Input[/C][C]view raw input (R code) [/C][/ROW]
[ROW][C]Raw Output[/C][C]view raw output of R engine [/C][/ROW]
[ROW][C]Computing time[/C][C]2 seconds[/C][/ROW]
[ROW][C]R Server[/C][C]'Gwilym Jenkins' @ 72.249.127.135[/C][/ROW]
[/TABLE]
Source: https://freestatistics.org/blog/index.php?pk=22899&T=0

Globally Unique Identifier (entire table): ba.freestatistics.org/blog/index.php?pk=22899&T=0

As an alternative you can also use a QR Code:  

The GUIDs for individual cells are displayed in the table below:

Summary of computational transaction
Raw Inputview raw input (R code)
Raw Outputview raw output of R engine
Computing time2 seconds
R Server'Gwilym Jenkins' @ 72.249.127.135


Summary of Dendrogram
LabelHeight
11.74928556845359
23.39116499156263
33.40293990543470
44.27784992724149
54.97091540865462
65.49363267792815
75.72363520850168
86.04565960007674
96.10409698481275
106.40390505863414
116.8044103344816
126.85930025585701
136.90941386804988
147.33416661932355
157.43319846155543
168.09320702811933
178.1351090957651
188.32105762508589
198.7630497874952
208.94091717890284
219.42578354323287
229.43345111822815
239.82805309654202
2410.2042522365039
2510.7678490217154
2611.3966693593580
2711.5351636312625
2811.6099095603713
2911.7865146265502
3011.8949761916029
3111.9155360769040
3212.9553707875648
3313.0525859506842
3413.3120246394003
3513.5177973168608
3613.6214062055956
3714.1859814878576
3815.3127397940408
3916.2467087644982
4016.8089262000878
4116.8595005301798
4217.2893137747923
4317.5789998366768
4417.6310491608526
4517.7170188755694
4619.1484982910573
4719.7596056456984
4820.8315193126636
4921.0693710903141
5022.5353007088035
5123.0426162567524
5224.0234929671519
5325.4431124220435
5427.3135133835557
5529.1187224994504
5629.2057219049548
5729.7897975817926
5832.8690667823914
5938.4213355785105
6041.299015574525
6143.4852052433074
6244.4934922810275
6350.7837484460942
6458.7321871936795
6577.8147335127635
6692.3131526682733
67102.911129414342
68135.010684517327
69162.360760542454
70300.012429605276
71630.334083567835

\begin{tabular}{lllllllll}
\hline
Summary of Dendrogram \tabularnewline
Label & Height \tabularnewline
1 & 1.74928556845359 \tabularnewline
2 & 3.39116499156263 \tabularnewline
3 & 3.40293990543470 \tabularnewline
4 & 4.27784992724149 \tabularnewline
5 & 4.97091540865462 \tabularnewline
6 & 5.49363267792815 \tabularnewline
7 & 5.72363520850168 \tabularnewline
8 & 6.04565960007674 \tabularnewline
9 & 6.10409698481275 \tabularnewline
10 & 6.40390505863414 \tabularnewline
11 & 6.8044103344816 \tabularnewline
12 & 6.85930025585701 \tabularnewline
13 & 6.90941386804988 \tabularnewline
14 & 7.33416661932355 \tabularnewline
15 & 7.43319846155543 \tabularnewline
16 & 8.09320702811933 \tabularnewline
17 & 8.1351090957651 \tabularnewline
18 & 8.32105762508589 \tabularnewline
19 & 8.7630497874952 \tabularnewline
20 & 8.94091717890284 \tabularnewline
21 & 9.42578354323287 \tabularnewline
22 & 9.43345111822815 \tabularnewline
23 & 9.82805309654202 \tabularnewline
24 & 10.2042522365039 \tabularnewline
25 & 10.7678490217154 \tabularnewline
26 & 11.3966693593580 \tabularnewline
27 & 11.5351636312625 \tabularnewline
28 & 11.6099095603713 \tabularnewline
29 & 11.7865146265502 \tabularnewline
30 & 11.8949761916029 \tabularnewline
31 & 11.9155360769040 \tabularnewline
32 & 12.9553707875648 \tabularnewline
33 & 13.0525859506842 \tabularnewline
34 & 13.3120246394003 \tabularnewline
35 & 13.5177973168608 \tabularnewline
36 & 13.6214062055956 \tabularnewline
37 & 14.1859814878576 \tabularnewline
38 & 15.3127397940408 \tabularnewline
39 & 16.2467087644982 \tabularnewline
40 & 16.8089262000878 \tabularnewline
41 & 16.8595005301798 \tabularnewline
42 & 17.2893137747923 \tabularnewline
43 & 17.5789998366768 \tabularnewline
44 & 17.6310491608526 \tabularnewline
45 & 17.7170188755694 \tabularnewline
46 & 19.1484982910573 \tabularnewline
47 & 19.7596056456984 \tabularnewline
48 & 20.8315193126636 \tabularnewline
49 & 21.0693710903141 \tabularnewline
50 & 22.5353007088035 \tabularnewline
51 & 23.0426162567524 \tabularnewline
52 & 24.0234929671519 \tabularnewline
53 & 25.4431124220435 \tabularnewline
54 & 27.3135133835557 \tabularnewline
55 & 29.1187224994504 \tabularnewline
56 & 29.2057219049548 \tabularnewline
57 & 29.7897975817926 \tabularnewline
58 & 32.8690667823914 \tabularnewline
59 & 38.4213355785105 \tabularnewline
60 & 41.299015574525 \tabularnewline
61 & 43.4852052433074 \tabularnewline
62 & 44.4934922810275 \tabularnewline
63 & 50.7837484460942 \tabularnewline
64 & 58.7321871936795 \tabularnewline
65 & 77.8147335127635 \tabularnewline
66 & 92.3131526682733 \tabularnewline
67 & 102.911129414342 \tabularnewline
68 & 135.010684517327 \tabularnewline
69 & 162.360760542454 \tabularnewline
70 & 300.012429605276 \tabularnewline
71 & 630.334083567835 \tabularnewline
\hline
\end{tabular}
%Source: https://freestatistics.org/blog/index.php?pk=22899&T=1

[TABLE]
[ROW][C]Summary of Dendrogram[/C][/ROW]
[ROW][C]Label[/C][C]Height[/C][/ROW]
[ROW][C]1[/C][C]1.74928556845359[/C][/ROW]
[ROW][C]2[/C][C]3.39116499156263[/C][/ROW]
[ROW][C]3[/C][C]3.40293990543470[/C][/ROW]
[ROW][C]4[/C][C]4.27784992724149[/C][/ROW]
[ROW][C]5[/C][C]4.97091540865462[/C][/ROW]
[ROW][C]6[/C][C]5.49363267792815[/C][/ROW]
[ROW][C]7[/C][C]5.72363520850168[/C][/ROW]
[ROW][C]8[/C][C]6.04565960007674[/C][/ROW]
[ROW][C]9[/C][C]6.10409698481275[/C][/ROW]
[ROW][C]10[/C][C]6.40390505863414[/C][/ROW]
[ROW][C]11[/C][C]6.8044103344816[/C][/ROW]
[ROW][C]12[/C][C]6.85930025585701[/C][/ROW]
[ROW][C]13[/C][C]6.90941386804988[/C][/ROW]
[ROW][C]14[/C][C]7.33416661932355[/C][/ROW]
[ROW][C]15[/C][C]7.43319846155543[/C][/ROW]
[ROW][C]16[/C][C]8.09320702811933[/C][/ROW]
[ROW][C]17[/C][C]8.1351090957651[/C][/ROW]
[ROW][C]18[/C][C]8.32105762508589[/C][/ROW]
[ROW][C]19[/C][C]8.7630497874952[/C][/ROW]
[ROW][C]20[/C][C]8.94091717890284[/C][/ROW]
[ROW][C]21[/C][C]9.42578354323287[/C][/ROW]
[ROW][C]22[/C][C]9.43345111822815[/C][/ROW]
[ROW][C]23[/C][C]9.82805309654202[/C][/ROW]
[ROW][C]24[/C][C]10.2042522365039[/C][/ROW]
[ROW][C]25[/C][C]10.7678490217154[/C][/ROW]
[ROW][C]26[/C][C]11.3966693593580[/C][/ROW]
[ROW][C]27[/C][C]11.5351636312625[/C][/ROW]
[ROW][C]28[/C][C]11.6099095603713[/C][/ROW]
[ROW][C]29[/C][C]11.7865146265502[/C][/ROW]
[ROW][C]30[/C][C]11.8949761916029[/C][/ROW]
[ROW][C]31[/C][C]11.9155360769040[/C][/ROW]
[ROW][C]32[/C][C]12.9553707875648[/C][/ROW]
[ROW][C]33[/C][C]13.0525859506842[/C][/ROW]
[ROW][C]34[/C][C]13.3120246394003[/C][/ROW]
[ROW][C]35[/C][C]13.5177973168608[/C][/ROW]
[ROW][C]36[/C][C]13.6214062055956[/C][/ROW]
[ROW][C]37[/C][C]14.1859814878576[/C][/ROW]
[ROW][C]38[/C][C]15.3127397940408[/C][/ROW]
[ROW][C]39[/C][C]16.2467087644982[/C][/ROW]
[ROW][C]40[/C][C]16.8089262000878[/C][/ROW]
[ROW][C]41[/C][C]16.8595005301798[/C][/ROW]
[ROW][C]42[/C][C]17.2893137747923[/C][/ROW]
[ROW][C]43[/C][C]17.5789998366768[/C][/ROW]
[ROW][C]44[/C][C]17.6310491608526[/C][/ROW]
[ROW][C]45[/C][C]17.7170188755694[/C][/ROW]
[ROW][C]46[/C][C]19.1484982910573[/C][/ROW]
[ROW][C]47[/C][C]19.7596056456984[/C][/ROW]
[ROW][C]48[/C][C]20.8315193126636[/C][/ROW]
[ROW][C]49[/C][C]21.0693710903141[/C][/ROW]
[ROW][C]50[/C][C]22.5353007088035[/C][/ROW]
[ROW][C]51[/C][C]23.0426162567524[/C][/ROW]
[ROW][C]52[/C][C]24.0234929671519[/C][/ROW]
[ROW][C]53[/C][C]25.4431124220435[/C][/ROW]
[ROW][C]54[/C][C]27.3135133835557[/C][/ROW]
[ROW][C]55[/C][C]29.1187224994504[/C][/ROW]
[ROW][C]56[/C][C]29.2057219049548[/C][/ROW]
[ROW][C]57[/C][C]29.7897975817926[/C][/ROW]
[ROW][C]58[/C][C]32.8690667823914[/C][/ROW]
[ROW][C]59[/C][C]38.4213355785105[/C][/ROW]
[ROW][C]60[/C][C]41.299015574525[/C][/ROW]
[ROW][C]61[/C][C]43.4852052433074[/C][/ROW]
[ROW][C]62[/C][C]44.4934922810275[/C][/ROW]
[ROW][C]63[/C][C]50.7837484460942[/C][/ROW]
[ROW][C]64[/C][C]58.7321871936795[/C][/ROW]
[ROW][C]65[/C][C]77.8147335127635[/C][/ROW]
[ROW][C]66[/C][C]92.3131526682733[/C][/ROW]
[ROW][C]67[/C][C]102.911129414342[/C][/ROW]
[ROW][C]68[/C][C]135.010684517327[/C][/ROW]
[ROW][C]69[/C][C]162.360760542454[/C][/ROW]
[ROW][C]70[/C][C]300.012429605276[/C][/ROW]
[ROW][C]71[/C][C]630.334083567835[/C][/ROW]
[/TABLE]
Source: https://freestatistics.org/blog/index.php?pk=22899&T=1

Globally Unique Identifier (entire table): ba.freestatistics.org/blog/index.php?pk=22899&T=1

As an alternative you can also use a QR Code:  

The GUIDs for individual cells are displayed in the table below:

Summary of Dendrogram
LabelHeight
11.74928556845359
23.39116499156263
33.40293990543470
44.27784992724149
54.97091540865462
65.49363267792815
75.72363520850168
86.04565960007674
96.10409698481275
106.40390505863414
116.8044103344816
126.85930025585701
136.90941386804988
147.33416661932355
157.43319846155543
168.09320702811933
178.1351090957651
188.32105762508589
198.7630497874952
208.94091717890284
219.42578354323287
229.43345111822815
239.82805309654202
2410.2042522365039
2510.7678490217154
2611.3966693593580
2711.5351636312625
2811.6099095603713
2911.7865146265502
3011.8949761916029
3111.9155360769040
3212.9553707875648
3313.0525859506842
3413.3120246394003
3513.5177973168608
3613.6214062055956
3714.1859814878576
3815.3127397940408
3916.2467087644982
4016.8089262000878
4116.8595005301798
4217.2893137747923
4317.5789998366768
4417.6310491608526
4517.7170188755694
4619.1484982910573
4719.7596056456984
4820.8315193126636
4921.0693710903141
5022.5353007088035
5123.0426162567524
5224.0234929671519
5325.4431124220435
5427.3135133835557
5529.1187224994504
5629.2057219049548
5729.7897975817926
5832.8690667823914
5938.4213355785105
6041.299015574525
6143.4852052433074
6244.4934922810275
6350.7837484460942
6458.7321871936795
6577.8147335127635
6692.3131526682733
67102.911129414342
68135.010684517327
69162.360760542454
70300.012429605276
71630.334083567835


Parameters (Session):
par1 = ward ; par2 = ALL ; par3 = FALSE ; par4 = FALSE ;
Parameters (R input):
par1 = ward ; par2 = ALL ; par3 = FALSE ; par4 = FALSE ;
R code (references can be found in the software module):
par3 <- as.logical(par3)
par4 <- as.logical(par4)
if (par3 == 'TRUE'){
dum = xlab
xlab = ylab
ylab = dum
}
x <- t(y)
hc <- hclust(dist(x),method=par1)
d <- as.dendrogram(hc)
str(d)
mysub <- paste('Method: ',par1)
bitmap(file='test1.png')
if (par4 == 'TRUE'){
plot(d,main=main,ylab=ylab,xlab=xlab,horiz=par3, nodePar=list(pch = c(1,NA), cex=0.8, lab.cex = 0.8),type='t',center=T, sub=mysub)
} else {
plot(d,main=main,ylab=ylab,xlab=xlab,horiz=par3, nodePar=list(pch = c(1,NA), cex=0.8, lab.cex = 0.8), sub=mysub)
}
dev.off()
if (par2 != 'ALL'){
if (par3 == 'TRUE'){
ylab = 'cluster'
} else {
xlab = 'cluster'
}
par2 <- as.numeric(par2)
memb <- cutree(hc, k = par2)
cent <- NULL
for(k in 1:par2){
cent <- rbind(cent, colMeans(x[memb == k, , drop = FALSE]))
}
hc1 <- hclust(dist(cent),method=par1, members = table(memb))
de <- as.dendrogram(hc1)
bitmap(file='test2.png')
if (par4 == 'TRUE'){
plot(de,main=main,ylab=ylab,xlab=xlab,horiz=par3, nodePar=list(pch = c(1,NA), cex=0.8, lab.cex = 0.8),type='t',center=T, sub=mysub)
} else {
plot(de,main=main,ylab=ylab,xlab=xlab,horiz=par3, nodePar=list(pch = c(1,NA), cex=0.8, lab.cex = 0.8), sub=mysub)
}
dev.off()
str(de)
}
load(file='createtable')
a<-table.start()
a<-table.row.start(a)
a<-table.element(a,'Summary of Dendrogram',2,TRUE)
a<-table.row.end(a)
a<-table.row.start(a)
a<-table.element(a,'Label',header=TRUE)
a<-table.element(a,'Height',header=TRUE)
a<-table.row.end(a)
num <- length(x[,1])-1
for (i in 1:num)
{
a<-table.row.start(a)
a<-table.element(a,hc$labels[i])
a<-table.element(a,hc$height[i])
a<-table.row.end(a)
}
a<-table.end(a)
table.save(a,file='mytable1.tab')
if (par2 != 'ALL'){
a<-table.start()
a<-table.row.start(a)
a<-table.element(a,'Summary of Cut Dendrogram',2,TRUE)
a<-table.row.end(a)
a<-table.row.start(a)
a<-table.element(a,'Label',header=TRUE)
a<-table.element(a,'Height',header=TRUE)
a<-table.row.end(a)
num <- par2-1
for (i in 1:num)
{
a<-table.row.start(a)
a<-table.element(a,i)
a<-table.element(a,hc1$height[i])
a<-table.row.end(a)
}
a<-table.end(a)
table.save(a,file='mytable2.tab')
}