Free Statistics

of Irreproducible Research!

Author's title

Author*Unverified author*
R Software Modulerwasp_bidensity.wasp
Title produced by softwareBivariate Kernel Density Estimation
Date of computationWed, 12 Nov 2008 07:36:20 -0700
Cite this page as followsStatistical Computations at FreeStatistics.org, Office for Research Development and Education, URL https://freestatistics.org/blog/index.php?v=date/2008/Nov/12/t122650062075tzs6nzgy2wl3q.htm/, Retrieved Sun, 19 May 2024 07:55:29 +0000
Statistical Computations at FreeStatistics.org, Office for Research Development and Education, URL https://freestatistics.org/blog/index.php?pk=24216, Retrieved Sun, 19 May 2024 07:55:29 +0000
QR Codes:

Original text written by user:
IsPrivate?No (this computation is public)
User-defined keywords
Estimated Impact147
Family? (F = Feedback message, R = changed R code, M = changed R Module, P = changed Parameters, D = changed Data)
F       [Bivariate Kernel Density Estimation] [opdracht3_q1] [2008-11-12 14:36:20] [e8ace8b3d80d7fc51f1760fb13a6fe6b] [Current]
Feedback Forum
2008-11-19 17:47:14 [Steven Vercammen] [reply
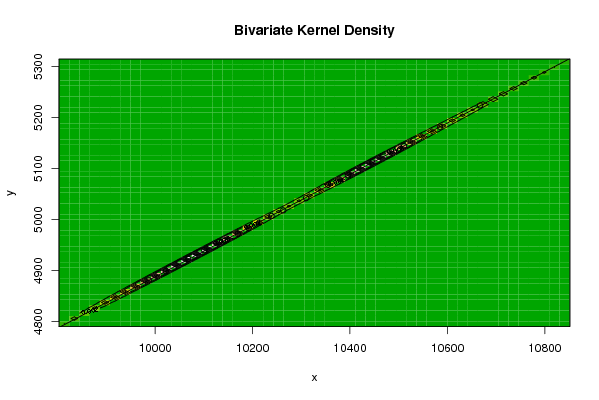
De grafiek wordt verkeerd geïnterpreteerd.De grafiek kan gebruikt worden om na te gaan of er sprake is van correlatie tussen de 2 variabelen. Het voordeel dat deze grafiek heeft ten opzichte van de gewone scatterplot is dat door de hoogtelijnen een soort van derde dimensie wordt weergegeven. Deze geeft de dichtheid van de observaties weer. Men kan dus zien waar de meeste observaties zich bevinden tov van de regressielijn. In dit geval is er sprake van een zeer sterke correlatie.
2008-11-21 20:43:29 [Gilliam Schoorel] [reply
Bivariate dichtheid schat de afhankelijkheid van de variabelen dmv de dichtheid te berekenen. Hier ligt de dichtheid zeer hoog, dit kan je ook zien in de tabel. De hoogtelijnen liggen zo dicht bij elkaar dat de ellipsvorm zo goed als verdwijnt en overlapt met de rechte. Men kan hier dus spreken van een zeer grote afhankelijkheid van de 2 variabelen.

Post a new message
Dataseries X:
9987
10022
10068
10101
10131
10143
10170
10192
10214
10239
10263
10310
10355
10396
10446
10511
10585
10667
Dataseries Y:
4881
4899
4923
4940
4956
4959
4972
4983
4994
5007
5018
5042
5068
5087
5112
5144
5182
5224


Summary of computational transaction
Raw Inputview raw input (R code)
Raw Outputview raw output of R engine
Computing time2 seconds
R Server'Sir Ronald Aylmer Fisher' @ 193.190.124.24

\begin{tabular}{lllllllll}
\hline
Summary of computational transaction \tabularnewline
Raw Input & view raw input (R code)  \tabularnewline
Raw Output & view raw output of R engine  \tabularnewline
Computing time & 2 seconds \tabularnewline
R Server & 'Sir Ronald Aylmer Fisher' @ 193.190.124.24 \tabularnewline
\hline
\end{tabular}
%Source: https://freestatistics.org/blog/index.php?pk=24216&T=0

[TABLE]
[ROW][C]Summary of computational transaction[/C][/ROW]
[ROW][C]Raw Input[/C][C]view raw input (R code) [/C][/ROW]
[ROW][C]Raw Output[/C][C]view raw output of R engine [/C][/ROW]
[ROW][C]Computing time[/C][C]2 seconds[/C][/ROW]
[ROW][C]R Server[/C][C]'Sir Ronald Aylmer Fisher' @ 193.190.124.24[/C][/ROW]
[/TABLE]
Source: https://freestatistics.org/blog/index.php?pk=24216&T=0

Globally Unique Identifier (entire table): ba.freestatistics.org/blog/index.php?pk=24216&T=0

As an alternative you can also use a QR Code:  

The GUIDs for individual cells are displayed in the table below:

Summary of computational transaction
Raw Inputview raw input (R code)
Raw Outputview raw output of R engine
Computing time2 seconds
R Server'Sir Ronald Aylmer Fisher' @ 193.190.124.24


Bandwidth
x axis115.816012412044
y axis56.9782686507355
Correlation
correlation used in KDE0.999919280929741
correlation(x,y)0.999919280929741

\begin{tabular}{lllllllll}
\hline
Bandwidth \tabularnewline
x axis & 115.816012412044 \tabularnewline
y axis & 56.9782686507355 \tabularnewline
Correlation \tabularnewline
correlation used in KDE & 0.999919280929741 \tabularnewline
correlation(x,y) & 0.999919280929741 \tabularnewline
\hline
\end{tabular}
%Source: https://freestatistics.org/blog/index.php?pk=24216&T=1

[TABLE]
[ROW][C]Bandwidth[/C][/ROW]
[ROW][C]x axis[/C][C]115.816012412044[/C][/ROW]
[ROW][C]y axis[/C][C]56.9782686507355[/C][/ROW]
[ROW][C]Correlation[/C][/ROW]
[ROW][C]correlation used in KDE[/C][C]0.999919280929741[/C][/ROW]
[ROW][C]correlation(x,y)[/C][C]0.999919280929741[/C][/ROW]
[/TABLE]
Source: https://freestatistics.org/blog/index.php?pk=24216&T=1

Globally Unique Identifier (entire table): ba.freestatistics.org/blog/index.php?pk=24216&T=1

As an alternative you can also use a QR Code:  

The GUIDs for individual cells are displayed in the table below:

Bandwidth
x axis115.816012412044
y axis56.9782686507355
Correlation
correlation used in KDE0.999919280929741
correlation(x,y)0.999919280929741


Parameters (Session):
par1 = 50 ; par2 = 50 ; par3 = 0 ; par4 = 0 ; par5 = 0 ; par6 = Y ; par7 = Y ;
Parameters (R input):
par1 = 50 ; par2 = 50 ; par3 = 0 ; par4 = 0 ; par5 = 0 ; par6 = Y ; par7 = Y ;
R code (references can be found in the software module):
par1 <- as(par1,'numeric')
par2 <- as(par2,'numeric')
par3 <- as(par3,'numeric')
par4 <- as(par4,'numeric')
par5 <- as(par5,'numeric')
library('GenKern')
if (par3==0) par3 <- dpik(x)
if (par4==0) par4 <- dpik(y)
if (par5==0) par5 <- cor(x,y)
if (par1 > 500) par1 <- 500
if (par2 > 500) par2 <- 500
bitmap(file='bidensity.png')
op <- KernSur(x,y, xgridsize=par1, ygridsize=par2, correlation=par5, xbandwidth=par3, ybandwidth=par4)
image(op$xords, op$yords, op$zden, col=terrain.colors(100), axes=TRUE,main=main,xlab=xlab,ylab=ylab)
if (par6=='Y') contour(op$xords, op$yords, op$zden, add=TRUE)
if (par7=='Y') points(x,y)
(r<-lm(y ~ x))
abline(r)
box()
dev.off()
load(file='createtable')
a<-table.start()
a<-table.row.start(a)
a<-table.element(a,'Bandwidth',2,TRUE)
a<-table.row.end(a)
a<-table.row.start(a)
a<-table.element(a,'x axis',header=TRUE)
a<-table.element(a,par3)
a<-table.row.end(a)
a<-table.row.start(a)
a<-table.element(a,'y axis',header=TRUE)
a<-table.element(a,par4)
a<-table.row.end(a)
a<-table.row.start(a)
a<-table.element(a,'Correlation',2,TRUE)
a<-table.row.end(a)
a<-table.row.start(a)
a<-table.element(a,'correlation used in KDE',header=TRUE)
a<-table.element(a,par5)
a<-table.row.end(a)
a<-table.row.start(a)
a<-table.element(a,'correlation(x,y)',header=TRUE)
a<-table.element(a,cor(x,y))
a<-table.row.end(a)
a<-table.end(a)
table.save(a,file='mytable.tab')