Free Statistics

of Irreproducible Research!

Author's title

Author*The author of this computation has been verified*
R Software Modulerwasp_cloud.wasp
Title produced by softwareTrivariate Scatterplots
Date of computationWed, 12 Nov 2008 12:13:45 -0700
Cite this page as followsStatistical Computations at FreeStatistics.org, Office for Research Development and Education, URL https://freestatistics.org/blog/index.php?v=date/2008/Nov/12/t122651740971agj2c6y6sp067.htm/, Retrieved Sun, 19 May 2024 07:01:39 +0000
Statistical Computations at FreeStatistics.org, Office for Research Development and Education, URL https://freestatistics.org/blog/index.php?pk=24399, Retrieved Sun, 19 May 2024 07:01:39 +0000
QR Codes:

Original text written by user:
IsPrivate?No (this computation is public)
User-defined keywords
Estimated Impact150
Family? (F = Feedback message, R = changed R code, M = changed R Module, P = changed Parameters, D = changed Data)
F       [Trivariate Scatterplots] [] [2008-11-12 19:13:45] [e7fa5259715477c9f32960f5b339b707] [Current]
Feedback Forum
2008-11-22 11:46:03 [Stephanie Vanderlinden] [reply
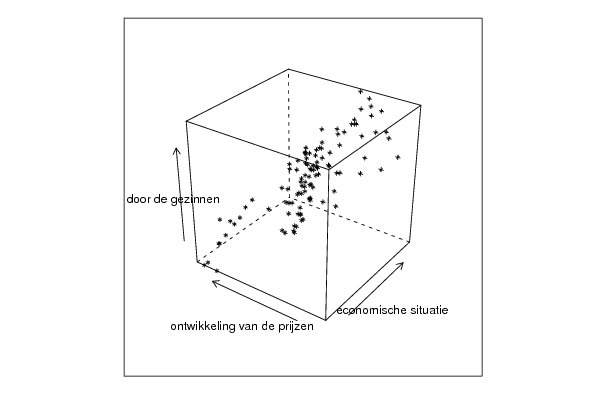
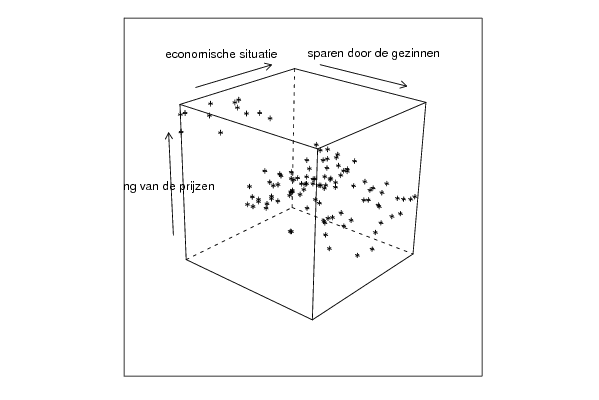
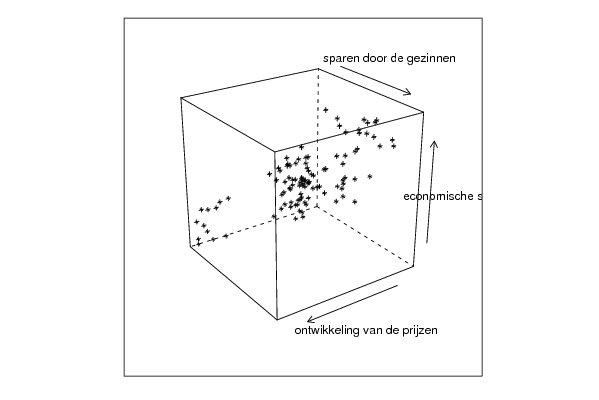
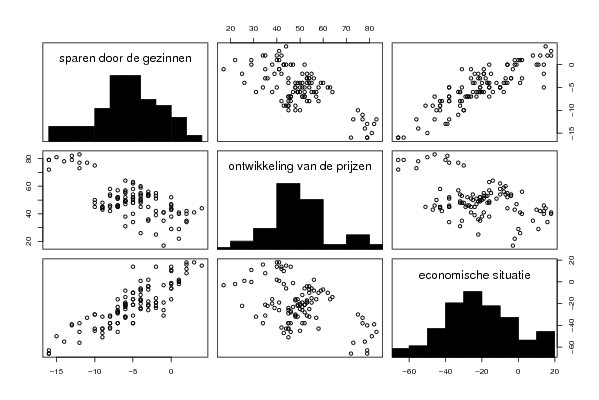
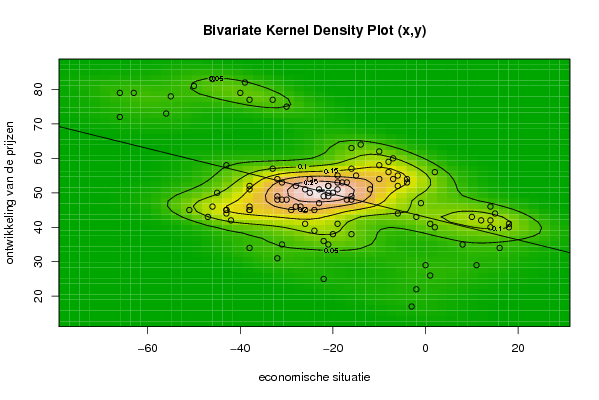
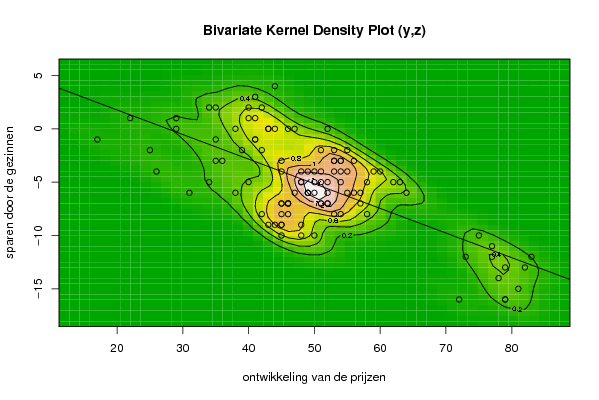
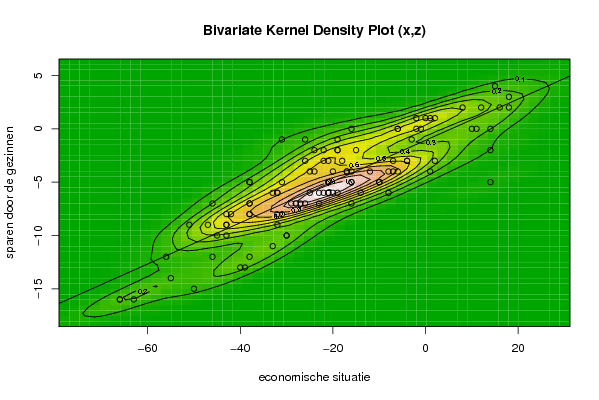
De studente bekomt de grafieken, maar ook hier ontbreekt de conclusie. Het triviate cluster plot geeft de correlatie weer tussen 3 variabelen in een 3-dimensioneel plot. De kubussen die gevormd worden kunnen uit verschillende perspectieven bekeken worden. Het is echter moeilijk om hier een analyse van te maken, daarom worden de kubussen ook op een 2-dimensionaal vlak afgebeeld (=histogram). Dit histogram geeft de scatterplots van alle mogelijke combinaties. Elke scatterplot is echter vertekend omdat niet elke variabele in rekening wordt gebracht. Een oplossing hiervoor is de de bivariate density plot. Deze geeft de correlatie weer tussen verschillende variabelen aan de hand van een regressierechte en hoogtelijnen.
2008-11-24 09:58:57 [Vincent Dolhain] [reply
De grafieken zijn in orde, maar de conclusies ontbreken weer. De triviate cluster plot geeft het correlatieverband weer tussen 3 variabelen. Omdat het dit doet in een 3D plot is het niet echt praktisch., maar ter compensatie geeft het ook een 2D plot. Op deze plot staan de histogrammen van elke variabelen en geeft het alles scatterplots weer die mogelijk tussen de variabelen, er doet zich dan wel een vertekening voor omdat nu maar 2 variabelen met elkaar worden vergeleken in plaats van de oorspronkelijke 3.
2008-11-24 19:59:29 [Sofie Sergoynne] [reply
De student bekomt de juiste grafieken maar wederom ontbreken de conclusies. De triviate cluster plot geeft het correlatieverband weer tussen 3 variabelen. De kubussen kunnen vanuit 3 verschillende perspectieven worden bekeken. Maar hier kan men vrij weinig uit afleiden en daarom gebruiken we een 2D plot. Maar dez worden ook vertekent omdat er maar 2 variabelen in zicht worden gebracht en geen 3. Een oplossing voor dit probleem is de bivariate density plot.

Post a new message
Dataseries X:
-3
-2
0
1
11
14
14
16
14
10
15
18
18
12
8
2
-2
-1
1
-6
-16
-21
-38
-32
-22
-31
-22
-26
-19
-20
-24
-29
-28
-31
-30
-32
-38
-43
-51
-43
-43
-42
-47
-45
-38
-46
-38
-32
-27
-26
-21
-23
-24
-17
-23
-16
-22
-26
-25
-21
-21
-18
-12
-19
-31
-38
-38
-32
-43
-33
-28
-25
-19
-20
-21
-19
-17
-16
-10
-16
-10
-8
-7
-15
-7
-6
-6
2
-4
-4
-8
-10
-16
-14
-30
-33
-40
-38
-39
-46
-50
-55
-66
-63
-56
-66
Dataseries Y:
17
22
29
26
29
42
40
34
46
43
44
40
41
42
35
40
43
47
41
44
38
35
34
31
25
35
36
41
41
38
39
45
46
48
48
48
45
44
45
45
45
42
43
50
46
46
45
49
46
45
49
47
45
48
51
48
49
51
54
52
52
53
51
55
53
51
52
54
58
57
52
50
53
50
50
51
53
49
54
57
58
56
60
55
54
52
55
56
54
53
59
62
63
64
75
77
79
77
82
83
81
78
79
79
73
72
Dataseries Z:
-1
1
1
-4
0
-2
-5
2
0
0
4
2
3
2
2
1
0
0
1
0
0
-3
-5
-6
-2
-1
-3
-1
-1
-6
-2
-7
-7
-5
-10
-9
-7
-9
-9
-10
-9
-8
-9
-10
-8
-7
-8
-6
-7
-3
-6
-6
-4
-4
-7
-5
-6
-7
-4
-6
-5
-3
-4
-6
-8
-5
-7
-8
-8
-6
-7
-6
-2
-4
-5
-2
-4
-4
-5
-7
-5
-6
-4
-2
-3
0
-4
-3
-3
-3
-4
-5
-5
-6
-10
-11
-13
-12
-13
-12
-15
-14
-16
-16
-12
-16


Summary of computational transaction
Raw Inputview raw input (R code)
Raw Outputview raw output of R engine
Computing time3 seconds
R Server'Gwilym Jenkins' @ 72.249.127.135

\begin{tabular}{lllllllll}
\hline
Summary of computational transaction \tabularnewline
Raw Input & view raw input (R code)  \tabularnewline
Raw Output & view raw output of R engine  \tabularnewline
Computing time & 3 seconds \tabularnewline
R Server & 'Gwilym Jenkins' @ 72.249.127.135 \tabularnewline
\hline
\end{tabular}
%Source: https://freestatistics.org/blog/index.php?pk=24399&T=0

[TABLE]
[ROW][C]Summary of computational transaction[/C][/ROW]
[ROW][C]Raw Input[/C][C]view raw input (R code) [/C][/ROW]
[ROW][C]Raw Output[/C][C]view raw output of R engine [/C][/ROW]
[ROW][C]Computing time[/C][C]3 seconds[/C][/ROW]
[ROW][C]R Server[/C][C]'Gwilym Jenkins' @ 72.249.127.135[/C][/ROW]
[/TABLE]
Source: https://freestatistics.org/blog/index.php?pk=24399&T=0

Globally Unique Identifier (entire table): ba.freestatistics.org/blog/index.php?pk=24399&T=0

As an alternative you can also use a QR Code:  

The GUIDs for individual cells are displayed in the table below:

Summary of computational transaction
Raw Inputview raw input (R code)
Raw Outputview raw output of R engine
Computing time3 seconds
R Server'Gwilym Jenkins' @ 72.249.127.135


Parameters (Session):
par1 = 50 ; par2 = 50 ; par3 = Y ; par4 = Y ; par5 = economische situatie ; par6 = ontwikkeling van de prijzen ; par7 = sparen door de gezinnen ;
Parameters (R input):
par1 = 50 ; par2 = 50 ; par3 = Y ; par4 = Y ; par5 = economische situatie ; par6 = ontwikkeling van de prijzen ; par7 = sparen door de gezinnen ;
R code (references can be found in the software module):
x <- array(x,dim=c(length(x),1))
colnames(x) <- par5
y <- array(y,dim=c(length(y),1))
colnames(y) <- par6
z <- array(z,dim=c(length(z),1))
colnames(z) <- par7
d <- data.frame(cbind(z,y,x))
colnames(d) <- list(par7,par6,par5)
par1 <- as.numeric(par1)
par2 <- as.numeric(par2)
if (par1>500) par1 <- 500
if (par2>500) par2 <- 500
if (par1<10) par1 <- 10
if (par2<10) par2 <- 10
library(GenKern)
library(lattice)
panel.hist <- function(x, ...)
{
usr <- par('usr'); on.exit(par(usr))
par(usr = c(usr[1:2], 0, 1.5) )
h <- hist(x, plot = FALSE)
breaks <- h$breaks; nB <- length(breaks)
y <- h$counts; y <- y/max(y)
rect(breaks[-nB], 0, breaks[-1], y, col='black', ...)
}
bitmap(file='cloud1.png')
cloud(z~x*y, screen = list(x=-45, y=45, z=35),xlab=par5,ylab=par6,zlab=par7)
dev.off()
bitmap(file='cloud2.png')
cloud(z~x*y, screen = list(x=35, y=45, z=25),xlab=par5,ylab=par6,zlab=par7)
dev.off()
bitmap(file='cloud3.png')
cloud(z~x*y, screen = list(x=35, y=-25, z=90),xlab=par5,ylab=par6,zlab=par7)
dev.off()
bitmap(file='pairs.png')
pairs(d,diag.panel=panel.hist)
dev.off()
x <- as.vector(x)
y <- as.vector(y)
z <- as.vector(z)
bitmap(file='bidensity1.png')
op <- KernSur(x,y, xgridsize=par1, ygridsize=par2, correlation=cor(x,y), xbandwidth=dpik(x), ybandwidth=dpik(y))
image(op$xords, op$yords, op$zden, col=terrain.colors(100), axes=TRUE,main='Bivariate Kernel Density Plot (x,y)',xlab=par5,ylab=par6)
if (par3=='Y') contour(op$xords, op$yords, op$zden, add=TRUE)
if (par4=='Y') points(x,y)
(r<-lm(y ~ x))
abline(r)
box()
dev.off()
bitmap(file='bidensity2.png')
op <- KernSur(y,z, xgridsize=par1, ygridsize=par2, correlation=cor(y,z), xbandwidth=dpik(y), ybandwidth=dpik(z))
op
image(op$xords, op$yords, op$zden, col=terrain.colors(100), axes=TRUE,main='Bivariate Kernel Density Plot (y,z)',xlab=par6,ylab=par7)
if (par3=='Y') contour(op$xords, op$yords, op$zden, add=TRUE)
if (par4=='Y') points(y,z)
(r<-lm(z ~ y))
abline(r)
box()
dev.off()
bitmap(file='bidensity3.png')
op <- KernSur(x,z, xgridsize=par1, ygridsize=par2, correlation=cor(x,z), xbandwidth=dpik(x), ybandwidth=dpik(z))
op
image(op$xords, op$yords, op$zden, col=terrain.colors(100), axes=TRUE,main='Bivariate Kernel Density Plot (x,z)',xlab=par5,ylab=par7)
if (par3=='Y') contour(op$xords, op$yords, op$zden, add=TRUE)
if (par4=='Y') points(x,z)
(r<-lm(z ~ x))
abline(r)
box()
dev.off()