Free Statistics

of Irreproducible Research!

Author's title

Author*The author of this computation has been verified*
R Software Modulerwasp_multipleregression.wasp
Title produced by softwareMultiple Regression
Date of computationWed, 19 Nov 2008 09:28:26 -0700
Cite this page as followsStatistical Computations at FreeStatistics.org, Office for Research Development and Education, URL https://freestatistics.org/blog/index.php?v=date/2008/Nov/19/t1227112331zgk9xjyuyny1zzd.htm/, Retrieved Sat, 18 May 2024 23:11:46 +0000
Statistical Computations at FreeStatistics.org, Office for Research Development and Education, URL https://freestatistics.org/blog/index.php?pk=25043, Retrieved Sat, 18 May 2024 23:11:46 +0000
QR Codes:

Original text written by user:
IsPrivate?No (this computation is public)
User-defined keywords
Estimated Impact207
Family? (F = Feedback message, R = changed R code, M = changed R Module, P = changed Parameters, D = changed Data)
-     [Multiple Regression] [Q1 The Seatbeltlaw] [2007-11-14 19:27:43] [8cd6641b921d30ebe00b648d1481bba0]
F R  D  [Multiple Regression] [Case: Seatbelt la...] [2008-11-19 14:41:36] [6743688719638b0cb1c0a6e0bf433315]
F    D      [Multiple Regression] [Reeks 1 Werkloosh...] [2008-11-19 16:28:26] [9b05d7ef5dbcfba4217d280d9092f628] [Current]
Feedback Forum
2008-11-27 23:31:13 [Bob Leysen] [reply
De link is correct.

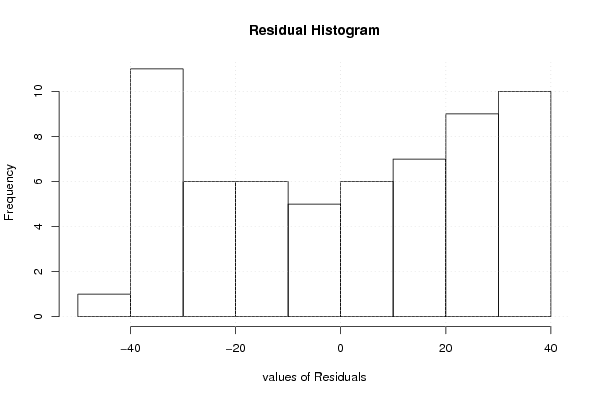
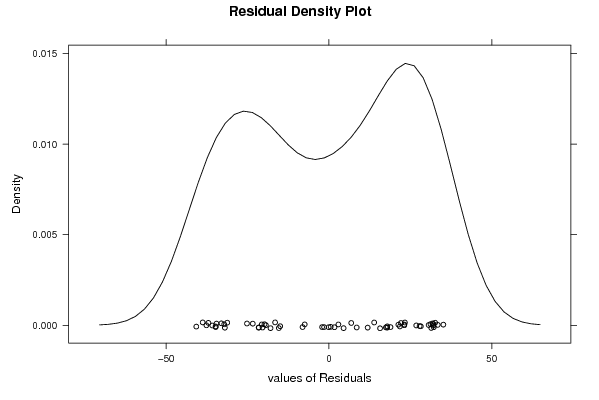
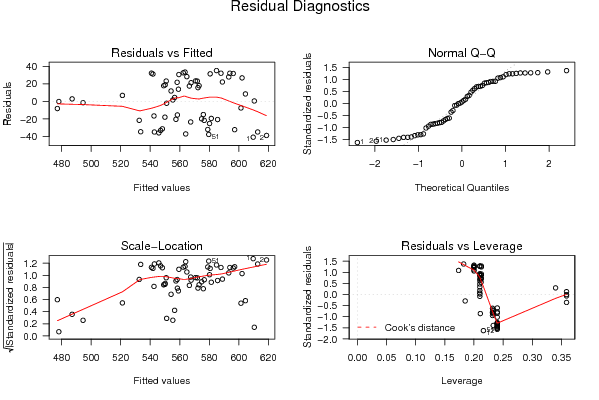
Er is duidelijk geen normaalverdeling (density plot helemaal niet symmetrisch, de plot vertoond geen kenmerkend bel-vorm en heeft zelfs inzinkingen aan de top).
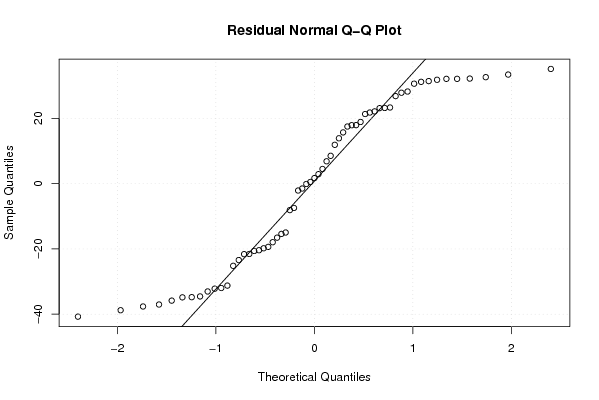
De QQ-plot laat duidelijk zien dat de punten zeker niet op 1 rechte liggen.
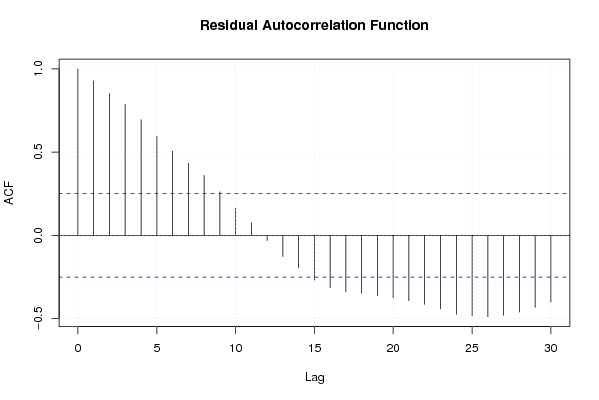
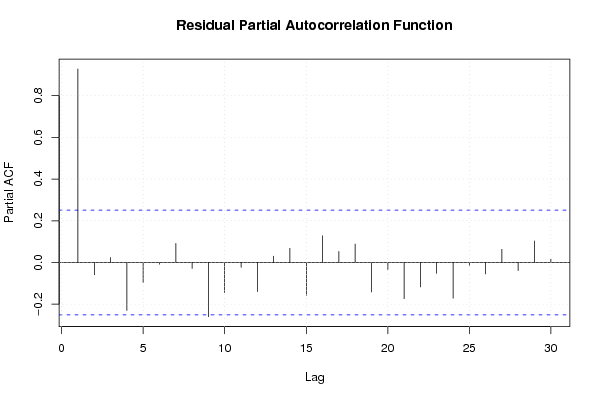
Er zijn ook veel pieken bij de autocorrelatie die verschillen van nul.

De R-squared is wel laag (60%), dit is de verklarende kracht.
2008-11-29 16:51:22 [Stefanie Mertens] [reply
De werkloosheid neemt niet alleen af met 47. Maar aangezien jij een seizoenale dummy en een lineaire trend ingeeft zullen deze ook een invloed hebben op het werkloosheidscijfer. Ik weet niet in welke maand jou tijdreeks begint dus kan niet zeggen wat de referentiemaand is. het valt wel op dat in alle maanden behalve de 11de het werkloosheidscijfer toeneemt. De lineaire trend wordt voorgesteld door t. dus iedere maand ga je nog een x-keren 0.69 aftrekken van het werkloosheidscijfer.
SD = de standaardfout. dus het aantal dat men ernaast kan zitten bij de berekening.

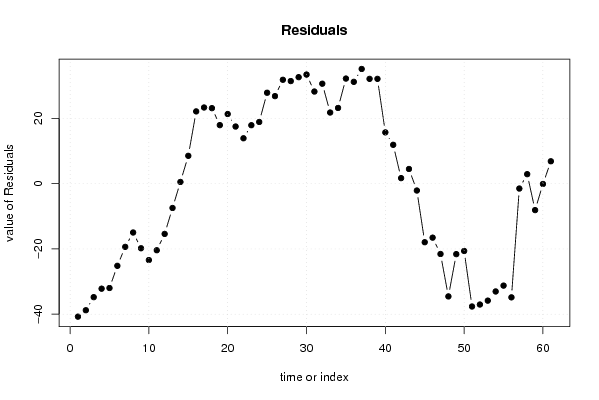
de residuals zijn zeker niet gelijk aan 0.
er is geen sprake van een normaalverdeling.
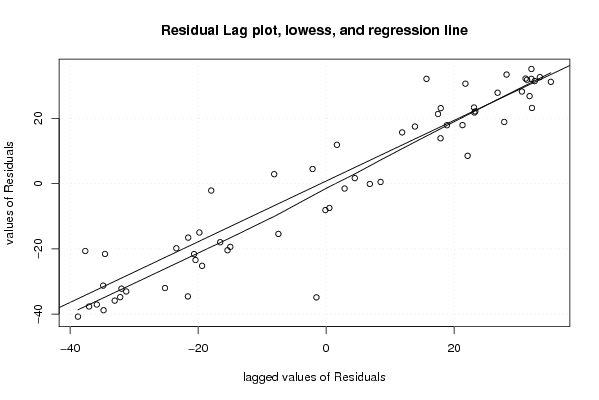
en er is zeker sprake van autocorrelatie.
jouw model staat dus nog niet op punt.

Post a new message
Dataseries X:
569	0
580	0
578	0
565	0
547	0
555	0
562	0
561	0
555	0
544	0
537	0
543	0
594	0
611	0
613	0
611	0
594	0
595	0
591	0
589	0
584	0
573	0
567	0
569	0
621	0
629	0
628	0
612	0
595	0
597	0
593	0
590	0
580	0
574	0
573	0
573	0
620	0
626	0
620	0
588	0
566	0
557	0
561	0
549	0
532	0
526	0
511	0
499	0
555	0
565	0
542	0
527	0
510	0
514	0
517	0
508	0
493	1
490	1
469	1
478	1
528	1


Summary of computational transaction
Raw Inputview raw input (R code)
Raw Outputview raw output of R engine
Computing time4 seconds
R Server'George Udny Yule' @ 72.249.76.132

\begin{tabular}{lllllllll}
\hline
Summary of computational transaction \tabularnewline
Raw Input & view raw input (R code)  \tabularnewline
Raw Output & view raw output of R engine  \tabularnewline
Computing time & 4 seconds \tabularnewline
R Server & 'George Udny Yule' @ 72.249.76.132 \tabularnewline
\hline
\end{tabular}
%Source: https://freestatistics.org/blog/index.php?pk=25043&T=0

[TABLE]
[ROW][C]Summary of computational transaction[/C][/ROW]
[ROW][C]Raw Input[/C][C]view raw input (R code) [/C][/ROW]
[ROW][C]Raw Output[/C][C]view raw output of R engine [/C][/ROW]
[ROW][C]Computing time[/C][C]4 seconds[/C][/ROW]
[ROW][C]R Server[/C][C]'George Udny Yule' @ 72.249.76.132[/C][/ROW]
[/TABLE]
Source: https://freestatistics.org/blog/index.php?pk=25043&T=0

Globally Unique Identifier (entire table): ba.freestatistics.org/blog/index.php?pk=25043&T=0

As an alternative you can also use a QR Code:  

The GUIDs for individual cells are displayed in the table below:

Summary of computational transaction
Raw Inputview raw input (R code)
Raw Outputview raw output of R engine
Computing time4 seconds
R Server'George Udny Yule' @ 72.249.76.132


Multiple Linear Regression - Estimated Regression Equation
werkloosheid_in_duizenden[t] = + 566.687128712872 -47.1485148514851dummy[t] + 43.7426292629265M1[t] + 53.4654565456546M2[t] + 48.1559405940593M3[t] + 33.2464246424642M4[t] + 15.7369086908691M5[t] + 17.6273927392739M6[t] + 19.5178767876787M7[t] + 14.8083608360836M8[t] + 14.3285478547854M9[t] + 7.6190319031903M10[t] -1.69048404840486M11[t] -0.690484048404842t + e[t]

\begin{tabular}{lllllllll}
\hline
Multiple Linear Regression - Estimated Regression Equation \tabularnewline
werkloosheid_in_duizenden[t] =  +  566.687128712872 -47.1485148514851dummy[t] +  43.7426292629265M1[t] +  53.4654565456546M2[t] +  48.1559405940593M3[t] +  33.2464246424642M4[t] +  15.7369086908691M5[t] +  17.6273927392739M6[t] +  19.5178767876787M7[t] +  14.8083608360836M8[t] +  14.3285478547854M9[t] +  7.6190319031903M10[t] -1.69048404840486M11[t] -0.690484048404842t  + e[t] \tabularnewline
\hline
\end{tabular}
%Source: https://freestatistics.org/blog/index.php?pk=25043&T=1

[TABLE]
[ROW][C]Multiple Linear Regression - Estimated Regression Equation[/C][/ROW]
[ROW][C]werkloosheid_in_duizenden[t] =  +  566.687128712872 -47.1485148514851dummy[t] +  43.7426292629265M1[t] +  53.4654565456546M2[t] +  48.1559405940593M3[t] +  33.2464246424642M4[t] +  15.7369086908691M5[t] +  17.6273927392739M6[t] +  19.5178767876787M7[t] +  14.8083608360836M8[t] +  14.3285478547854M9[t] +  7.6190319031903M10[t] -1.69048404840486M11[t] -0.690484048404842t  + e[t][/C][/ROW]
[/TABLE]
Source: https://freestatistics.org/blog/index.php?pk=25043&T=1

Globally Unique Identifier (entire table): ba.freestatistics.org/blog/index.php?pk=25043&T=1

As an alternative you can also use a QR Code:  

The GUIDs for individual cells are displayed in the table below:

Multiple Linear Regression - Estimated Regression Equation
werkloosheid_in_duizenden[t] = + 566.687128712872 -47.1485148514851dummy[t] + 43.7426292629265M1[t] + 53.4654565456546M2[t] + 48.1559405940593M3[t] + 33.2464246424642M4[t] + 15.7369086908691M5[t] + 17.6273927392739M6[t] + 19.5178767876787M7[t] + 14.8083608360836M8[t] + 14.3285478547854M9[t] + 7.6190319031903M10[t] -1.69048404840486M11[t] -0.690484048404842t + e[t]


Multiple Linear Regression - Ordinary Least Squares
VariableParameterS.D.T-STATH0: parameter = 02-tail p-value1-tail p-value
(Intercept)566.68712871287214.7403538.444600
dummy-47.148514851485115.898554-2.96560.0047350.002368
M143.742629262926517.1685662.54780.0141690.007085
M253.465456545654618.1408562.94720.0049780.002489
M348.155940594059318.1308992.6560.0107640.005382
M433.246424642464218.1240011.83440.0729310.036466
M515.736908690869118.1201650.86850.3895480.194774
M617.627392739273918.1193920.97280.335610.167805
M719.517876787678718.1216841.0770.2869570.143479
M814.808360836083618.1270390.81690.4180950.209048
M914.328547854785417.9127260.79990.4277880.213894
M107.619031903190317.9049740.42550.6723950.336198
M11-1.6904840484048617.900322-0.09440.9251620.462581
t-0.6904840484048420.235642-2.93020.0052140.002607

\begin{tabular}{lllllllll}
\hline
Multiple Linear Regression - Ordinary Least Squares \tabularnewline
Variable & Parameter & S.D. & T-STATH0: parameter = 0 & 2-tail p-value & 1-tail p-value \tabularnewline
(Intercept) & 566.687128712872 & 14.74035 & 38.4446 & 0 & 0 \tabularnewline
dummy & -47.1485148514851 & 15.898554 & -2.9656 & 0.004735 & 0.002368 \tabularnewline
M1 & 43.7426292629265 & 17.168566 & 2.5478 & 0.014169 & 0.007085 \tabularnewline
M2 & 53.4654565456546 & 18.140856 & 2.9472 & 0.004978 & 0.002489 \tabularnewline
M3 & 48.1559405940593 & 18.130899 & 2.656 & 0.010764 & 0.005382 \tabularnewline
M4 & 33.2464246424642 & 18.124001 & 1.8344 & 0.072931 & 0.036466 \tabularnewline
M5 & 15.7369086908691 & 18.120165 & 0.8685 & 0.389548 & 0.194774 \tabularnewline
M6 & 17.6273927392739 & 18.119392 & 0.9728 & 0.33561 & 0.167805 \tabularnewline
M7 & 19.5178767876787 & 18.121684 & 1.077 & 0.286957 & 0.143479 \tabularnewline
M8 & 14.8083608360836 & 18.127039 & 0.8169 & 0.418095 & 0.209048 \tabularnewline
M9 & 14.3285478547854 & 17.912726 & 0.7999 & 0.427788 & 0.213894 \tabularnewline
M10 & 7.6190319031903 & 17.904974 & 0.4255 & 0.672395 & 0.336198 \tabularnewline
M11 & -1.69048404840486 & 17.900322 & -0.0944 & 0.925162 & 0.462581 \tabularnewline
t & -0.690484048404842 & 0.235642 & -2.9302 & 0.005214 & 0.002607 \tabularnewline
\hline
\end{tabular}
%Source: https://freestatistics.org/blog/index.php?pk=25043&T=2

[TABLE]
[ROW][C]Multiple Linear Regression - Ordinary Least Squares[/C][/ROW]
[ROW][C]Variable[/C][C]Parameter[/C][C]S.D.[/C][C]T-STATH0: parameter = 0[/C][C]2-tail p-value[/C][C]1-tail p-value[/C][/ROW]
[ROW][C](Intercept)[/C][C]566.687128712872[/C][C]14.74035[/C][C]38.4446[/C][C]0[/C][C]0[/C][/ROW]
[ROW][C]dummy[/C][C]-47.1485148514851[/C][C]15.898554[/C][C]-2.9656[/C][C]0.004735[/C][C]0.002368[/C][/ROW]
[ROW][C]M1[/C][C]43.7426292629265[/C][C]17.168566[/C][C]2.5478[/C][C]0.014169[/C][C]0.007085[/C][/ROW]
[ROW][C]M2[/C][C]53.4654565456546[/C][C]18.140856[/C][C]2.9472[/C][C]0.004978[/C][C]0.002489[/C][/ROW]
[ROW][C]M3[/C][C]48.1559405940593[/C][C]18.130899[/C][C]2.656[/C][C]0.010764[/C][C]0.005382[/C][/ROW]
[ROW][C]M4[/C][C]33.2464246424642[/C][C]18.124001[/C][C]1.8344[/C][C]0.072931[/C][C]0.036466[/C][/ROW]
[ROW][C]M5[/C][C]15.7369086908691[/C][C]18.120165[/C][C]0.8685[/C][C]0.389548[/C][C]0.194774[/C][/ROW]
[ROW][C]M6[/C][C]17.6273927392739[/C][C]18.119392[/C][C]0.9728[/C][C]0.33561[/C][C]0.167805[/C][/ROW]
[ROW][C]M7[/C][C]19.5178767876787[/C][C]18.121684[/C][C]1.077[/C][C]0.286957[/C][C]0.143479[/C][/ROW]
[ROW][C]M8[/C][C]14.8083608360836[/C][C]18.127039[/C][C]0.8169[/C][C]0.418095[/C][C]0.209048[/C][/ROW]
[ROW][C]M9[/C][C]14.3285478547854[/C][C]17.912726[/C][C]0.7999[/C][C]0.427788[/C][C]0.213894[/C][/ROW]
[ROW][C]M10[/C][C]7.6190319031903[/C][C]17.904974[/C][C]0.4255[/C][C]0.672395[/C][C]0.336198[/C][/ROW]
[ROW][C]M11[/C][C]-1.69048404840486[/C][C]17.900322[/C][C]-0.0944[/C][C]0.925162[/C][C]0.462581[/C][/ROW]
[ROW][C]t[/C][C]-0.690484048404842[/C][C]0.235642[/C][C]-2.9302[/C][C]0.005214[/C][C]0.002607[/C][/ROW]
[/TABLE]
Source: https://freestatistics.org/blog/index.php?pk=25043&T=2

Globally Unique Identifier (entire table): ba.freestatistics.org/blog/index.php?pk=25043&T=2

As an alternative you can also use a QR Code:  

The GUIDs for individual cells are displayed in the table below:

Multiple Linear Regression - Ordinary Least Squares
VariableParameterS.D.T-STATH0: parameter = 02-tail p-value1-tail p-value
(Intercept)566.68712871287214.7403538.444600
dummy-47.148514851485115.898554-2.96560.0047350.002368
M143.742629262926517.1685662.54780.0141690.007085
M253.465456545654618.1408562.94720.0049780.002489
M348.155940594059318.1308992.6560.0107640.005382
M433.246424642464218.1240011.83440.0729310.036466
M515.736908690869118.1201650.86850.3895480.194774
M617.627392739273918.1193920.97280.335610.167805
M719.517876787678718.1216841.0770.2869570.143479
M814.808360836083618.1270390.81690.4180950.209048
M914.328547854785417.9127260.79990.4277880.213894
M107.619031903190317.9049740.42550.6723950.336198
M11-1.6904840484048617.900322-0.09440.9251620.462581
t-0.6904840484048420.235642-2.93020.0052140.002607


Multiple Linear Regression - Regression Statistics
Multiple R0.772445428045574
R-squared0.59667193930851
Adjusted R-squared0.485113114010864
F-TEST (value)5.34849607564934
F-TEST (DF numerator)13
F-TEST (DF denominator)47
p-value9.02126592139396e-06
Multiple Linear Regression - Residual Statistics
Residual Standard Deviation28.3004415499957
Sum Squared Residuals37643.004620462

\begin{tabular}{lllllllll}
\hline
Multiple Linear Regression - Regression Statistics \tabularnewline
Multiple R & 0.772445428045574 \tabularnewline
R-squared & 0.59667193930851 \tabularnewline
Adjusted R-squared & 0.485113114010864 \tabularnewline
F-TEST (value) & 5.34849607564934 \tabularnewline
F-TEST (DF numerator) & 13 \tabularnewline
F-TEST (DF denominator) & 47 \tabularnewline
p-value & 9.02126592139396e-06 \tabularnewline
Multiple Linear Regression - Residual Statistics \tabularnewline
Residual Standard Deviation & 28.3004415499957 \tabularnewline
Sum Squared Residuals & 37643.004620462 \tabularnewline
\hline
\end{tabular}
%Source: https://freestatistics.org/blog/index.php?pk=25043&T=3

[TABLE]
[ROW][C]Multiple Linear Regression - Regression Statistics[/C][/ROW]
[ROW][C]Multiple R[/C][C]0.772445428045574[/C][/ROW]
[ROW][C]R-squared[/C][C]0.59667193930851[/C][/ROW]
[ROW][C]Adjusted R-squared[/C][C]0.485113114010864[/C][/ROW]
[ROW][C]F-TEST (value)[/C][C]5.34849607564934[/C][/ROW]
[ROW][C]F-TEST (DF numerator)[/C][C]13[/C][/ROW]
[ROW][C]F-TEST (DF denominator)[/C][C]47[/C][/ROW]
[ROW][C]p-value[/C][C]9.02126592139396e-06[/C][/ROW]
[ROW][C]Multiple Linear Regression - Residual Statistics[/C][/ROW]
[ROW][C]Residual Standard Deviation[/C][C]28.3004415499957[/C][/ROW]
[ROW][C]Sum Squared Residuals[/C][C]37643.004620462[/C][/ROW]
[/TABLE]
Source: https://freestatistics.org/blog/index.php?pk=25043&T=3

Globally Unique Identifier (entire table): ba.freestatistics.org/blog/index.php?pk=25043&T=3

As an alternative you can also use a QR Code:  

The GUIDs for individual cells are displayed in the table below:

Multiple Linear Regression - Regression Statistics
Multiple R0.772445428045574
R-squared0.59667193930851
Adjusted R-squared0.485113114010864
F-TEST (value)5.34849607564934
F-TEST (DF numerator)13
F-TEST (DF denominator)47
p-value9.02126592139396e-06
Multiple Linear Regression - Residual Statistics
Residual Standard Deviation28.3004415499957
Sum Squared Residuals37643.004620462


Multiple Linear Regression - Actuals, Interpolation, and Residuals
Time or IndexActualsInterpolationForecastResidualsPrediction Error
1569609.739273927392-40.7392739273918
2580618.771617161716-38.7716171617163
3578612.771617161716-34.7716171617163
4565597.171617161716-32.1716171617163
5547578.971617161716-31.9716171617161
6555580.171617161716-25.1716171617162
7562581.371617161716-19.3716171617162
8561575.971617161716-14.9716171617162
9555574.801320132013-19.8013201320132
10544567.401320132013-23.4013201320132
11537557.401320132013-20.4013201320132
12543558.401320132013-15.4013201320133
13594601.453465346535-7.45346534653489
14611610.4858085808580.51419141914192
15613604.4858085808588.51419141914189
16611588.88580858085822.1141914191419
17594570.68580858085823.3141914191419
18595571.88580858085823.1141914191419
19591573.08580858085817.9141914191419
20589567.68580858085821.3141914191419
21584566.51551155115517.4844884488449
22573559.11551155115513.8844884488449
23567549.11551155115517.8844884488449
24569550.11551155115518.8844884488448
25621593.16765676567727.8323432343232
26629602.226.8000000000000
27628596.231.8
28612580.631.4000000000000
29595562.432.6
30597563.633.4
31593564.828.2
32590559.430.6
33580558.22970297029721.7702970297030
34574550.82970297029723.1702970297030
35573540.82970297029732.170297029703
36573541.82970297029731.1702970297029
37620584.88184818481935.1181518151813
38626593.91419141914232.0858085808581
39620587.91419141914232.0858085808581
40588572.31419141914215.6858085808582
41566554.11419141914211.8858085808581
42557555.3141914191421.68580858085812
43561556.5141914191424.4858085808581
44549551.114191419142-2.11419141914190
45532549.943894389439-17.9438943894389
46526542.543894389439-16.5438943894389
47511532.543894389439-21.5438943894389
48499533.543894389439-34.5438943894390
49555576.59603960396-21.5960396039606
50565585.628382838284-20.6283828382837
51542579.628382838284-37.6283828382838
52527564.028382838284-37.0283828382837
53510545.828382838284-35.8283828382838
54514547.028382838284-33.0283828382838
55517548.228382838284-31.2283828382838
56508542.828382838284-34.8283828382838
57493494.509570957096-1.50957095709567
58490487.1095709570962.89042904290434
59469477.109570957096-8.10957095709567
60478478.109570957096-0.109570957095683
61528521.1617161716176.8382838283827

\begin{tabular}{lllllllll}
\hline
Multiple Linear Regression - Actuals, Interpolation, and Residuals \tabularnewline
Time or Index & Actuals & InterpolationForecast & ResidualsPrediction Error \tabularnewline
1 & 569 & 609.739273927392 & -40.7392739273918 \tabularnewline
2 & 580 & 618.771617161716 & -38.7716171617163 \tabularnewline
3 & 578 & 612.771617161716 & -34.7716171617163 \tabularnewline
4 & 565 & 597.171617161716 & -32.1716171617163 \tabularnewline
5 & 547 & 578.971617161716 & -31.9716171617161 \tabularnewline
6 & 555 & 580.171617161716 & -25.1716171617162 \tabularnewline
7 & 562 & 581.371617161716 & -19.3716171617162 \tabularnewline
8 & 561 & 575.971617161716 & -14.9716171617162 \tabularnewline
9 & 555 & 574.801320132013 & -19.8013201320132 \tabularnewline
10 & 544 & 567.401320132013 & -23.4013201320132 \tabularnewline
11 & 537 & 557.401320132013 & -20.4013201320132 \tabularnewline
12 & 543 & 558.401320132013 & -15.4013201320133 \tabularnewline
13 & 594 & 601.453465346535 & -7.45346534653489 \tabularnewline
14 & 611 & 610.485808580858 & 0.51419141914192 \tabularnewline
15 & 613 & 604.485808580858 & 8.51419141914189 \tabularnewline
16 & 611 & 588.885808580858 & 22.1141914191419 \tabularnewline
17 & 594 & 570.685808580858 & 23.3141914191419 \tabularnewline
18 & 595 & 571.885808580858 & 23.1141914191419 \tabularnewline
19 & 591 & 573.085808580858 & 17.9141914191419 \tabularnewline
20 & 589 & 567.685808580858 & 21.3141914191419 \tabularnewline
21 & 584 & 566.515511551155 & 17.4844884488449 \tabularnewline
22 & 573 & 559.115511551155 & 13.8844884488449 \tabularnewline
23 & 567 & 549.115511551155 & 17.8844884488449 \tabularnewline
24 & 569 & 550.115511551155 & 18.8844884488448 \tabularnewline
25 & 621 & 593.167656765677 & 27.8323432343232 \tabularnewline
26 & 629 & 602.2 & 26.8000000000000 \tabularnewline
27 & 628 & 596.2 & 31.8 \tabularnewline
28 & 612 & 580.6 & 31.4000000000000 \tabularnewline
29 & 595 & 562.4 & 32.6 \tabularnewline
30 & 597 & 563.6 & 33.4 \tabularnewline
31 & 593 & 564.8 & 28.2 \tabularnewline
32 & 590 & 559.4 & 30.6 \tabularnewline
33 & 580 & 558.229702970297 & 21.7702970297030 \tabularnewline
34 & 574 & 550.829702970297 & 23.1702970297030 \tabularnewline
35 & 573 & 540.829702970297 & 32.170297029703 \tabularnewline
36 & 573 & 541.829702970297 & 31.1702970297029 \tabularnewline
37 & 620 & 584.881848184819 & 35.1181518151813 \tabularnewline
38 & 626 & 593.914191419142 & 32.0858085808581 \tabularnewline
39 & 620 & 587.914191419142 & 32.0858085808581 \tabularnewline
40 & 588 & 572.314191419142 & 15.6858085808582 \tabularnewline
41 & 566 & 554.114191419142 & 11.8858085808581 \tabularnewline
42 & 557 & 555.314191419142 & 1.68580858085812 \tabularnewline
43 & 561 & 556.514191419142 & 4.4858085808581 \tabularnewline
44 & 549 & 551.114191419142 & -2.11419141914190 \tabularnewline
45 & 532 & 549.943894389439 & -17.9438943894389 \tabularnewline
46 & 526 & 542.543894389439 & -16.5438943894389 \tabularnewline
47 & 511 & 532.543894389439 & -21.5438943894389 \tabularnewline
48 & 499 & 533.543894389439 & -34.5438943894390 \tabularnewline
49 & 555 & 576.59603960396 & -21.5960396039606 \tabularnewline
50 & 565 & 585.628382838284 & -20.6283828382837 \tabularnewline
51 & 542 & 579.628382838284 & -37.6283828382838 \tabularnewline
52 & 527 & 564.028382838284 & -37.0283828382837 \tabularnewline
53 & 510 & 545.828382838284 & -35.8283828382838 \tabularnewline
54 & 514 & 547.028382838284 & -33.0283828382838 \tabularnewline
55 & 517 & 548.228382838284 & -31.2283828382838 \tabularnewline
56 & 508 & 542.828382838284 & -34.8283828382838 \tabularnewline
57 & 493 & 494.509570957096 & -1.50957095709567 \tabularnewline
58 & 490 & 487.109570957096 & 2.89042904290434 \tabularnewline
59 & 469 & 477.109570957096 & -8.10957095709567 \tabularnewline
60 & 478 & 478.109570957096 & -0.109570957095683 \tabularnewline
61 & 528 & 521.161716171617 & 6.8382838283827 \tabularnewline
\hline
\end{tabular}
%Source: https://freestatistics.org/blog/index.php?pk=25043&T=4

[TABLE]
[ROW][C]Multiple Linear Regression - Actuals, Interpolation, and Residuals[/C][/ROW]
[ROW][C]Time or Index[/C][C]Actuals[/C][C]InterpolationForecast[/C][C]ResidualsPrediction Error[/C][/ROW]
[ROW][C]1[/C][C]569[/C][C]609.739273927392[/C][C]-40.7392739273918[/C][/ROW]
[ROW][C]2[/C][C]580[/C][C]618.771617161716[/C][C]-38.7716171617163[/C][/ROW]
[ROW][C]3[/C][C]578[/C][C]612.771617161716[/C][C]-34.7716171617163[/C][/ROW]
[ROW][C]4[/C][C]565[/C][C]597.171617161716[/C][C]-32.1716171617163[/C][/ROW]
[ROW][C]5[/C][C]547[/C][C]578.971617161716[/C][C]-31.9716171617161[/C][/ROW]
[ROW][C]6[/C][C]555[/C][C]580.171617161716[/C][C]-25.1716171617162[/C][/ROW]
[ROW][C]7[/C][C]562[/C][C]581.371617161716[/C][C]-19.3716171617162[/C][/ROW]
[ROW][C]8[/C][C]561[/C][C]575.971617161716[/C][C]-14.9716171617162[/C][/ROW]
[ROW][C]9[/C][C]555[/C][C]574.801320132013[/C][C]-19.8013201320132[/C][/ROW]
[ROW][C]10[/C][C]544[/C][C]567.401320132013[/C][C]-23.4013201320132[/C][/ROW]
[ROW][C]11[/C][C]537[/C][C]557.401320132013[/C][C]-20.4013201320132[/C][/ROW]
[ROW][C]12[/C][C]543[/C][C]558.401320132013[/C][C]-15.4013201320133[/C][/ROW]
[ROW][C]13[/C][C]594[/C][C]601.453465346535[/C][C]-7.45346534653489[/C][/ROW]
[ROW][C]14[/C][C]611[/C][C]610.485808580858[/C][C]0.51419141914192[/C][/ROW]
[ROW][C]15[/C][C]613[/C][C]604.485808580858[/C][C]8.51419141914189[/C][/ROW]
[ROW][C]16[/C][C]611[/C][C]588.885808580858[/C][C]22.1141914191419[/C][/ROW]
[ROW][C]17[/C][C]594[/C][C]570.685808580858[/C][C]23.3141914191419[/C][/ROW]
[ROW][C]18[/C][C]595[/C][C]571.885808580858[/C][C]23.1141914191419[/C][/ROW]
[ROW][C]19[/C][C]591[/C][C]573.085808580858[/C][C]17.9141914191419[/C][/ROW]
[ROW][C]20[/C][C]589[/C][C]567.685808580858[/C][C]21.3141914191419[/C][/ROW]
[ROW][C]21[/C][C]584[/C][C]566.515511551155[/C][C]17.4844884488449[/C][/ROW]
[ROW][C]22[/C][C]573[/C][C]559.115511551155[/C][C]13.8844884488449[/C][/ROW]
[ROW][C]23[/C][C]567[/C][C]549.115511551155[/C][C]17.8844884488449[/C][/ROW]
[ROW][C]24[/C][C]569[/C][C]550.115511551155[/C][C]18.8844884488448[/C][/ROW]
[ROW][C]25[/C][C]621[/C][C]593.167656765677[/C][C]27.8323432343232[/C][/ROW]
[ROW][C]26[/C][C]629[/C][C]602.2[/C][C]26.8000000000000[/C][/ROW]
[ROW][C]27[/C][C]628[/C][C]596.2[/C][C]31.8[/C][/ROW]
[ROW][C]28[/C][C]612[/C][C]580.6[/C][C]31.4000000000000[/C][/ROW]
[ROW][C]29[/C][C]595[/C][C]562.4[/C][C]32.6[/C][/ROW]
[ROW][C]30[/C][C]597[/C][C]563.6[/C][C]33.4[/C][/ROW]
[ROW][C]31[/C][C]593[/C][C]564.8[/C][C]28.2[/C][/ROW]
[ROW][C]32[/C][C]590[/C][C]559.4[/C][C]30.6[/C][/ROW]
[ROW][C]33[/C][C]580[/C][C]558.229702970297[/C][C]21.7702970297030[/C][/ROW]
[ROW][C]34[/C][C]574[/C][C]550.829702970297[/C][C]23.1702970297030[/C][/ROW]
[ROW][C]35[/C][C]573[/C][C]540.829702970297[/C][C]32.170297029703[/C][/ROW]
[ROW][C]36[/C][C]573[/C][C]541.829702970297[/C][C]31.1702970297029[/C][/ROW]
[ROW][C]37[/C][C]620[/C][C]584.881848184819[/C][C]35.1181518151813[/C][/ROW]
[ROW][C]38[/C][C]626[/C][C]593.914191419142[/C][C]32.0858085808581[/C][/ROW]
[ROW][C]39[/C][C]620[/C][C]587.914191419142[/C][C]32.0858085808581[/C][/ROW]
[ROW][C]40[/C][C]588[/C][C]572.314191419142[/C][C]15.6858085808582[/C][/ROW]
[ROW][C]41[/C][C]566[/C][C]554.114191419142[/C][C]11.8858085808581[/C][/ROW]
[ROW][C]42[/C][C]557[/C][C]555.314191419142[/C][C]1.68580858085812[/C][/ROW]
[ROW][C]43[/C][C]561[/C][C]556.514191419142[/C][C]4.4858085808581[/C][/ROW]
[ROW][C]44[/C][C]549[/C][C]551.114191419142[/C][C]-2.11419141914190[/C][/ROW]
[ROW][C]45[/C][C]532[/C][C]549.943894389439[/C][C]-17.9438943894389[/C][/ROW]
[ROW][C]46[/C][C]526[/C][C]542.543894389439[/C][C]-16.5438943894389[/C][/ROW]
[ROW][C]47[/C][C]511[/C][C]532.543894389439[/C][C]-21.5438943894389[/C][/ROW]
[ROW][C]48[/C][C]499[/C][C]533.543894389439[/C][C]-34.5438943894390[/C][/ROW]
[ROW][C]49[/C][C]555[/C][C]576.59603960396[/C][C]-21.5960396039606[/C][/ROW]
[ROW][C]50[/C][C]565[/C][C]585.628382838284[/C][C]-20.6283828382837[/C][/ROW]
[ROW][C]51[/C][C]542[/C][C]579.628382838284[/C][C]-37.6283828382838[/C][/ROW]
[ROW][C]52[/C][C]527[/C][C]564.028382838284[/C][C]-37.0283828382837[/C][/ROW]
[ROW][C]53[/C][C]510[/C][C]545.828382838284[/C][C]-35.8283828382838[/C][/ROW]
[ROW][C]54[/C][C]514[/C][C]547.028382838284[/C][C]-33.0283828382838[/C][/ROW]
[ROW][C]55[/C][C]517[/C][C]548.228382838284[/C][C]-31.2283828382838[/C][/ROW]
[ROW][C]56[/C][C]508[/C][C]542.828382838284[/C][C]-34.8283828382838[/C][/ROW]
[ROW][C]57[/C][C]493[/C][C]494.509570957096[/C][C]-1.50957095709567[/C][/ROW]
[ROW][C]58[/C][C]490[/C][C]487.109570957096[/C][C]2.89042904290434[/C][/ROW]
[ROW][C]59[/C][C]469[/C][C]477.109570957096[/C][C]-8.10957095709567[/C][/ROW]
[ROW][C]60[/C][C]478[/C][C]478.109570957096[/C][C]-0.109570957095683[/C][/ROW]
[ROW][C]61[/C][C]528[/C][C]521.161716171617[/C][C]6.8382838283827[/C][/ROW]
[/TABLE]
Source: https://freestatistics.org/blog/index.php?pk=25043&T=4

Globally Unique Identifier (entire table): ba.freestatistics.org/blog/index.php?pk=25043&T=4

As an alternative you can also use a QR Code:  

The GUIDs for individual cells are displayed in the table below:

Multiple Linear Regression - Actuals, Interpolation, and Residuals
Time or IndexActualsInterpolationForecastResidualsPrediction Error
1569609.739273927392-40.7392739273918
2580618.771617161716-38.7716171617163
3578612.771617161716-34.7716171617163
4565597.171617161716-32.1716171617163
5547578.971617161716-31.9716171617161
6555580.171617161716-25.1716171617162
7562581.371617161716-19.3716171617162
8561575.971617161716-14.9716171617162
9555574.801320132013-19.8013201320132
10544567.401320132013-23.4013201320132
11537557.401320132013-20.4013201320132
12543558.401320132013-15.4013201320133
13594601.453465346535-7.45346534653489
14611610.4858085808580.51419141914192
15613604.4858085808588.51419141914189
16611588.88580858085822.1141914191419
17594570.68580858085823.3141914191419
18595571.88580858085823.1141914191419
19591573.08580858085817.9141914191419
20589567.68580858085821.3141914191419
21584566.51551155115517.4844884488449
22573559.11551155115513.8844884488449
23567549.11551155115517.8844884488449
24569550.11551155115518.8844884488448
25621593.16765676567727.8323432343232
26629602.226.8000000000000
27628596.231.8
28612580.631.4000000000000
29595562.432.6
30597563.633.4
31593564.828.2
32590559.430.6
33580558.22970297029721.7702970297030
34574550.82970297029723.1702970297030
35573540.82970297029732.170297029703
36573541.82970297029731.1702970297029
37620584.88184818481935.1181518151813
38626593.91419141914232.0858085808581
39620587.91419141914232.0858085808581
40588572.31419141914215.6858085808582
41566554.11419141914211.8858085808581
42557555.3141914191421.68580858085812
43561556.5141914191424.4858085808581
44549551.114191419142-2.11419141914190
45532549.943894389439-17.9438943894389
46526542.543894389439-16.5438943894389
47511532.543894389439-21.5438943894389
48499533.543894389439-34.5438943894390
49555576.59603960396-21.5960396039606
50565585.628382838284-20.6283828382837
51542579.628382838284-37.6283828382838
52527564.028382838284-37.0283828382837
53510545.828382838284-35.8283828382838
54514547.028382838284-33.0283828382838
55517548.228382838284-31.2283828382838
56508542.828382838284-34.8283828382838
57493494.509570957096-1.50957095709567
58490487.1095709570962.89042904290434
59469477.109570957096-8.10957095709567
60478478.109570957096-0.109570957095683
61528521.1617161716176.8382838283827


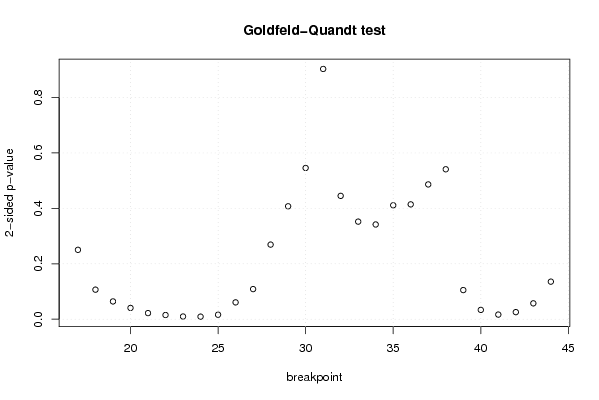
Goldfeld-Quandt test for Heteroskedasticity
p-valuesAlternative Hypothesis
breakpoint indexgreater2-sidedless
170.1251310083416010.2502620166832020.874868991658399
180.05328488025736080.1065697605147220.94671511974264
190.03205902838522850.0641180567704570.967940971614772
200.02032488121229310.04064976242458620.979675118787707
210.01101337223113010.02202674446226020.98898662776887
220.007508644952676390.01501728990535280.992491355047324
230.004841645235339060.009683290470678120.99515835476466
240.004583865598670160.009167731197340330.99541613440133
250.008076954572150380.01615390914430080.99192304542785
260.03036023875436570.06072047750873140.969639761245634
270.05431004209413830.1086200841882770.945689957905862
280.1345570661335150.2691141322670300.865442933866485
290.2036992245389860.4073984490779710.796300775461015
300.2728669840995990.5457339681991980.727133015900401
310.5484991813395440.9030016373209110.451500818660456
320.7774830127398210.4450339745203570.222516987260179
330.8239645644099960.3520708711800080.176035435590004
340.8291161694667380.3417676610665240.170883830533262
350.7944118104324640.4111763791350720.205588189567536
360.7928214855717190.4143570288565630.207178514428281
370.7568470795119840.4863058409760320.243152920488016
380.7294928673559770.5410142652880460.270507132644023
390.9474761893923340.1050476212153310.0525238106076655
400.983242924160780.03351415167843880.0167570758392194
410.991705075031210.01658984993757830.00829492496878915
420.9872755373799440.02544892524011220.0127244626200561
430.971386947385910.05722610522817830.0286130526140892
440.932240365596790.1355192688064180.067759634403209

\begin{tabular}{lllllllll}
\hline
Goldfeld-Quandt test for Heteroskedasticity \tabularnewline
p-values & Alternative Hypothesis \tabularnewline
breakpoint index & greater & 2-sided & less \tabularnewline
17 & 0.125131008341601 & 0.250262016683202 & 0.874868991658399 \tabularnewline
18 & 0.0532848802573608 & 0.106569760514722 & 0.94671511974264 \tabularnewline
19 & 0.0320590283852285 & 0.064118056770457 & 0.967940971614772 \tabularnewline
20 & 0.0203248812122931 & 0.0406497624245862 & 0.979675118787707 \tabularnewline
21 & 0.0110133722311301 & 0.0220267444622602 & 0.98898662776887 \tabularnewline
22 & 0.00750864495267639 & 0.0150172899053528 & 0.992491355047324 \tabularnewline
23 & 0.00484164523533906 & 0.00968329047067812 & 0.99515835476466 \tabularnewline
24 & 0.00458386559867016 & 0.00916773119734033 & 0.99541613440133 \tabularnewline
25 & 0.00807695457215038 & 0.0161539091443008 & 0.99192304542785 \tabularnewline
26 & 0.0303602387543657 & 0.0607204775087314 & 0.969639761245634 \tabularnewline
27 & 0.0543100420941383 & 0.108620084188277 & 0.945689957905862 \tabularnewline
28 & 0.134557066133515 & 0.269114132267030 & 0.865442933866485 \tabularnewline
29 & 0.203699224538986 & 0.407398449077971 & 0.796300775461015 \tabularnewline
30 & 0.272866984099599 & 0.545733968199198 & 0.727133015900401 \tabularnewline
31 & 0.548499181339544 & 0.903001637320911 & 0.451500818660456 \tabularnewline
32 & 0.777483012739821 & 0.445033974520357 & 0.222516987260179 \tabularnewline
33 & 0.823964564409996 & 0.352070871180008 & 0.176035435590004 \tabularnewline
34 & 0.829116169466738 & 0.341767661066524 & 0.170883830533262 \tabularnewline
35 & 0.794411810432464 & 0.411176379135072 & 0.205588189567536 \tabularnewline
36 & 0.792821485571719 & 0.414357028856563 & 0.207178514428281 \tabularnewline
37 & 0.756847079511984 & 0.486305840976032 & 0.243152920488016 \tabularnewline
38 & 0.729492867355977 & 0.541014265288046 & 0.270507132644023 \tabularnewline
39 & 0.947476189392334 & 0.105047621215331 & 0.0525238106076655 \tabularnewline
40 & 0.98324292416078 & 0.0335141516784388 & 0.0167570758392194 \tabularnewline
41 & 0.99170507503121 & 0.0165898499375783 & 0.00829492496878915 \tabularnewline
42 & 0.987275537379944 & 0.0254489252401122 & 0.0127244626200561 \tabularnewline
43 & 0.97138694738591 & 0.0572261052281783 & 0.0286130526140892 \tabularnewline
44 & 0.93224036559679 & 0.135519268806418 & 0.067759634403209 \tabularnewline
\hline
\end{tabular}
%Source: https://freestatistics.org/blog/index.php?pk=25043&T=5

[TABLE]
[ROW][C]Goldfeld-Quandt test for Heteroskedasticity[/C][/ROW]
[ROW][C]p-values[/C][C]Alternative Hypothesis[/C][/ROW]
[ROW][C]breakpoint index[/C][C]greater[/C][C]2-sided[/C][C]less[/C][/ROW]
[ROW][C]17[/C][C]0.125131008341601[/C][C]0.250262016683202[/C][C]0.874868991658399[/C][/ROW]
[ROW][C]18[/C][C]0.0532848802573608[/C][C]0.106569760514722[/C][C]0.94671511974264[/C][/ROW]
[ROW][C]19[/C][C]0.0320590283852285[/C][C]0.064118056770457[/C][C]0.967940971614772[/C][/ROW]
[ROW][C]20[/C][C]0.0203248812122931[/C][C]0.0406497624245862[/C][C]0.979675118787707[/C][/ROW]
[ROW][C]21[/C][C]0.0110133722311301[/C][C]0.0220267444622602[/C][C]0.98898662776887[/C][/ROW]
[ROW][C]22[/C][C]0.00750864495267639[/C][C]0.0150172899053528[/C][C]0.992491355047324[/C][/ROW]
[ROW][C]23[/C][C]0.00484164523533906[/C][C]0.00968329047067812[/C][C]0.99515835476466[/C][/ROW]
[ROW][C]24[/C][C]0.00458386559867016[/C][C]0.00916773119734033[/C][C]0.99541613440133[/C][/ROW]
[ROW][C]25[/C][C]0.00807695457215038[/C][C]0.0161539091443008[/C][C]0.99192304542785[/C][/ROW]
[ROW][C]26[/C][C]0.0303602387543657[/C][C]0.0607204775087314[/C][C]0.969639761245634[/C][/ROW]
[ROW][C]27[/C][C]0.0543100420941383[/C][C]0.108620084188277[/C][C]0.945689957905862[/C][/ROW]
[ROW][C]28[/C][C]0.134557066133515[/C][C]0.269114132267030[/C][C]0.865442933866485[/C][/ROW]
[ROW][C]29[/C][C]0.203699224538986[/C][C]0.407398449077971[/C][C]0.796300775461015[/C][/ROW]
[ROW][C]30[/C][C]0.272866984099599[/C][C]0.545733968199198[/C][C]0.727133015900401[/C][/ROW]
[ROW][C]31[/C][C]0.548499181339544[/C][C]0.903001637320911[/C][C]0.451500818660456[/C][/ROW]
[ROW][C]32[/C][C]0.777483012739821[/C][C]0.445033974520357[/C][C]0.222516987260179[/C][/ROW]
[ROW][C]33[/C][C]0.823964564409996[/C][C]0.352070871180008[/C][C]0.176035435590004[/C][/ROW]
[ROW][C]34[/C][C]0.829116169466738[/C][C]0.341767661066524[/C][C]0.170883830533262[/C][/ROW]
[ROW][C]35[/C][C]0.794411810432464[/C][C]0.411176379135072[/C][C]0.205588189567536[/C][/ROW]
[ROW][C]36[/C][C]0.792821485571719[/C][C]0.414357028856563[/C][C]0.207178514428281[/C][/ROW]
[ROW][C]37[/C][C]0.756847079511984[/C][C]0.486305840976032[/C][C]0.243152920488016[/C][/ROW]
[ROW][C]38[/C][C]0.729492867355977[/C][C]0.541014265288046[/C][C]0.270507132644023[/C][/ROW]
[ROW][C]39[/C][C]0.947476189392334[/C][C]0.105047621215331[/C][C]0.0525238106076655[/C][/ROW]
[ROW][C]40[/C][C]0.98324292416078[/C][C]0.0335141516784388[/C][C]0.0167570758392194[/C][/ROW]
[ROW][C]41[/C][C]0.99170507503121[/C][C]0.0165898499375783[/C][C]0.00829492496878915[/C][/ROW]
[ROW][C]42[/C][C]0.987275537379944[/C][C]0.0254489252401122[/C][C]0.0127244626200561[/C][/ROW]
[ROW][C]43[/C][C]0.97138694738591[/C][C]0.0572261052281783[/C][C]0.0286130526140892[/C][/ROW]
[ROW][C]44[/C][C]0.93224036559679[/C][C]0.135519268806418[/C][C]0.067759634403209[/C][/ROW]
[/TABLE]
Source: https://freestatistics.org/blog/index.php?pk=25043&T=5

Globally Unique Identifier (entire table): ba.freestatistics.org/blog/index.php?pk=25043&T=5

As an alternative you can also use a QR Code:  

The GUIDs for individual cells are displayed in the table below:

Goldfeld-Quandt test for Heteroskedasticity
p-valuesAlternative Hypothesis
breakpoint indexgreater2-sidedless
170.1251310083416010.2502620166832020.874868991658399
180.05328488025736080.1065697605147220.94671511974264
190.03205902838522850.0641180567704570.967940971614772
200.02032488121229310.04064976242458620.979675118787707
210.01101337223113010.02202674446226020.98898662776887
220.007508644952676390.01501728990535280.992491355047324
230.004841645235339060.009683290470678120.99515835476466
240.004583865598670160.009167731197340330.99541613440133
250.008076954572150380.01615390914430080.99192304542785
260.03036023875436570.06072047750873140.969639761245634
270.05431004209413830.1086200841882770.945689957905862
280.1345570661335150.2691141322670300.865442933866485
290.2036992245389860.4073984490779710.796300775461015
300.2728669840995990.5457339681991980.727133015900401
310.5484991813395440.9030016373209110.451500818660456
320.7774830127398210.4450339745203570.222516987260179
330.8239645644099960.3520708711800080.176035435590004
340.8291161694667380.3417676610665240.170883830533262
350.7944118104324640.4111763791350720.205588189567536
360.7928214855717190.4143570288565630.207178514428281
370.7568470795119840.4863058409760320.243152920488016
380.7294928673559770.5410142652880460.270507132644023
390.9474761893923340.1050476212153310.0525238106076655
400.983242924160780.03351415167843880.0167570758392194
410.991705075031210.01658984993757830.00829492496878915
420.9872755373799440.02544892524011220.0127244626200561
430.971386947385910.05722610522817830.0286130526140892
440.932240365596790.1355192688064180.067759634403209


Meta Analysis of Goldfeld-Quandt test for Heteroskedasticity
Description# significant tests% significant testsOK/NOK
1% type I error level20.0714285714285714NOK
5% type I error level90.321428571428571NOK
10% type I error level120.428571428571429NOK

\begin{tabular}{lllllllll}
\hline
Meta Analysis of Goldfeld-Quandt test for Heteroskedasticity \tabularnewline
Description & # significant tests & % significant tests & OK/NOK \tabularnewline
1% type I error level & 2 & 0.0714285714285714 & NOK \tabularnewline
5% type I error level & 9 & 0.321428571428571 & NOK \tabularnewline
10% type I error level & 12 & 0.428571428571429 & NOK \tabularnewline
\hline
\end{tabular}
%Source: https://freestatistics.org/blog/index.php?pk=25043&T=6

[TABLE]
[ROW][C]Meta Analysis of Goldfeld-Quandt test for Heteroskedasticity[/C][/ROW]
[ROW][C]Description[/C][C]# significant tests[/C][C]% significant tests[/C][C]OK/NOK[/C][/ROW]
[ROW][C]1% type I error level[/C][C]2[/C][C]0.0714285714285714[/C][C]NOK[/C][/ROW]
[ROW][C]5% type I error level[/C][C]9[/C][C]0.321428571428571[/C][C]NOK[/C][/ROW]
[ROW][C]10% type I error level[/C][C]12[/C][C]0.428571428571429[/C][C]NOK[/C][/ROW]
[/TABLE]
Source: https://freestatistics.org/blog/index.php?pk=25043&T=6

Globally Unique Identifier (entire table): ba.freestatistics.org/blog/index.php?pk=25043&T=6

As an alternative you can also use a QR Code:  

The GUIDs for individual cells are displayed in the table below:

Meta Analysis of Goldfeld-Quandt test for Heteroskedasticity
Description# significant tests% significant testsOK/NOK
1% type I error level20.0714285714285714NOK
5% type I error level90.321428571428571NOK
10% type I error level120.428571428571429NOK


Parameters (Session):
par1 = 1 ; par2 = Include Monthly Dummies ; par3 = Linear Trend ;
Parameters (R input):
par1 = 1 ; par2 = Include Monthly Dummies ; par3 = Linear Trend ;
R code (references can be found in the software module):
library(lattice)
library(lmtest)
n25 <- 25 #minimum number of obs. for Goldfeld-Quandt test
par1 <- as.numeric(par1)
x <- t(y)
k <- length(x[1,])
n <- length(x[,1])
x1 <- cbind(x[,par1], x[,1:k!=par1])
mycolnames <- c(colnames(x)[par1], colnames(x)[1:k!=par1])
colnames(x1) <- mycolnames #colnames(x)[par1]
x <- x1
if (par3 == 'First Differences'){
x2 <- array(0, dim=c(n-1,k), dimnames=list(1:(n-1), paste('(1-B)',colnames(x),sep='')))
for (i in 1:n-1) {
for (j in 1:k) {
x2[i,j] <- x[i+1,j] - x[i,j]
}
}
x <- x2
}
if (par2 == 'Include Monthly Dummies'){
x2 <- array(0, dim=c(n,11), dimnames=list(1:n, paste('M', seq(1:11), sep ='')))
for (i in 1:11){
x2[seq(i,n,12),i] <- 1
}
x <- cbind(x, x2)
}
if (par2 == 'Include Quarterly Dummies'){
x2 <- array(0, dim=c(n,3), dimnames=list(1:n, paste('Q', seq(1:3), sep ='')))
for (i in 1:3){
x2[seq(i,n,4),i] <- 1
}
x <- cbind(x, x2)
}
k <- length(x[1,])
if (par3 == 'Linear Trend'){
x <- cbind(x, c(1:n))
colnames(x)[k+1] <- 't'
}
x
k <- length(x[1,])
df <- as.data.frame(x)
(mylm <- lm(df))
(mysum <- summary(mylm))
if (n > n25) {
kp3 <- k + 3
nmkm3 <- n - k - 3
gqarr <- array(NA, dim=c(nmkm3-kp3+1,3))
numgqtests <- 0
numsignificant1 <- 0
numsignificant5 <- 0
numsignificant10 <- 0
for (mypoint in kp3:nmkm3) {
j <- 0
numgqtests <- numgqtests + 1
for (myalt in c('greater', 'two.sided', 'less')) {
j <- j + 1
gqarr[mypoint-kp3+1,j] <- gqtest(mylm, point=mypoint, alternative=myalt)$p.value
}
if (gqarr[mypoint-kp3+1,2] < 0.01) numsignificant1 <- numsignificant1 + 1
if (gqarr[mypoint-kp3+1,2] < 0.05) numsignificant5 <- numsignificant5 + 1
if (gqarr[mypoint-kp3+1,2] < 0.10) numsignificant10 <- numsignificant10 + 1
}
gqarr
}
bitmap(file='test0.png')
plot(x[,1], type='l', main='Actuals and Interpolation', ylab='value of Actuals and Interpolation (dots)', xlab='time or index')
points(x[,1]-mysum$resid)
grid()
dev.off()
bitmap(file='test1.png')
plot(mysum$resid, type='b', pch=19, main='Residuals', ylab='value of Residuals', xlab='time or index')
grid()
dev.off()
bitmap(file='test2.png')
hist(mysum$resid, main='Residual Histogram', xlab='values of Residuals')
grid()
dev.off()
bitmap(file='test3.png')
densityplot(~mysum$resid,col='black',main='Residual Density Plot', xlab='values of Residuals')
dev.off()
bitmap(file='test4.png')
qqnorm(mysum$resid, main='Residual Normal Q-Q Plot')
qqline(mysum$resid)
grid()
dev.off()
(myerror <- as.ts(mysum$resid))
bitmap(file='test5.png')
dum <- cbind(lag(myerror,k=1),myerror)
dum
dum1 <- dum[2:length(myerror),]
dum1
z <- as.data.frame(dum1)
z
plot(z,main=paste('Residual Lag plot, lowess, and regression line'), ylab='values of Residuals', xlab='lagged values of Residuals')
lines(lowess(z))
abline(lm(z))
grid()
dev.off()
bitmap(file='test6.png')
acf(mysum$resid, lag.max=length(mysum$resid)/2, main='Residual Autocorrelation Function')
grid()
dev.off()
bitmap(file='test7.png')
pacf(mysum$resid, lag.max=length(mysum$resid)/2, main='Residual Partial Autocorrelation Function')
grid()
dev.off()
bitmap(file='test8.png')
opar <- par(mfrow = c(2,2), oma = c(0, 0, 1.1, 0))
plot(mylm, las = 1, sub='Residual Diagnostics')
par(opar)
dev.off()
if (n > n25) {
bitmap(file='test9.png')
plot(kp3:nmkm3,gqarr[,2], main='Goldfeld-Quandt test',ylab='2-sided p-value',xlab='breakpoint')
grid()
dev.off()
}
load(file='createtable')
a<-table.start()
a<-table.row.start(a)
a<-table.element(a, 'Multiple Linear Regression - Estimated Regression Equation', 1, TRUE)
a<-table.row.end(a)
myeq <- colnames(x)[1]
myeq <- paste(myeq, '[t] = ', sep='')
for (i in 1:k){
if (mysum$coefficients[i,1] > 0) myeq <- paste(myeq, '+', '')
myeq <- paste(myeq, mysum$coefficients[i,1], sep=' ')
if (rownames(mysum$coefficients)[i] != '(Intercept)') {
myeq <- paste(myeq, rownames(mysum$coefficients)[i], sep='')
if (rownames(mysum$coefficients)[i] != 't') myeq <- paste(myeq, '[t]', sep='')
}
}
myeq <- paste(myeq, ' + e[t]')
a<-table.row.start(a)
a<-table.element(a, myeq)
a<-table.row.end(a)
a<-table.end(a)
table.save(a,file='mytable1.tab')
a<-table.start()
a<-table.row.start(a)
a<-table.element(a,hyperlink('ols1.htm','Multiple Linear Regression - Ordinary Least Squares',''), 6, TRUE)
a<-table.row.end(a)
a<-table.row.start(a)
a<-table.element(a,'Variable',header=TRUE)
a<-table.element(a,'Parameter',header=TRUE)
a<-table.element(a,'S.D.',header=TRUE)
a<-table.element(a,'T-STAT
H0: parameter = 0',header=TRUE)
a<-table.element(a,'2-tail p-value',header=TRUE)
a<-table.element(a,'1-tail p-value',header=TRUE)
a<-table.row.end(a)
for (i in 1:k){
a<-table.row.start(a)
a<-table.element(a,rownames(mysum$coefficients)[i],header=TRUE)
a<-table.element(a,mysum$coefficients[i,1])
a<-table.element(a, round(mysum$coefficients[i,2],6))
a<-table.element(a, round(mysum$coefficients[i,3],4))
a<-table.element(a, round(mysum$coefficients[i,4],6))
a<-table.element(a, round(mysum$coefficients[i,4]/2,6))
a<-table.row.end(a)
}
a<-table.end(a)
table.save(a,file='mytable2.tab')
a<-table.start()
a<-table.row.start(a)
a<-table.element(a, 'Multiple Linear Regression - Regression Statistics', 2, TRUE)
a<-table.row.end(a)
a<-table.row.start(a)
a<-table.element(a, 'Multiple R',1,TRUE)
a<-table.element(a, sqrt(mysum$r.squared))
a<-table.row.end(a)
a<-table.row.start(a)
a<-table.element(a, 'R-squared',1,TRUE)
a<-table.element(a, mysum$r.squared)
a<-table.row.end(a)
a<-table.row.start(a)
a<-table.element(a, 'Adjusted R-squared',1,TRUE)
a<-table.element(a, mysum$adj.r.squared)
a<-table.row.end(a)
a<-table.row.start(a)
a<-table.element(a, 'F-TEST (value)',1,TRUE)
a<-table.element(a, mysum$fstatistic[1])
a<-table.row.end(a)
a<-table.row.start(a)
a<-table.element(a, 'F-TEST (DF numerator)',1,TRUE)
a<-table.element(a, mysum$fstatistic[2])
a<-table.row.end(a)
a<-table.row.start(a)
a<-table.element(a, 'F-TEST (DF denominator)',1,TRUE)
a<-table.element(a, mysum$fstatistic[3])
a<-table.row.end(a)
a<-table.row.start(a)
a<-table.element(a, 'p-value',1,TRUE)
a<-table.element(a, 1-pf(mysum$fstatistic[1],mysum$fstatistic[2],mysum$fstatistic[3]))
a<-table.row.end(a)
a<-table.row.start(a)
a<-table.element(a, 'Multiple Linear Regression - Residual Statistics', 2, TRUE)
a<-table.row.end(a)
a<-table.row.start(a)
a<-table.element(a, 'Residual Standard Deviation',1,TRUE)
a<-table.element(a, mysum$sigma)
a<-table.row.end(a)
a<-table.row.start(a)
a<-table.element(a, 'Sum Squared Residuals',1,TRUE)
a<-table.element(a, sum(myerror*myerror))
a<-table.row.end(a)
a<-table.end(a)
table.save(a,file='mytable3.tab')
a<-table.start()
a<-table.row.start(a)
a<-table.element(a, 'Multiple Linear Regression - Actuals, Interpolation, and Residuals', 4, TRUE)
a<-table.row.end(a)
a<-table.row.start(a)
a<-table.element(a, 'Time or Index', 1, TRUE)
a<-table.element(a, 'Actuals', 1, TRUE)
a<-table.element(a, 'Interpolation
Forecast', 1, TRUE)
a<-table.element(a, 'Residuals
Prediction Error', 1, TRUE)
a<-table.row.end(a)
for (i in 1:n) {
a<-table.row.start(a)
a<-table.element(a,i, 1, TRUE)
a<-table.element(a,x[i])
a<-table.element(a,x[i]-mysum$resid[i])
a<-table.element(a,mysum$resid[i])
a<-table.row.end(a)
}
a<-table.end(a)
table.save(a,file='mytable4.tab')
if (n > n25) {
a<-table.start()
a<-table.row.start(a)
a<-table.element(a,'Goldfeld-Quandt test for Heteroskedasticity',4,TRUE)
a<-table.row.end(a)
a<-table.row.start(a)
a<-table.element(a,'p-values',header=TRUE)
a<-table.element(a,'Alternative Hypothesis',3,header=TRUE)
a<-table.row.end(a)
a<-table.row.start(a)
a<-table.element(a,'breakpoint index',header=TRUE)
a<-table.element(a,'greater',header=TRUE)
a<-table.element(a,'2-sided',header=TRUE)
a<-table.element(a,'less',header=TRUE)
a<-table.row.end(a)
for (mypoint in kp3:nmkm3) {
a<-table.row.start(a)
a<-table.element(a,mypoint,header=TRUE)
a<-table.element(a,gqarr[mypoint-kp3+1,1])
a<-table.element(a,gqarr[mypoint-kp3+1,2])
a<-table.element(a,gqarr[mypoint-kp3+1,3])
a<-table.row.end(a)
}
a<-table.end(a)
table.save(a,file='mytable5.tab')
a<-table.start()
a<-table.row.start(a)
a<-table.element(a,'Meta Analysis of Goldfeld-Quandt test for Heteroskedasticity',4,TRUE)
a<-table.row.end(a)
a<-table.row.start(a)
a<-table.element(a,'Description',header=TRUE)
a<-table.element(a,'# significant tests',header=TRUE)
a<-table.element(a,'% significant tests',header=TRUE)
a<-table.element(a,'OK/NOK',header=TRUE)
a<-table.row.end(a)
a<-table.row.start(a)
a<-table.element(a,'1% type I error level',header=TRUE)
a<-table.element(a,numsignificant1)
a<-table.element(a,numsignificant1/numgqtests)
if (numsignificant1/numgqtests < 0.01) dum <- 'OK' else dum <- 'NOK'
a<-table.element(a,dum)
a<-table.row.end(a)
a<-table.row.start(a)
a<-table.element(a,'5% type I error level',header=TRUE)
a<-table.element(a,numsignificant5)
a<-table.element(a,numsignificant5/numgqtests)
if (numsignificant5/numgqtests < 0.05) dum <- 'OK' else dum <- 'NOK'
a<-table.element(a,dum)
a<-table.row.end(a)
a<-table.row.start(a)
a<-table.element(a,'10% type I error level',header=TRUE)
a<-table.element(a,numsignificant10)
a<-table.element(a,numsignificant10/numgqtests)
if (numsignificant10/numgqtests < 0.1) dum <- 'OK' else dum <- 'NOK'
a<-table.element(a,dum)
a<-table.row.end(a)
a<-table.end(a)
table.save(a,file='mytable6.tab')
}