Free Statistics

of Irreproducible Research!

Author's title

Author*The author of this computation has been verified*
R Software Modulerwasp_multipleregression.wasp
Title produced by softwareMultiple Regression
Date of computationThu, 27 Nov 2008 07:02:01 -0700
Cite this page as followsStatistical Computations at FreeStatistics.org, Office for Research Development and Education, URL https://freestatistics.org/blog/index.php?v=date/2008/Nov/27/t12277945924fi94gq6fqbcxjl.htm/, Retrieved Sun, 19 May 2024 07:20:29 +0000
Statistical Computations at FreeStatistics.org, Office for Research Development and Education, URL https://freestatistics.org/blog/index.php?pk=25812, Retrieved Sun, 19 May 2024 07:20:29 +0000
QR Codes:

Original text written by user:
IsPrivate?No (this computation is public)
User-defined keywordsJonas Scheltjens
Estimated Impact180
Family? (F = Feedback message, R = changed R code, M = changed R Module, P = changed Parameters, D = changed Data)
F     [Multiple Regression] [Seatbelt law - Q3(1)] [2008-11-27 08:39:11] [74be16979710d4c4e7c6647856088456]
F    D    [Multiple Regression] [Seatbelt Law Q3 z...] [2008-11-27 14:02:01] [f4960a11bac8b7f1cb71c83b5826d5bd] [Current]
Feedback Forum
2008-11-28 12:28:56 [Julie Govaerts] [reply
het was de bedoeling van wel een seasonal dummy te kiezen en met een lineaire trend!
bv ik had --> time series = over de werkloosheid in bepaalde activiteitstakken tussen januari 2003 en december 2007

Y variabele = de werkloosheid in de tabakssector

Dummy variabele = de laatste jaren is er een sterker verbod op roken bv in restaurants (januari 2007)  meer mensen zullen stoppen

0 = nog geen verbod
1 = wel verbod
2008-11-28 12:30:15 [Julie Govaerts] [reply
en dus alles gelijk bij de vorige vraag uitleggen en toepassen op jouw gegevens , inclusief de grafieken en de assumpties testen
2008-11-30 21:16:34 [Gilliam Schoorel] [reply
De 3e vraag ziet er ook goed en volledig uitgewerkt uit. De conclusies zijn terug zeer goed, maar ik vraag me af hoe je juist je dummies hebt bepaalt?
Dummy = 1 moet staan voor een gebeurtenis, bijvoorbeeld het invoeren van een wet;
Ik vraag me eerlijk gezegd af welke gebeurtenis er dan zich dan juist heeft voorgedaan op dat tijdstip? Voor de rest zeer goed opgelost. De algemene conclusie is misschien wat vaag.
2008-12-01 16:53:37 [b5935c41f1031f8c061510fc5ad27e97] [reply
Q3 : de berekeningen zijn juist maar er moest een seasonal dummy met een lineair trend gekozen worden , de conclusies zijn onduidelijk en er is een aantal niet verklaarde schommelingen.

Post a new message
Dataseries X:
101,2	0
100,5	0
98	0
106,6	0
90,1	0
96,9	0
125,9	0
112	0
100	0
123,9	0
79,8	0
83,4	0
113,6	0
112,9	0
104	0
109,9	0
99	0
106,3	0
128,9	0
111,1	0
102,9	0
130	0
87	0
87,5	0
117,6	0
103,4	0
110,8	0
112,6	0
102,5	0
112,4	0
135,6	0
105,1	0
127,7	0
137	0
91	0
90,5	0
122,4	1
123,3	1
124,3	1
120	1
118,1	1
119	1
142,7	1
123,6	1
129,6	1
151,6	1
110,4	1
99,2	1
130,5	1
136,2	1
129,7	1
128	1
121,6	1
135,8	1
143,8	1
147,5	1
136,2	1
156,6	1
123,3	1
100,4	1


Summary of computational transaction
Raw Inputview raw input (R code)
Raw Outputview raw output of R engine
Computing time7 seconds
R Server'Herman Ole Andreas Wold' @ 193.190.124.10:1001

\begin{tabular}{lllllllll}
\hline
Summary of computational transaction \tabularnewline
Raw Input & view raw input (R code)  \tabularnewline
Raw Output & view raw output of R engine  \tabularnewline
Computing time & 7 seconds \tabularnewline
R Server & 'Herman Ole Andreas Wold' @ 193.190.124.10:1001 \tabularnewline
\hline
\end{tabular}
%Source: https://freestatistics.org/blog/index.php?pk=25812&T=0

[TABLE]
[ROW][C]Summary of computational transaction[/C][/ROW]
[ROW][C]Raw Input[/C][C]view raw input (R code) [/C][/ROW]
[ROW][C]Raw Output[/C][C]view raw output of R engine [/C][/ROW]
[ROW][C]Computing time[/C][C]7 seconds[/C][/ROW]
[ROW][C]R Server[/C][C]'Herman Ole Andreas Wold' @ 193.190.124.10:1001[/C][/ROW]
[/TABLE]
Source: https://freestatistics.org/blog/index.php?pk=25812&T=0

Globally Unique Identifier (entire table): ba.freestatistics.org/blog/index.php?pk=25812&T=0

As an alternative you can also use a QR Code:  

The GUIDs for individual cells are displayed in the table below:

Summary of computational transaction
Raw Inputview raw input (R code)
Raw Outputview raw output of R engine
Computing time7 seconds
R Server'Herman Ole Andreas Wold' @ 193.190.124.10:1001


Multiple Linear Regression - Estimated Regression Equation
y[t] = + 107.155555555556 + 20.9194444444444x[t] + e[t]

\begin{tabular}{lllllllll}
\hline
Multiple Linear Regression - Estimated Regression Equation \tabularnewline
y[t] =  +  107.155555555556 +  20.9194444444444x[t]  + e[t] \tabularnewline
\hline
\end{tabular}
%Source: https://freestatistics.org/blog/index.php?pk=25812&T=1

[TABLE]
[ROW][C]Multiple Linear Regression - Estimated Regression Equation[/C][/ROW]
[ROW][C]y[t] =  +  107.155555555556 +  20.9194444444444x[t]  + e[t][/C][/ROW]
[/TABLE]
Source: https://freestatistics.org/blog/index.php?pk=25812&T=1

Globally Unique Identifier (entire table): ba.freestatistics.org/blog/index.php?pk=25812&T=1

As an alternative you can also use a QR Code:  

The GUIDs for individual cells are displayed in the table below:

Multiple Linear Regression - Estimated Regression Equation
y[t] = + 107.155555555556 + 20.9194444444444x[t] + e[t]


Multiple Linear Regression - Ordinary Least Squares
VariableParameterS.D.T-STATH0: parameter = 02-tail p-value1-tail p-value
(Intercept)107.1555555555562.41327744.402500
x20.91944444444443.8157265.48241e-060

\begin{tabular}{lllllllll}
\hline
Multiple Linear Regression - Ordinary Least Squares \tabularnewline
Variable & Parameter & S.D. & T-STATH0: parameter = 0 & 2-tail p-value & 1-tail p-value \tabularnewline
(Intercept) & 107.155555555556 & 2.413277 & 44.4025 & 0 & 0 \tabularnewline
x & 20.9194444444444 & 3.815726 & 5.4824 & 1e-06 & 0 \tabularnewline
\hline
\end{tabular}
%Source: https://freestatistics.org/blog/index.php?pk=25812&T=2

[TABLE]
[ROW][C]Multiple Linear Regression - Ordinary Least Squares[/C][/ROW]
[ROW][C]Variable[/C][C]Parameter[/C][C]S.D.[/C][C]T-STATH0: parameter = 0[/C][C]2-tail p-value[/C][C]1-tail p-value[/C][/ROW]
[ROW][C](Intercept)[/C][C]107.155555555556[/C][C]2.413277[/C][C]44.4025[/C][C]0[/C][C]0[/C][/ROW]
[ROW][C]x[/C][C]20.9194444444444[/C][C]3.815726[/C][C]5.4824[/C][C]1e-06[/C][C]0[/C][/ROW]
[/TABLE]
Source: https://freestatistics.org/blog/index.php?pk=25812&T=2

Globally Unique Identifier (entire table): ba.freestatistics.org/blog/index.php?pk=25812&T=2

As an alternative you can also use a QR Code:  

The GUIDs for individual cells are displayed in the table below:

Multiple Linear Regression - Ordinary Least Squares
VariableParameterS.D.T-STATH0: parameter = 02-tail p-value1-tail p-value
(Intercept)107.1555555555562.41327744.402500
x20.91944444444443.8157265.48241e-060


Multiple Linear Regression - Regression Statistics
Multiple R0.584239602789588
R-squared0.341335913467735
Adjusted R-squared0.329979636113731
F-TEST (value)30.0570250996353
F-TEST (DF numerator)1
F-TEST (DF denominator)58
p-value9.54988062518147e-07
Multiple Linear Regression - Residual Statistics
Residual Standard Deviation14.4796610558116
Sum Squared Residuals12160.3138888889

\begin{tabular}{lllllllll}
\hline
Multiple Linear Regression - Regression Statistics \tabularnewline
Multiple R & 0.584239602789588 \tabularnewline
R-squared & 0.341335913467735 \tabularnewline
Adjusted R-squared & 0.329979636113731 \tabularnewline
F-TEST (value) & 30.0570250996353 \tabularnewline
F-TEST (DF numerator) & 1 \tabularnewline
F-TEST (DF denominator) & 58 \tabularnewline
p-value & 9.54988062518147e-07 \tabularnewline
Multiple Linear Regression - Residual Statistics \tabularnewline
Residual Standard Deviation & 14.4796610558116 \tabularnewline
Sum Squared Residuals & 12160.3138888889 \tabularnewline
\hline
\end{tabular}
%Source: https://freestatistics.org/blog/index.php?pk=25812&T=3

[TABLE]
[ROW][C]Multiple Linear Regression - Regression Statistics[/C][/ROW]
[ROW][C]Multiple R[/C][C]0.584239602789588[/C][/ROW]
[ROW][C]R-squared[/C][C]0.341335913467735[/C][/ROW]
[ROW][C]Adjusted R-squared[/C][C]0.329979636113731[/C][/ROW]
[ROW][C]F-TEST (value)[/C][C]30.0570250996353[/C][/ROW]
[ROW][C]F-TEST (DF numerator)[/C][C]1[/C][/ROW]
[ROW][C]F-TEST (DF denominator)[/C][C]58[/C][/ROW]
[ROW][C]p-value[/C][C]9.54988062518147e-07[/C][/ROW]
[ROW][C]Multiple Linear Regression - Residual Statistics[/C][/ROW]
[ROW][C]Residual Standard Deviation[/C][C]14.4796610558116[/C][/ROW]
[ROW][C]Sum Squared Residuals[/C][C]12160.3138888889[/C][/ROW]
[/TABLE]
Source: https://freestatistics.org/blog/index.php?pk=25812&T=3

Globally Unique Identifier (entire table): ba.freestatistics.org/blog/index.php?pk=25812&T=3

As an alternative you can also use a QR Code:  

The GUIDs for individual cells are displayed in the table below:

Multiple Linear Regression - Regression Statistics
Multiple R0.584239602789588
R-squared0.341335913467735
Adjusted R-squared0.329979636113731
F-TEST (value)30.0570250996353
F-TEST (DF numerator)1
F-TEST (DF denominator)58
p-value9.54988062518147e-07
Multiple Linear Regression - Residual Statistics
Residual Standard Deviation14.4796610558116
Sum Squared Residuals12160.3138888889


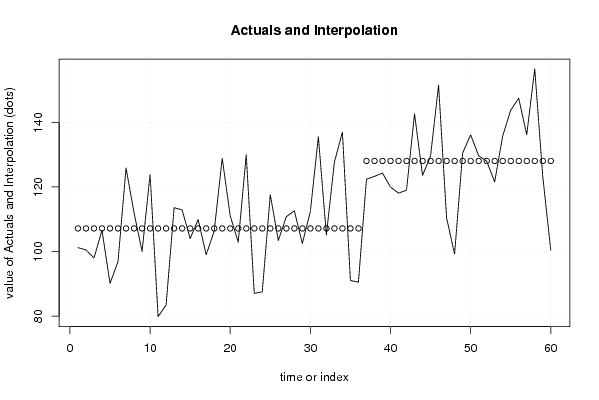
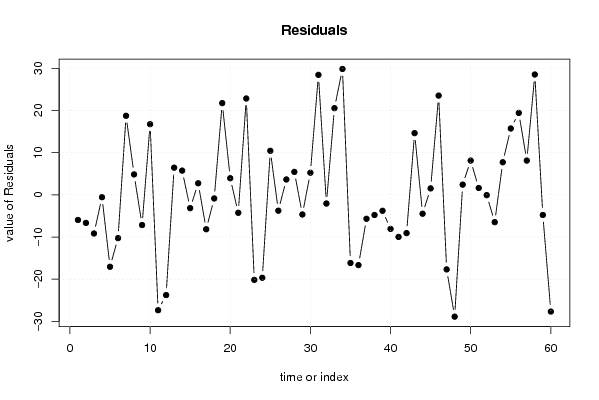
Multiple Linear Regression - Actuals, Interpolation, and Residuals
Time or IndexActualsInterpolationForecastResidualsPrediction Error
1101.2107.155555555556-5.95555555555566
2100.5107.155555555556-6.65555555555556
398107.155555555556-9.15555555555555
4106.6107.155555555556-0.555555555555558
590.1107.155555555556-17.0555555555556
696.9107.155555555556-10.2555555555555
7125.9107.15555555555618.7444444444445
8112107.1555555555564.84444444444445
9100107.155555555556-7.15555555555555
10123.9107.15555555555616.7444444444445
1179.8107.155555555556-27.3555555555556
1283.4107.155555555556-23.7555555555555
13113.6107.1555555555566.44444444444444
14112.9107.1555555555565.74444444444445
15104107.155555555556-3.15555555555555
16109.9107.1555555555562.74444444444445
1799107.155555555556-8.15555555555555
18106.3107.155555555556-0.855555555555555
19128.9107.15555555555621.7444444444445
20111.1107.1555555555563.94444444444444
21102.9107.155555555556-4.25555555555555
22130107.15555555555622.8444444444444
2387107.155555555556-20.1555555555556
2487.5107.155555555556-19.6555555555556
25117.6107.15555555555610.4444444444444
26103.4107.155555555556-3.75555555555555
27110.8107.1555555555563.64444444444444
28112.6107.1555555555565.44444444444444
29102.5107.155555555556-4.65555555555555
30112.4107.1555555555565.24444444444445
31135.6107.15555555555628.4444444444444
32105.1107.155555555556-2.05555555555556
33127.7107.15555555555620.5444444444445
34137107.15555555555629.8444444444444
3591107.155555555556-16.1555555555556
3690.5107.155555555556-16.6555555555556
37122.4128.075-5.67499999999999
38123.3128.075-4.775
39124.3128.075-3.775
40120128.075-8.075
41118.1128.075-9.975
42119128.075-9.075
43142.7128.07514.625
44123.6128.075-4.475
45129.6128.0751.52500000000000
46151.6128.07523.525
47110.4128.075-17.675
4899.2128.075-28.875
49130.5128.0752.42500000000000
50136.2128.0758.12499999999999
51129.7128.0751.62499999999999
52128128.075-0.0749999999999977
53121.6128.075-6.475
54135.8128.0757.72500000000001
55143.8128.07515.725
56147.5128.07519.425
57136.2128.0758.12499999999999
58156.6128.07528.525
59123.3128.075-4.775
60100.4128.075-27.675

\begin{tabular}{lllllllll}
\hline
Multiple Linear Regression - Actuals, Interpolation, and Residuals \tabularnewline
Time or Index & Actuals & InterpolationForecast & ResidualsPrediction Error \tabularnewline
1 & 101.2 & 107.155555555556 & -5.95555555555566 \tabularnewline
2 & 100.5 & 107.155555555556 & -6.65555555555556 \tabularnewline
3 & 98 & 107.155555555556 & -9.15555555555555 \tabularnewline
4 & 106.6 & 107.155555555556 & -0.555555555555558 \tabularnewline
5 & 90.1 & 107.155555555556 & -17.0555555555556 \tabularnewline
6 & 96.9 & 107.155555555556 & -10.2555555555555 \tabularnewline
7 & 125.9 & 107.155555555556 & 18.7444444444445 \tabularnewline
8 & 112 & 107.155555555556 & 4.84444444444445 \tabularnewline
9 & 100 & 107.155555555556 & -7.15555555555555 \tabularnewline
10 & 123.9 & 107.155555555556 & 16.7444444444445 \tabularnewline
11 & 79.8 & 107.155555555556 & -27.3555555555556 \tabularnewline
12 & 83.4 & 107.155555555556 & -23.7555555555555 \tabularnewline
13 & 113.6 & 107.155555555556 & 6.44444444444444 \tabularnewline
14 & 112.9 & 107.155555555556 & 5.74444444444445 \tabularnewline
15 & 104 & 107.155555555556 & -3.15555555555555 \tabularnewline
16 & 109.9 & 107.155555555556 & 2.74444444444445 \tabularnewline
17 & 99 & 107.155555555556 & -8.15555555555555 \tabularnewline
18 & 106.3 & 107.155555555556 & -0.855555555555555 \tabularnewline
19 & 128.9 & 107.155555555556 & 21.7444444444445 \tabularnewline
20 & 111.1 & 107.155555555556 & 3.94444444444444 \tabularnewline
21 & 102.9 & 107.155555555556 & -4.25555555555555 \tabularnewline
22 & 130 & 107.155555555556 & 22.8444444444444 \tabularnewline
23 & 87 & 107.155555555556 & -20.1555555555556 \tabularnewline
24 & 87.5 & 107.155555555556 & -19.6555555555556 \tabularnewline
25 & 117.6 & 107.155555555556 & 10.4444444444444 \tabularnewline
26 & 103.4 & 107.155555555556 & -3.75555555555555 \tabularnewline
27 & 110.8 & 107.155555555556 & 3.64444444444444 \tabularnewline
28 & 112.6 & 107.155555555556 & 5.44444444444444 \tabularnewline
29 & 102.5 & 107.155555555556 & -4.65555555555555 \tabularnewline
30 & 112.4 & 107.155555555556 & 5.24444444444445 \tabularnewline
31 & 135.6 & 107.155555555556 & 28.4444444444444 \tabularnewline
32 & 105.1 & 107.155555555556 & -2.05555555555556 \tabularnewline
33 & 127.7 & 107.155555555556 & 20.5444444444445 \tabularnewline
34 & 137 & 107.155555555556 & 29.8444444444444 \tabularnewline
35 & 91 & 107.155555555556 & -16.1555555555556 \tabularnewline
36 & 90.5 & 107.155555555556 & -16.6555555555556 \tabularnewline
37 & 122.4 & 128.075 & -5.67499999999999 \tabularnewline
38 & 123.3 & 128.075 & -4.775 \tabularnewline
39 & 124.3 & 128.075 & -3.775 \tabularnewline
40 & 120 & 128.075 & -8.075 \tabularnewline
41 & 118.1 & 128.075 & -9.975 \tabularnewline
42 & 119 & 128.075 & -9.075 \tabularnewline
43 & 142.7 & 128.075 & 14.625 \tabularnewline
44 & 123.6 & 128.075 & -4.475 \tabularnewline
45 & 129.6 & 128.075 & 1.52500000000000 \tabularnewline
46 & 151.6 & 128.075 & 23.525 \tabularnewline
47 & 110.4 & 128.075 & -17.675 \tabularnewline
48 & 99.2 & 128.075 & -28.875 \tabularnewline
49 & 130.5 & 128.075 & 2.42500000000000 \tabularnewline
50 & 136.2 & 128.075 & 8.12499999999999 \tabularnewline
51 & 129.7 & 128.075 & 1.62499999999999 \tabularnewline
52 & 128 & 128.075 & -0.0749999999999977 \tabularnewline
53 & 121.6 & 128.075 & -6.475 \tabularnewline
54 & 135.8 & 128.075 & 7.72500000000001 \tabularnewline
55 & 143.8 & 128.075 & 15.725 \tabularnewline
56 & 147.5 & 128.075 & 19.425 \tabularnewline
57 & 136.2 & 128.075 & 8.12499999999999 \tabularnewline
58 & 156.6 & 128.075 & 28.525 \tabularnewline
59 & 123.3 & 128.075 & -4.775 \tabularnewline
60 & 100.4 & 128.075 & -27.675 \tabularnewline
\hline
\end{tabular}
%Source: https://freestatistics.org/blog/index.php?pk=25812&T=4

[TABLE]
[ROW][C]Multiple Linear Regression - Actuals, Interpolation, and Residuals[/C][/ROW]
[ROW][C]Time or Index[/C][C]Actuals[/C][C]InterpolationForecast[/C][C]ResidualsPrediction Error[/C][/ROW]
[ROW][C]1[/C][C]101.2[/C][C]107.155555555556[/C][C]-5.95555555555566[/C][/ROW]
[ROW][C]2[/C][C]100.5[/C][C]107.155555555556[/C][C]-6.65555555555556[/C][/ROW]
[ROW][C]3[/C][C]98[/C][C]107.155555555556[/C][C]-9.15555555555555[/C][/ROW]
[ROW][C]4[/C][C]106.6[/C][C]107.155555555556[/C][C]-0.555555555555558[/C][/ROW]
[ROW][C]5[/C][C]90.1[/C][C]107.155555555556[/C][C]-17.0555555555556[/C][/ROW]
[ROW][C]6[/C][C]96.9[/C][C]107.155555555556[/C][C]-10.2555555555555[/C][/ROW]
[ROW][C]7[/C][C]125.9[/C][C]107.155555555556[/C][C]18.7444444444445[/C][/ROW]
[ROW][C]8[/C][C]112[/C][C]107.155555555556[/C][C]4.84444444444445[/C][/ROW]
[ROW][C]9[/C][C]100[/C][C]107.155555555556[/C][C]-7.15555555555555[/C][/ROW]
[ROW][C]10[/C][C]123.9[/C][C]107.155555555556[/C][C]16.7444444444445[/C][/ROW]
[ROW][C]11[/C][C]79.8[/C][C]107.155555555556[/C][C]-27.3555555555556[/C][/ROW]
[ROW][C]12[/C][C]83.4[/C][C]107.155555555556[/C][C]-23.7555555555555[/C][/ROW]
[ROW][C]13[/C][C]113.6[/C][C]107.155555555556[/C][C]6.44444444444444[/C][/ROW]
[ROW][C]14[/C][C]112.9[/C][C]107.155555555556[/C][C]5.74444444444445[/C][/ROW]
[ROW][C]15[/C][C]104[/C][C]107.155555555556[/C][C]-3.15555555555555[/C][/ROW]
[ROW][C]16[/C][C]109.9[/C][C]107.155555555556[/C][C]2.74444444444445[/C][/ROW]
[ROW][C]17[/C][C]99[/C][C]107.155555555556[/C][C]-8.15555555555555[/C][/ROW]
[ROW][C]18[/C][C]106.3[/C][C]107.155555555556[/C][C]-0.855555555555555[/C][/ROW]
[ROW][C]19[/C][C]128.9[/C][C]107.155555555556[/C][C]21.7444444444445[/C][/ROW]
[ROW][C]20[/C][C]111.1[/C][C]107.155555555556[/C][C]3.94444444444444[/C][/ROW]
[ROW][C]21[/C][C]102.9[/C][C]107.155555555556[/C][C]-4.25555555555555[/C][/ROW]
[ROW][C]22[/C][C]130[/C][C]107.155555555556[/C][C]22.8444444444444[/C][/ROW]
[ROW][C]23[/C][C]87[/C][C]107.155555555556[/C][C]-20.1555555555556[/C][/ROW]
[ROW][C]24[/C][C]87.5[/C][C]107.155555555556[/C][C]-19.6555555555556[/C][/ROW]
[ROW][C]25[/C][C]117.6[/C][C]107.155555555556[/C][C]10.4444444444444[/C][/ROW]
[ROW][C]26[/C][C]103.4[/C][C]107.155555555556[/C][C]-3.75555555555555[/C][/ROW]
[ROW][C]27[/C][C]110.8[/C][C]107.155555555556[/C][C]3.64444444444444[/C][/ROW]
[ROW][C]28[/C][C]112.6[/C][C]107.155555555556[/C][C]5.44444444444444[/C][/ROW]
[ROW][C]29[/C][C]102.5[/C][C]107.155555555556[/C][C]-4.65555555555555[/C][/ROW]
[ROW][C]30[/C][C]112.4[/C][C]107.155555555556[/C][C]5.24444444444445[/C][/ROW]
[ROW][C]31[/C][C]135.6[/C][C]107.155555555556[/C][C]28.4444444444444[/C][/ROW]
[ROW][C]32[/C][C]105.1[/C][C]107.155555555556[/C][C]-2.05555555555556[/C][/ROW]
[ROW][C]33[/C][C]127.7[/C][C]107.155555555556[/C][C]20.5444444444445[/C][/ROW]
[ROW][C]34[/C][C]137[/C][C]107.155555555556[/C][C]29.8444444444444[/C][/ROW]
[ROW][C]35[/C][C]91[/C][C]107.155555555556[/C][C]-16.1555555555556[/C][/ROW]
[ROW][C]36[/C][C]90.5[/C][C]107.155555555556[/C][C]-16.6555555555556[/C][/ROW]
[ROW][C]37[/C][C]122.4[/C][C]128.075[/C][C]-5.67499999999999[/C][/ROW]
[ROW][C]38[/C][C]123.3[/C][C]128.075[/C][C]-4.775[/C][/ROW]
[ROW][C]39[/C][C]124.3[/C][C]128.075[/C][C]-3.775[/C][/ROW]
[ROW][C]40[/C][C]120[/C][C]128.075[/C][C]-8.075[/C][/ROW]
[ROW][C]41[/C][C]118.1[/C][C]128.075[/C][C]-9.975[/C][/ROW]
[ROW][C]42[/C][C]119[/C][C]128.075[/C][C]-9.075[/C][/ROW]
[ROW][C]43[/C][C]142.7[/C][C]128.075[/C][C]14.625[/C][/ROW]
[ROW][C]44[/C][C]123.6[/C][C]128.075[/C][C]-4.475[/C][/ROW]
[ROW][C]45[/C][C]129.6[/C][C]128.075[/C][C]1.52500000000000[/C][/ROW]
[ROW][C]46[/C][C]151.6[/C][C]128.075[/C][C]23.525[/C][/ROW]
[ROW][C]47[/C][C]110.4[/C][C]128.075[/C][C]-17.675[/C][/ROW]
[ROW][C]48[/C][C]99.2[/C][C]128.075[/C][C]-28.875[/C][/ROW]
[ROW][C]49[/C][C]130.5[/C][C]128.075[/C][C]2.42500000000000[/C][/ROW]
[ROW][C]50[/C][C]136.2[/C][C]128.075[/C][C]8.12499999999999[/C][/ROW]
[ROW][C]51[/C][C]129.7[/C][C]128.075[/C][C]1.62499999999999[/C][/ROW]
[ROW][C]52[/C][C]128[/C][C]128.075[/C][C]-0.0749999999999977[/C][/ROW]
[ROW][C]53[/C][C]121.6[/C][C]128.075[/C][C]-6.475[/C][/ROW]
[ROW][C]54[/C][C]135.8[/C][C]128.075[/C][C]7.72500000000001[/C][/ROW]
[ROW][C]55[/C][C]143.8[/C][C]128.075[/C][C]15.725[/C][/ROW]
[ROW][C]56[/C][C]147.5[/C][C]128.075[/C][C]19.425[/C][/ROW]
[ROW][C]57[/C][C]136.2[/C][C]128.075[/C][C]8.12499999999999[/C][/ROW]
[ROW][C]58[/C][C]156.6[/C][C]128.075[/C][C]28.525[/C][/ROW]
[ROW][C]59[/C][C]123.3[/C][C]128.075[/C][C]-4.775[/C][/ROW]
[ROW][C]60[/C][C]100.4[/C][C]128.075[/C][C]-27.675[/C][/ROW]
[/TABLE]
Source: https://freestatistics.org/blog/index.php?pk=25812&T=4

Globally Unique Identifier (entire table): ba.freestatistics.org/blog/index.php?pk=25812&T=4

As an alternative you can also use a QR Code:  

The GUIDs for individual cells are displayed in the table below:

Multiple Linear Regression - Actuals, Interpolation, and Residuals
Time or IndexActualsInterpolationForecastResidualsPrediction Error
1101.2107.155555555556-5.95555555555566
2100.5107.155555555556-6.65555555555556
398107.155555555556-9.15555555555555
4106.6107.155555555556-0.555555555555558
590.1107.155555555556-17.0555555555556
696.9107.155555555556-10.2555555555555
7125.9107.15555555555618.7444444444445
8112107.1555555555564.84444444444445
9100107.155555555556-7.15555555555555
10123.9107.15555555555616.7444444444445
1179.8107.155555555556-27.3555555555556
1283.4107.155555555556-23.7555555555555
13113.6107.1555555555566.44444444444444
14112.9107.1555555555565.74444444444445
15104107.155555555556-3.15555555555555
16109.9107.1555555555562.74444444444445
1799107.155555555556-8.15555555555555
18106.3107.155555555556-0.855555555555555
19128.9107.15555555555621.7444444444445
20111.1107.1555555555563.94444444444444
21102.9107.155555555556-4.25555555555555
22130107.15555555555622.8444444444444
2387107.155555555556-20.1555555555556
2487.5107.155555555556-19.6555555555556
25117.6107.15555555555610.4444444444444
26103.4107.155555555556-3.75555555555555
27110.8107.1555555555563.64444444444444
28112.6107.1555555555565.44444444444444
29102.5107.155555555556-4.65555555555555
30112.4107.1555555555565.24444444444445
31135.6107.15555555555628.4444444444444
32105.1107.155555555556-2.05555555555556
33127.7107.15555555555620.5444444444445
34137107.15555555555629.8444444444444
3591107.155555555556-16.1555555555556
3690.5107.155555555556-16.6555555555556
37122.4128.075-5.67499999999999
38123.3128.075-4.775
39124.3128.075-3.775
40120128.075-8.075
41118.1128.075-9.975
42119128.075-9.075
43142.7128.07514.625
44123.6128.075-4.475
45129.6128.0751.52500000000000
46151.6128.07523.525
47110.4128.075-17.675
4899.2128.075-28.875
49130.5128.0752.42500000000000
50136.2128.0758.12499999999999
51129.7128.0751.62499999999999
52128128.075-0.0749999999999977
53121.6128.075-6.475
54135.8128.0757.72500000000001
55143.8128.07515.725
56147.5128.07519.425
57136.2128.0758.12499999999999
58156.6128.07528.525
59123.3128.075-4.775
60100.4128.075-27.675


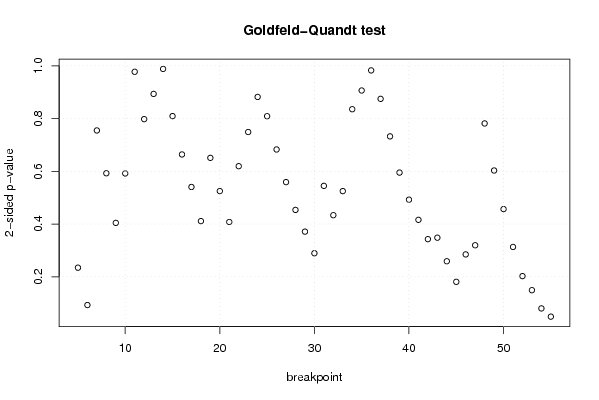
Goldfeld-Quandt test for Heteroskedasticity
p-valuesAlternative Hypothesis
breakpoint indexgreater2-sidedless
50.1174071296989140.2348142593978280.882592870301086
60.0465719633506520.0931439267013040.953428036649348
70.3775449664842900.7550899329685790.62245503351571
80.296367727404740.592735454809480.70363227259526
90.2023441865646440.4046883731292890.797655813435356
100.2960278508800950.592055701760190.703972149119905
110.5112370808199310.9775258383601390.488762919180069
120.6010681116865960.7978637766268080.398931888313404
130.55321270292960.89357459414080.4467872970704
140.4941052780614380.9882105561228750.505894721938562
150.4047380683249910.8094761366499820.595261931675009
160.332037936587010.664075873174020.66796206341299
170.2704008719228960.5408017438457920.729599128077104
180.2057210534430780.4114421068861560.794278946556922
190.3255669370726030.6511338741452060.674433062927397
200.2626360996210580.5252721992421160.737363900378942
210.2040675412974990.4081350825949970.795932458702501
220.3097869821909680.6195739643819360.690213017809032
230.3745301200618090.7490602401236180.625469879938191
240.4410624261685330.8821248523370660.558937573831467
250.4045271082886750.809054216577350.595472891711325
260.3415056692624370.6830113385248740.658494330737563
270.2796301746724560.5592603493449120.720369825327544
280.2269400882673050.4538801765346090.773059911732695
290.1857667726946930.3715335453893860.814233227305307
300.1447786667650230.2895573335300450.855221333234977
310.2724858104834940.5449716209669870.727514189516506
320.2168837771202540.4337675542405070.783116222879746
330.2625599847716270.5251199695432550.737440015228373
340.5822116963409510.8355766073180980.417788303659049
350.5467476621202310.9065046757595380.453252337879769
360.5086535747115950.982692850576810.491346425288405
370.4374631752358270.8749263504716530.562536824764173
380.3663233949661780.7326467899323560.633676605033822
390.2976939452049080.5953878904098160.702306054795092
400.2463014305506920.4926028611013850.753698569449308
410.2080931562012230.4161863124024470.791906843798777
420.1715115669716150.3430231339432300.828488433028385
430.1742609110551670.3485218221103350.825739088944833
440.1296320843537250.2592641687074510.870367915646275
450.09059946417028390.1811989283405680.909400535829716
460.1425728737107280.2851457474214560.857427126289272
470.1599299421829600.3198598843659210.84007005781704
480.390810836592360.781621673184720.60918916340764
490.3016133279653520.6032266559307040.698386672034648
500.2284669201478620.4569338402957250.771533079852138
510.1567179919249920.3134359838499830.843282008075009
520.1014064892322520.2028129784645050.898593510767748
530.07474974321951620.1494994864390320.925250256780484
540.0402200808830350.080440161766070.959779919116965
550.02459441438789120.04918882877578240.975405585612109

\begin{tabular}{lllllllll}
\hline
Goldfeld-Quandt test for Heteroskedasticity \tabularnewline
p-values & Alternative Hypothesis \tabularnewline
breakpoint index & greater & 2-sided & less \tabularnewline
5 & 0.117407129698914 & 0.234814259397828 & 0.882592870301086 \tabularnewline
6 & 0.046571963350652 & 0.093143926701304 & 0.953428036649348 \tabularnewline
7 & 0.377544966484290 & 0.755089932968579 & 0.62245503351571 \tabularnewline
8 & 0.29636772740474 & 0.59273545480948 & 0.70363227259526 \tabularnewline
9 & 0.202344186564644 & 0.404688373129289 & 0.797655813435356 \tabularnewline
10 & 0.296027850880095 & 0.59205570176019 & 0.703972149119905 \tabularnewline
11 & 0.511237080819931 & 0.977525838360139 & 0.488762919180069 \tabularnewline
12 & 0.601068111686596 & 0.797863776626808 & 0.398931888313404 \tabularnewline
13 & 0.5532127029296 & 0.8935745941408 & 0.4467872970704 \tabularnewline
14 & 0.494105278061438 & 0.988210556122875 & 0.505894721938562 \tabularnewline
15 & 0.404738068324991 & 0.809476136649982 & 0.595261931675009 \tabularnewline
16 & 0.33203793658701 & 0.66407587317402 & 0.66796206341299 \tabularnewline
17 & 0.270400871922896 & 0.540801743845792 & 0.729599128077104 \tabularnewline
18 & 0.205721053443078 & 0.411442106886156 & 0.794278946556922 \tabularnewline
19 & 0.325566937072603 & 0.651133874145206 & 0.674433062927397 \tabularnewline
20 & 0.262636099621058 & 0.525272199242116 & 0.737363900378942 \tabularnewline
21 & 0.204067541297499 & 0.408135082594997 & 0.795932458702501 \tabularnewline
22 & 0.309786982190968 & 0.619573964381936 & 0.690213017809032 \tabularnewline
23 & 0.374530120061809 & 0.749060240123618 & 0.625469879938191 \tabularnewline
24 & 0.441062426168533 & 0.882124852337066 & 0.558937573831467 \tabularnewline
25 & 0.404527108288675 & 0.80905421657735 & 0.595472891711325 \tabularnewline
26 & 0.341505669262437 & 0.683011338524874 & 0.658494330737563 \tabularnewline
27 & 0.279630174672456 & 0.559260349344912 & 0.720369825327544 \tabularnewline
28 & 0.226940088267305 & 0.453880176534609 & 0.773059911732695 \tabularnewline
29 & 0.185766772694693 & 0.371533545389386 & 0.814233227305307 \tabularnewline
30 & 0.144778666765023 & 0.289557333530045 & 0.855221333234977 \tabularnewline
31 & 0.272485810483494 & 0.544971620966987 & 0.727514189516506 \tabularnewline
32 & 0.216883777120254 & 0.433767554240507 & 0.783116222879746 \tabularnewline
33 & 0.262559984771627 & 0.525119969543255 & 0.737440015228373 \tabularnewline
34 & 0.582211696340951 & 0.835576607318098 & 0.417788303659049 \tabularnewline
35 & 0.546747662120231 & 0.906504675759538 & 0.453252337879769 \tabularnewline
36 & 0.508653574711595 & 0.98269285057681 & 0.491346425288405 \tabularnewline
37 & 0.437463175235827 & 0.874926350471653 & 0.562536824764173 \tabularnewline
38 & 0.366323394966178 & 0.732646789932356 & 0.633676605033822 \tabularnewline
39 & 0.297693945204908 & 0.595387890409816 & 0.702306054795092 \tabularnewline
40 & 0.246301430550692 & 0.492602861101385 & 0.753698569449308 \tabularnewline
41 & 0.208093156201223 & 0.416186312402447 & 0.791906843798777 \tabularnewline
42 & 0.171511566971615 & 0.343023133943230 & 0.828488433028385 \tabularnewline
43 & 0.174260911055167 & 0.348521822110335 & 0.825739088944833 \tabularnewline
44 & 0.129632084353725 & 0.259264168707451 & 0.870367915646275 \tabularnewline
45 & 0.0905994641702839 & 0.181198928340568 & 0.909400535829716 \tabularnewline
46 & 0.142572873710728 & 0.285145747421456 & 0.857427126289272 \tabularnewline
47 & 0.159929942182960 & 0.319859884365921 & 0.84007005781704 \tabularnewline
48 & 0.39081083659236 & 0.78162167318472 & 0.60918916340764 \tabularnewline
49 & 0.301613327965352 & 0.603226655930704 & 0.698386672034648 \tabularnewline
50 & 0.228466920147862 & 0.456933840295725 & 0.771533079852138 \tabularnewline
51 & 0.156717991924992 & 0.313435983849983 & 0.843282008075009 \tabularnewline
52 & 0.101406489232252 & 0.202812978464505 & 0.898593510767748 \tabularnewline
53 & 0.0747497432195162 & 0.149499486439032 & 0.925250256780484 \tabularnewline
54 & 0.040220080883035 & 0.08044016176607 & 0.959779919116965 \tabularnewline
55 & 0.0245944143878912 & 0.0491888287757824 & 0.975405585612109 \tabularnewline
\hline
\end{tabular}
%Source: https://freestatistics.org/blog/index.php?pk=25812&T=5

[TABLE]
[ROW][C]Goldfeld-Quandt test for Heteroskedasticity[/C][/ROW]
[ROW][C]p-values[/C][C]Alternative Hypothesis[/C][/ROW]
[ROW][C]breakpoint index[/C][C]greater[/C][C]2-sided[/C][C]less[/C][/ROW]
[ROW][C]5[/C][C]0.117407129698914[/C][C]0.234814259397828[/C][C]0.882592870301086[/C][/ROW]
[ROW][C]6[/C][C]0.046571963350652[/C][C]0.093143926701304[/C][C]0.953428036649348[/C][/ROW]
[ROW][C]7[/C][C]0.377544966484290[/C][C]0.755089932968579[/C][C]0.62245503351571[/C][/ROW]
[ROW][C]8[/C][C]0.29636772740474[/C][C]0.59273545480948[/C][C]0.70363227259526[/C][/ROW]
[ROW][C]9[/C][C]0.202344186564644[/C][C]0.404688373129289[/C][C]0.797655813435356[/C][/ROW]
[ROW][C]10[/C][C]0.296027850880095[/C][C]0.59205570176019[/C][C]0.703972149119905[/C][/ROW]
[ROW][C]11[/C][C]0.511237080819931[/C][C]0.977525838360139[/C][C]0.488762919180069[/C][/ROW]
[ROW][C]12[/C][C]0.601068111686596[/C][C]0.797863776626808[/C][C]0.398931888313404[/C][/ROW]
[ROW][C]13[/C][C]0.5532127029296[/C][C]0.8935745941408[/C][C]0.4467872970704[/C][/ROW]
[ROW][C]14[/C][C]0.494105278061438[/C][C]0.988210556122875[/C][C]0.505894721938562[/C][/ROW]
[ROW][C]15[/C][C]0.404738068324991[/C][C]0.809476136649982[/C][C]0.595261931675009[/C][/ROW]
[ROW][C]16[/C][C]0.33203793658701[/C][C]0.66407587317402[/C][C]0.66796206341299[/C][/ROW]
[ROW][C]17[/C][C]0.270400871922896[/C][C]0.540801743845792[/C][C]0.729599128077104[/C][/ROW]
[ROW][C]18[/C][C]0.205721053443078[/C][C]0.411442106886156[/C][C]0.794278946556922[/C][/ROW]
[ROW][C]19[/C][C]0.325566937072603[/C][C]0.651133874145206[/C][C]0.674433062927397[/C][/ROW]
[ROW][C]20[/C][C]0.262636099621058[/C][C]0.525272199242116[/C][C]0.737363900378942[/C][/ROW]
[ROW][C]21[/C][C]0.204067541297499[/C][C]0.408135082594997[/C][C]0.795932458702501[/C][/ROW]
[ROW][C]22[/C][C]0.309786982190968[/C][C]0.619573964381936[/C][C]0.690213017809032[/C][/ROW]
[ROW][C]23[/C][C]0.374530120061809[/C][C]0.749060240123618[/C][C]0.625469879938191[/C][/ROW]
[ROW][C]24[/C][C]0.441062426168533[/C][C]0.882124852337066[/C][C]0.558937573831467[/C][/ROW]
[ROW][C]25[/C][C]0.404527108288675[/C][C]0.80905421657735[/C][C]0.595472891711325[/C][/ROW]
[ROW][C]26[/C][C]0.341505669262437[/C][C]0.683011338524874[/C][C]0.658494330737563[/C][/ROW]
[ROW][C]27[/C][C]0.279630174672456[/C][C]0.559260349344912[/C][C]0.720369825327544[/C][/ROW]
[ROW][C]28[/C][C]0.226940088267305[/C][C]0.453880176534609[/C][C]0.773059911732695[/C][/ROW]
[ROW][C]29[/C][C]0.185766772694693[/C][C]0.371533545389386[/C][C]0.814233227305307[/C][/ROW]
[ROW][C]30[/C][C]0.144778666765023[/C][C]0.289557333530045[/C][C]0.855221333234977[/C][/ROW]
[ROW][C]31[/C][C]0.272485810483494[/C][C]0.544971620966987[/C][C]0.727514189516506[/C][/ROW]
[ROW][C]32[/C][C]0.216883777120254[/C][C]0.433767554240507[/C][C]0.783116222879746[/C][/ROW]
[ROW][C]33[/C][C]0.262559984771627[/C][C]0.525119969543255[/C][C]0.737440015228373[/C][/ROW]
[ROW][C]34[/C][C]0.582211696340951[/C][C]0.835576607318098[/C][C]0.417788303659049[/C][/ROW]
[ROW][C]35[/C][C]0.546747662120231[/C][C]0.906504675759538[/C][C]0.453252337879769[/C][/ROW]
[ROW][C]36[/C][C]0.508653574711595[/C][C]0.98269285057681[/C][C]0.491346425288405[/C][/ROW]
[ROW][C]37[/C][C]0.437463175235827[/C][C]0.874926350471653[/C][C]0.562536824764173[/C][/ROW]
[ROW][C]38[/C][C]0.366323394966178[/C][C]0.732646789932356[/C][C]0.633676605033822[/C][/ROW]
[ROW][C]39[/C][C]0.297693945204908[/C][C]0.595387890409816[/C][C]0.702306054795092[/C][/ROW]
[ROW][C]40[/C][C]0.246301430550692[/C][C]0.492602861101385[/C][C]0.753698569449308[/C][/ROW]
[ROW][C]41[/C][C]0.208093156201223[/C][C]0.416186312402447[/C][C]0.791906843798777[/C][/ROW]
[ROW][C]42[/C][C]0.171511566971615[/C][C]0.343023133943230[/C][C]0.828488433028385[/C][/ROW]
[ROW][C]43[/C][C]0.174260911055167[/C][C]0.348521822110335[/C][C]0.825739088944833[/C][/ROW]
[ROW][C]44[/C][C]0.129632084353725[/C][C]0.259264168707451[/C][C]0.870367915646275[/C][/ROW]
[ROW][C]45[/C][C]0.0905994641702839[/C][C]0.181198928340568[/C][C]0.909400535829716[/C][/ROW]
[ROW][C]46[/C][C]0.142572873710728[/C][C]0.285145747421456[/C][C]0.857427126289272[/C][/ROW]
[ROW][C]47[/C][C]0.159929942182960[/C][C]0.319859884365921[/C][C]0.84007005781704[/C][/ROW]
[ROW][C]48[/C][C]0.39081083659236[/C][C]0.78162167318472[/C][C]0.60918916340764[/C][/ROW]
[ROW][C]49[/C][C]0.301613327965352[/C][C]0.603226655930704[/C][C]0.698386672034648[/C][/ROW]
[ROW][C]50[/C][C]0.228466920147862[/C][C]0.456933840295725[/C][C]0.771533079852138[/C][/ROW]
[ROW][C]51[/C][C]0.156717991924992[/C][C]0.313435983849983[/C][C]0.843282008075009[/C][/ROW]
[ROW][C]52[/C][C]0.101406489232252[/C][C]0.202812978464505[/C][C]0.898593510767748[/C][/ROW]
[ROW][C]53[/C][C]0.0747497432195162[/C][C]0.149499486439032[/C][C]0.925250256780484[/C][/ROW]
[ROW][C]54[/C][C]0.040220080883035[/C][C]0.08044016176607[/C][C]0.959779919116965[/C][/ROW]
[ROW][C]55[/C][C]0.0245944143878912[/C][C]0.0491888287757824[/C][C]0.975405585612109[/C][/ROW]
[/TABLE]
Source: https://freestatistics.org/blog/index.php?pk=25812&T=5

Globally Unique Identifier (entire table): ba.freestatistics.org/blog/index.php?pk=25812&T=5

As an alternative you can also use a QR Code:  

The GUIDs for individual cells are displayed in the table below:

Goldfeld-Quandt test for Heteroskedasticity
p-valuesAlternative Hypothesis
breakpoint indexgreater2-sidedless
50.1174071296989140.2348142593978280.882592870301086
60.0465719633506520.0931439267013040.953428036649348
70.3775449664842900.7550899329685790.62245503351571
80.296367727404740.592735454809480.70363227259526
90.2023441865646440.4046883731292890.797655813435356
100.2960278508800950.592055701760190.703972149119905
110.5112370808199310.9775258383601390.488762919180069
120.6010681116865960.7978637766268080.398931888313404
130.55321270292960.89357459414080.4467872970704
140.4941052780614380.9882105561228750.505894721938562
150.4047380683249910.8094761366499820.595261931675009
160.332037936587010.664075873174020.66796206341299
170.2704008719228960.5408017438457920.729599128077104
180.2057210534430780.4114421068861560.794278946556922
190.3255669370726030.6511338741452060.674433062927397
200.2626360996210580.5252721992421160.737363900378942
210.2040675412974990.4081350825949970.795932458702501
220.3097869821909680.6195739643819360.690213017809032
230.3745301200618090.7490602401236180.625469879938191
240.4410624261685330.8821248523370660.558937573831467
250.4045271082886750.809054216577350.595472891711325
260.3415056692624370.6830113385248740.658494330737563
270.2796301746724560.5592603493449120.720369825327544
280.2269400882673050.4538801765346090.773059911732695
290.1857667726946930.3715335453893860.814233227305307
300.1447786667650230.2895573335300450.855221333234977
310.2724858104834940.5449716209669870.727514189516506
320.2168837771202540.4337675542405070.783116222879746
330.2625599847716270.5251199695432550.737440015228373
340.5822116963409510.8355766073180980.417788303659049
350.5467476621202310.9065046757595380.453252337879769
360.5086535747115950.982692850576810.491346425288405
370.4374631752358270.8749263504716530.562536824764173
380.3663233949661780.7326467899323560.633676605033822
390.2976939452049080.5953878904098160.702306054795092
400.2463014305506920.4926028611013850.753698569449308
410.2080931562012230.4161863124024470.791906843798777
420.1715115669716150.3430231339432300.828488433028385
430.1742609110551670.3485218221103350.825739088944833
440.1296320843537250.2592641687074510.870367915646275
450.09059946417028390.1811989283405680.909400535829716
460.1425728737107280.2851457474214560.857427126289272
470.1599299421829600.3198598843659210.84007005781704
480.390810836592360.781621673184720.60918916340764
490.3016133279653520.6032266559307040.698386672034648
500.2284669201478620.4569338402957250.771533079852138
510.1567179919249920.3134359838499830.843282008075009
520.1014064892322520.2028129784645050.898593510767748
530.07474974321951620.1494994864390320.925250256780484
540.0402200808830350.080440161766070.959779919116965
550.02459441438789120.04918882877578240.975405585612109


Meta Analysis of Goldfeld-Quandt test for Heteroskedasticity
Description# significant tests% significant testsOK/NOK
1% type I error level00OK
5% type I error level10.0196078431372549OK
10% type I error level30.0588235294117647OK

\begin{tabular}{lllllllll}
\hline
Meta Analysis of Goldfeld-Quandt test for Heteroskedasticity \tabularnewline
Description & # significant tests & % significant tests & OK/NOK \tabularnewline
1% type I error level & 0 & 0 & OK \tabularnewline
5% type I error level & 1 & 0.0196078431372549 & OK \tabularnewline
10% type I error level & 3 & 0.0588235294117647 & OK \tabularnewline
\hline
\end{tabular}
%Source: https://freestatistics.org/blog/index.php?pk=25812&T=6

[TABLE]
[ROW][C]Meta Analysis of Goldfeld-Quandt test for Heteroskedasticity[/C][/ROW]
[ROW][C]Description[/C][C]# significant tests[/C][C]% significant tests[/C][C]OK/NOK[/C][/ROW]
[ROW][C]1% type I error level[/C][C]0[/C][C]0[/C][C]OK[/C][/ROW]
[ROW][C]5% type I error level[/C][C]1[/C][C]0.0196078431372549[/C][C]OK[/C][/ROW]
[ROW][C]10% type I error level[/C][C]3[/C][C]0.0588235294117647[/C][C]OK[/C][/ROW]
[/TABLE]
Source: https://freestatistics.org/blog/index.php?pk=25812&T=6

Globally Unique Identifier (entire table): ba.freestatistics.org/blog/index.php?pk=25812&T=6

As an alternative you can also use a QR Code:  

The GUIDs for individual cells are displayed in the table below:

Meta Analysis of Goldfeld-Quandt test for Heteroskedasticity
Description# significant tests% significant testsOK/NOK
1% type I error level00OK
5% type I error level10.0196078431372549OK
10% type I error level30.0588235294117647OK


Parameters (Session):
par1 = 1 ; par2 = Do not include Seasonal Dummies ; par3 = No Linear Trend ;
Parameters (R input):
par1 = 1 ; par2 = Do not include Seasonal Dummies ; par3 = No Linear Trend ;
R code (references can be found in the software module):
library(lattice)
library(lmtest)
n25 <- 25 #minimum number of obs. for Goldfeld-Quandt test
par1 <- as.numeric(par1)
x <- t(y)
k <- length(x[1,])
n <- length(x[,1])
x1 <- cbind(x[,par1], x[,1:k!=par1])
mycolnames <- c(colnames(x)[par1], colnames(x)[1:k!=par1])
colnames(x1) <- mycolnames #colnames(x)[par1]
x <- x1
if (par3 == 'First Differences'){
x2 <- array(0, dim=c(n-1,k), dimnames=list(1:(n-1), paste('(1-B)',colnames(x),sep='')))
for (i in 1:n-1) {
for (j in 1:k) {
x2[i,j] <- x[i+1,j] - x[i,j]
}
}
x <- x2
}
if (par2 == 'Include Monthly Dummies'){
x2 <- array(0, dim=c(n,11), dimnames=list(1:n, paste('M', seq(1:11), sep ='')))
for (i in 1:11){
x2[seq(i,n,12),i] <- 1
}
x <- cbind(x, x2)
}
if (par2 == 'Include Quarterly Dummies'){
x2 <- array(0, dim=c(n,3), dimnames=list(1:n, paste('Q', seq(1:3), sep ='')))
for (i in 1:3){
x2[seq(i,n,4),i] <- 1
}
x <- cbind(x, x2)
}
k <- length(x[1,])
if (par3 == 'Linear Trend'){
x <- cbind(x, c(1:n))
colnames(x)[k+1] <- 't'
}
x
k <- length(x[1,])
df <- as.data.frame(x)
(mylm <- lm(df))
(mysum <- summary(mylm))
if (n > n25) {
kp3 <- k + 3
nmkm3 <- n - k - 3
gqarr <- array(NA, dim=c(nmkm3-kp3+1,3))
numgqtests <- 0
numsignificant1 <- 0
numsignificant5 <- 0
numsignificant10 <- 0
for (mypoint in kp3:nmkm3) {
j <- 0
numgqtests <- numgqtests + 1
for (myalt in c('greater', 'two.sided', 'less')) {
j <- j + 1
gqarr[mypoint-kp3+1,j] <- gqtest(mylm, point=mypoint, alternative=myalt)$p.value
}
if (gqarr[mypoint-kp3+1,2] < 0.01) numsignificant1 <- numsignificant1 + 1
if (gqarr[mypoint-kp3+1,2] < 0.05) numsignificant5 <- numsignificant5 + 1
if (gqarr[mypoint-kp3+1,2] < 0.10) numsignificant10 <- numsignificant10 + 1
}
gqarr
}
bitmap(file='test0.png')
plot(x[,1], type='l', main='Actuals and Interpolation', ylab='value of Actuals and Interpolation (dots)', xlab='time or index')
points(x[,1]-mysum$resid)
grid()
dev.off()
bitmap(file='test1.png')
plot(mysum$resid, type='b', pch=19, main='Residuals', ylab='value of Residuals', xlab='time or index')
grid()
dev.off()
bitmap(file='test2.png')
hist(mysum$resid, main='Residual Histogram', xlab='values of Residuals')
grid()
dev.off()
bitmap(file='test3.png')
densityplot(~mysum$resid,col='black',main='Residual Density Plot', xlab='values of Residuals')
dev.off()
bitmap(file='test4.png')
qqnorm(mysum$resid, main='Residual Normal Q-Q Plot')
qqline(mysum$resid)
grid()
dev.off()
(myerror <- as.ts(mysum$resid))
bitmap(file='test5.png')
dum <- cbind(lag(myerror,k=1),myerror)
dum
dum1 <- dum[2:length(myerror),]
dum1
z <- as.data.frame(dum1)
z
plot(z,main=paste('Residual Lag plot, lowess, and regression line'), ylab='values of Residuals', xlab='lagged values of Residuals')
lines(lowess(z))
abline(lm(z))
grid()
dev.off()
bitmap(file='test6.png')
acf(mysum$resid, lag.max=length(mysum$resid)/2, main='Residual Autocorrelation Function')
grid()
dev.off()
bitmap(file='test7.png')
pacf(mysum$resid, lag.max=length(mysum$resid)/2, main='Residual Partial Autocorrelation Function')
grid()
dev.off()
bitmap(file='test8.png')
opar <- par(mfrow = c(2,2), oma = c(0, 0, 1.1, 0))
plot(mylm, las = 1, sub='Residual Diagnostics')
par(opar)
dev.off()
if (n > n25) {
bitmap(file='test9.png')
plot(kp3:nmkm3,gqarr[,2], main='Goldfeld-Quandt test',ylab='2-sided p-value',xlab='breakpoint')
grid()
dev.off()
}
load(file='createtable')
a<-table.start()
a<-table.row.start(a)
a<-table.element(a, 'Multiple Linear Regression - Estimated Regression Equation', 1, TRUE)
a<-table.row.end(a)
myeq <- colnames(x)[1]
myeq <- paste(myeq, '[t] = ', sep='')
for (i in 1:k){
if (mysum$coefficients[i,1] > 0) myeq <- paste(myeq, '+', '')
myeq <- paste(myeq, mysum$coefficients[i,1], sep=' ')
if (rownames(mysum$coefficients)[i] != '(Intercept)') {
myeq <- paste(myeq, rownames(mysum$coefficients)[i], sep='')
if (rownames(mysum$coefficients)[i] != 't') myeq <- paste(myeq, '[t]', sep='')
}
}
myeq <- paste(myeq, ' + e[t]')
a<-table.row.start(a)
a<-table.element(a, myeq)
a<-table.row.end(a)
a<-table.end(a)
table.save(a,file='mytable1.tab')
a<-table.start()
a<-table.row.start(a)
a<-table.element(a,hyperlink('ols1.htm','Multiple Linear Regression - Ordinary Least Squares',''), 6, TRUE)
a<-table.row.end(a)
a<-table.row.start(a)
a<-table.element(a,'Variable',header=TRUE)
a<-table.element(a,'Parameter',header=TRUE)
a<-table.element(a,'S.D.',header=TRUE)
a<-table.element(a,'T-STAT
H0: parameter = 0',header=TRUE)
a<-table.element(a,'2-tail p-value',header=TRUE)
a<-table.element(a,'1-tail p-value',header=TRUE)
a<-table.row.end(a)
for (i in 1:k){
a<-table.row.start(a)
a<-table.element(a,rownames(mysum$coefficients)[i],header=TRUE)
a<-table.element(a,mysum$coefficients[i,1])
a<-table.element(a, round(mysum$coefficients[i,2],6))
a<-table.element(a, round(mysum$coefficients[i,3],4))
a<-table.element(a, round(mysum$coefficients[i,4],6))
a<-table.element(a, round(mysum$coefficients[i,4]/2,6))
a<-table.row.end(a)
}
a<-table.end(a)
table.save(a,file='mytable2.tab')
a<-table.start()
a<-table.row.start(a)
a<-table.element(a, 'Multiple Linear Regression - Regression Statistics', 2, TRUE)
a<-table.row.end(a)
a<-table.row.start(a)
a<-table.element(a, 'Multiple R',1,TRUE)
a<-table.element(a, sqrt(mysum$r.squared))
a<-table.row.end(a)
a<-table.row.start(a)
a<-table.element(a, 'R-squared',1,TRUE)
a<-table.element(a, mysum$r.squared)
a<-table.row.end(a)
a<-table.row.start(a)
a<-table.element(a, 'Adjusted R-squared',1,TRUE)
a<-table.element(a, mysum$adj.r.squared)
a<-table.row.end(a)
a<-table.row.start(a)
a<-table.element(a, 'F-TEST (value)',1,TRUE)
a<-table.element(a, mysum$fstatistic[1])
a<-table.row.end(a)
a<-table.row.start(a)
a<-table.element(a, 'F-TEST (DF numerator)',1,TRUE)
a<-table.element(a, mysum$fstatistic[2])
a<-table.row.end(a)
a<-table.row.start(a)
a<-table.element(a, 'F-TEST (DF denominator)',1,TRUE)
a<-table.element(a, mysum$fstatistic[3])
a<-table.row.end(a)
a<-table.row.start(a)
a<-table.element(a, 'p-value',1,TRUE)
a<-table.element(a, 1-pf(mysum$fstatistic[1],mysum$fstatistic[2],mysum$fstatistic[3]))
a<-table.row.end(a)
a<-table.row.start(a)
a<-table.element(a, 'Multiple Linear Regression - Residual Statistics', 2, TRUE)
a<-table.row.end(a)
a<-table.row.start(a)
a<-table.element(a, 'Residual Standard Deviation',1,TRUE)
a<-table.element(a, mysum$sigma)
a<-table.row.end(a)
a<-table.row.start(a)
a<-table.element(a, 'Sum Squared Residuals',1,TRUE)
a<-table.element(a, sum(myerror*myerror))
a<-table.row.end(a)
a<-table.end(a)
table.save(a,file='mytable3.tab')
a<-table.start()
a<-table.row.start(a)
a<-table.element(a, 'Multiple Linear Regression - Actuals, Interpolation, and Residuals', 4, TRUE)
a<-table.row.end(a)
a<-table.row.start(a)
a<-table.element(a, 'Time or Index', 1, TRUE)
a<-table.element(a, 'Actuals', 1, TRUE)
a<-table.element(a, 'Interpolation
Forecast', 1, TRUE)
a<-table.element(a, 'Residuals
Prediction Error', 1, TRUE)
a<-table.row.end(a)
for (i in 1:n) {
a<-table.row.start(a)
a<-table.element(a,i, 1, TRUE)
a<-table.element(a,x[i])
a<-table.element(a,x[i]-mysum$resid[i])
a<-table.element(a,mysum$resid[i])
a<-table.row.end(a)
}
a<-table.end(a)
table.save(a,file='mytable4.tab')
if (n > n25) {
a<-table.start()
a<-table.row.start(a)
a<-table.element(a,'Goldfeld-Quandt test for Heteroskedasticity',4,TRUE)
a<-table.row.end(a)
a<-table.row.start(a)
a<-table.element(a,'p-values',header=TRUE)
a<-table.element(a,'Alternative Hypothesis',3,header=TRUE)
a<-table.row.end(a)
a<-table.row.start(a)
a<-table.element(a,'breakpoint index',header=TRUE)
a<-table.element(a,'greater',header=TRUE)
a<-table.element(a,'2-sided',header=TRUE)
a<-table.element(a,'less',header=TRUE)
a<-table.row.end(a)
for (mypoint in kp3:nmkm3) {
a<-table.row.start(a)
a<-table.element(a,mypoint,header=TRUE)
a<-table.element(a,gqarr[mypoint-kp3+1,1])
a<-table.element(a,gqarr[mypoint-kp3+1,2])
a<-table.element(a,gqarr[mypoint-kp3+1,3])
a<-table.row.end(a)
}
a<-table.end(a)
table.save(a,file='mytable5.tab')
a<-table.start()
a<-table.row.start(a)
a<-table.element(a,'Meta Analysis of Goldfeld-Quandt test for Heteroskedasticity',4,TRUE)
a<-table.row.end(a)
a<-table.row.start(a)
a<-table.element(a,'Description',header=TRUE)
a<-table.element(a,'# significant tests',header=TRUE)
a<-table.element(a,'% significant tests',header=TRUE)
a<-table.element(a,'OK/NOK',header=TRUE)
a<-table.row.end(a)
a<-table.row.start(a)
a<-table.element(a,'1% type I error level',header=TRUE)
a<-table.element(a,numsignificant1)
a<-table.element(a,numsignificant1/numgqtests)
if (numsignificant1/numgqtests < 0.01) dum <- 'OK' else dum <- 'NOK'
a<-table.element(a,dum)
a<-table.row.end(a)
a<-table.row.start(a)
a<-table.element(a,'5% type I error level',header=TRUE)
a<-table.element(a,numsignificant5)
a<-table.element(a,numsignificant5/numgqtests)
if (numsignificant5/numgqtests < 0.05) dum <- 'OK' else dum <- 'NOK'
a<-table.element(a,dum)
a<-table.row.end(a)
a<-table.row.start(a)
a<-table.element(a,'10% type I error level',header=TRUE)
a<-table.element(a,numsignificant10)
a<-table.element(a,numsignificant10/numgqtests)
if (numsignificant10/numgqtests < 0.1) dum <- 'OK' else dum <- 'NOK'
a<-table.element(a,dum)
a<-table.row.end(a)
a<-table.end(a)
table.save(a,file='mytable6.tab')
}