Free Statistics

of Irreproducible Research!

Author's title

Author*The author of this computation has been verified*
R Software Modulerwasp_multipleregression.wasp
Title produced by softwareMultiple Regression
Date of computationThu, 27 Nov 2008 07:25:18 -0700
Cite this page as followsStatistical Computations at FreeStatistics.org, Office for Research Development and Education, URL https://freestatistics.org/blog/index.php?v=date/2008/Nov/27/t1227796291w1o997690v3o03c.htm/, Retrieved Sun, 19 May 2024 03:47:57 +0000
Statistical Computations at FreeStatistics.org, Office for Research Development and Education, URL https://freestatistics.org/blog/index.php?pk=25819, Retrieved Sun, 19 May 2024 03:47:57 +0000
QR Codes:

Original text written by user:
IsPrivate?No (this computation is public)
User-defined keywords
Estimated Impact204
Family? (F = Feedback message, R = changed R code, M = changed R Module, P = changed Parameters, D = changed Data)
-     [Multiple Regression] [Q1 The Seatbeltlaw] [2007-11-14 19:27:43] [8cd6641b921d30ebe00b648d1481bba0]
F    D  [Multiple Regression] [blok 11 opdracht ...] [2008-11-27 10:58:21] [6173c35e31b784a490c8cd5476f785d4]
-    D    [Multiple Regression] [blok 11 Q3 eigen ...] [2008-11-27 13:04:37] [6173c35e31b784a490c8cd5476f785d4]
F    D        [Multiple Regression] [blok 11 Q3 eigen ...] [2008-11-27 14:25:18] [1237f4df7e9be807e4c0a07b90c45721] [Current]
Feedback Forum
2008-11-29 15:30:05 [Thomas Plasschaert] [reply
zeer goede uitwerking van de vraag, verder niets op aan te merken
2008-12-01 19:26:41 [Bénédicte Soens] [reply
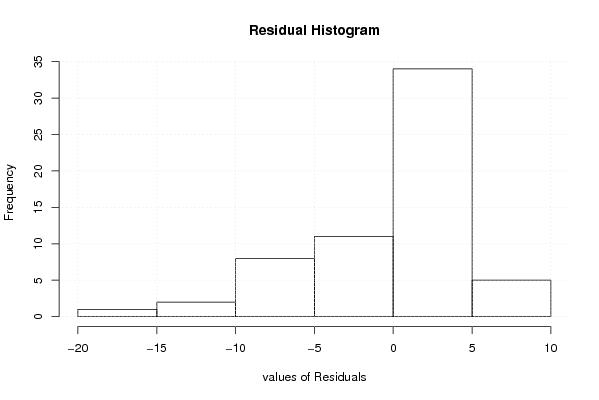
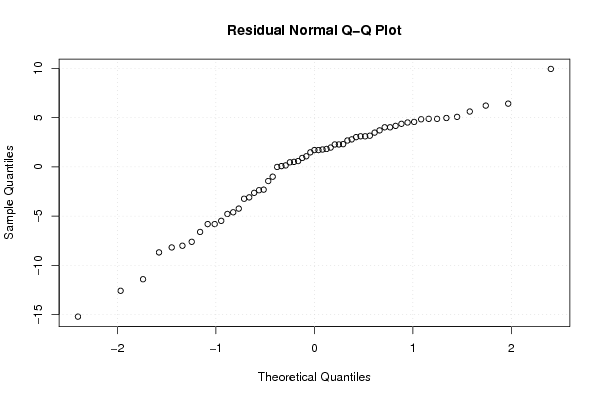
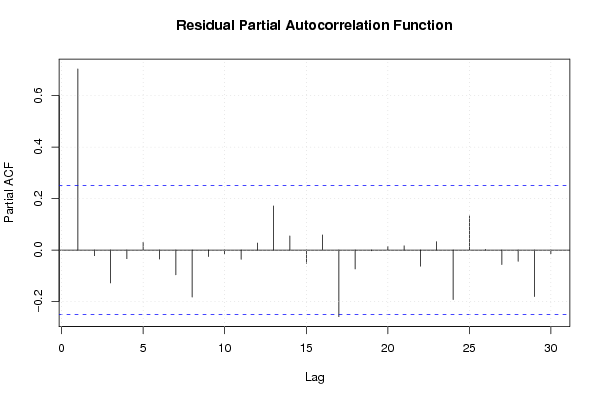
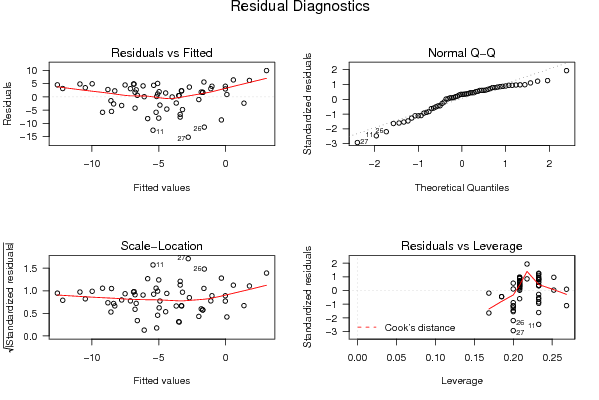
Er werd een goed antwoord geformuleerd. Bij de Normal Q-Q plot is er geen uitleg gegeven. Ik zou daarbij zeggen dat we hiermee de quantielen van de residu’s met deze van de normaalverdeling vergelijken. Het handige zou zijn als je een rechte zou tekenen waardoor je zou kunnen zien dat de punten afwijken van de rechte. Dit wil zeggen dat de voorspellingsfouten afwijken van een normaalverdeling.
2008-12-01 23:48:10 [Gilliam Schoorel] [reply
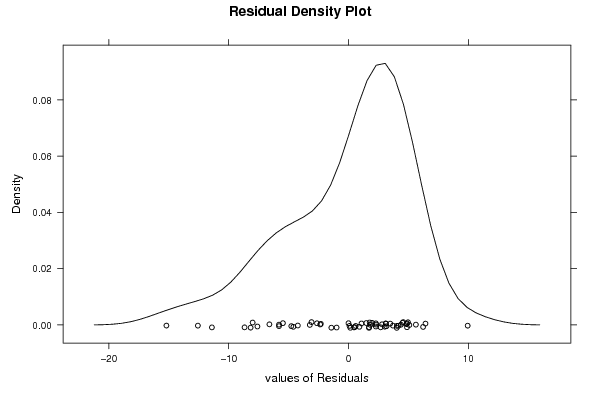
Terug opnieuw een zeer goede oplossing. Je dummy variabelen zijn goed geïmplementeerd in je tijdreeks en de gebeurtenis is inderdaad goed gevonden. Bij de qq-plot kan je eveneens besluiten dat hier geen sprake is van een normaalverdeling. De verdeling van de observaties ligt vrij ver uit elkaar en heeft een vrij lange linker staart. Dit kan je duidelijk zien op de grafiek.

Post a new message
Dataseries X:
13	0
8	0
7	0
3	0
3	0
4	0
4	0
0	0
-4	1
-14	0
-18	0
-8	0
-1	0
1	0
2	0
0	0
1	0
0	0
-1	0
-3	0
-3	0
-3	0
-4	0
-8	0
-9	0
-13	0
-18	0
-11	0
-9	0
-10	0
-13	0
-11	0
-5	0
-15	0
-6	0
-6	0
-3	0
-1	0
-3	0
-4	0
-6	0
0	0
-4	0
-2	0
-2	0
-6	0
-7	0
-6	0
-6	0
-3	0
-2	0
-5	0
-11	0
-11	0
-11	0
-10	0
-14	0
-8	0
-9	0
-5	0
-1	0


Summary of computational transaction
Raw Inputview raw input (R code)
Raw Outputview raw output of R engine
Computing time5 seconds
R Server'Sir Ronald Aylmer Fisher' @ 193.190.124.24
R Framework error message
Warning: there are blank lines in the 'Data X' field.
Please, use NA for missing data - blank lines are simply
 deleted and are NOT treated as missing values.

\begin{tabular}{lllllllll}
\hline
Summary of computational transaction \tabularnewline
Raw Input & view raw input (R code)  \tabularnewline
Raw Output & view raw output of R engine  \tabularnewline
Computing time & 5 seconds \tabularnewline
R Server & 'Sir Ronald Aylmer Fisher' @ 193.190.124.24 \tabularnewline
R Framework error message & 
Warning: there are blank lines in the 'Data X' field.
Please, use NA for missing data - blank lines are simply
 deleted and are NOT treated as missing values.
\tabularnewline \hline \end{tabular} %Source: https://freestatistics.org/blog/index.php?pk=25819&T=0

[TABLE]
[ROW][C]Summary of computational transaction[/C][/ROW]
[ROW][C]Raw Input[/C][C]view raw input (R code) [/C][/ROW]
[ROW][C]Raw Output[/C][C]view raw output of R engine [/C][/ROW]
[ROW][C]Computing time[/C][C]5 seconds[/C][/ROW]
[ROW][C]R Server[/C][C]'Sir Ronald Aylmer Fisher' @ 193.190.124.24[/C][/ROW]
[ROW][C]R Framework error message[/C][C]
Warning: there are blank lines in the 'Data X' field.
Please, use NA for missing data - blank lines are simply
 deleted and are NOT treated as missing values.
[/C][/ROW] [/TABLE] Source: https://freestatistics.org/blog/index.php?pk=25819&T=0

Globally Unique Identifier (entire table): ba.freestatistics.org/blog/index.php?pk=25819&T=0

As an alternative you can also use a QR Code:  

The GUIDs for individual cells are displayed in the table below:

Summary of computational transaction
Raw Inputview raw input (R code)
Raw Outputview raw output of R engine
Computing time5 seconds
R Server'Sir Ronald Aylmer Fisher' @ 193.190.124.24
R Framework error message
Warning: there are blank lines in the 'Data X' field.
Please, use NA for missing data - blank lines are simply
 deleted and are NOT treated as missing values.


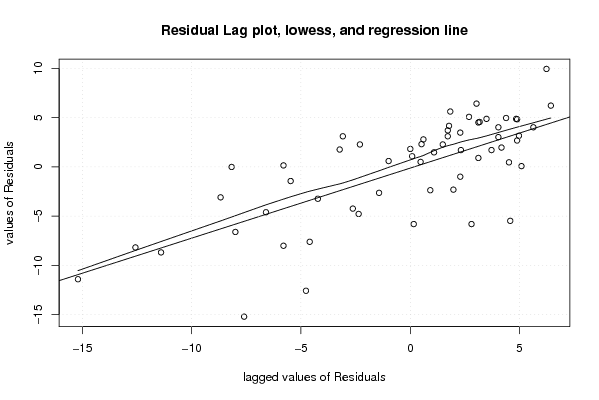
Multiple Linear Regression - Estimated Regression Equation
Y[t] = -1.54285714285714 -2.21428571428571D[t] + 4.73095238095238M1[t] + 3.5952380952381M2[t] + 2.53571428571429M3[t] + 2.07619047619048M4[t] + 1.21666666666667M5[t] + 2.35714285714286M6[t] + 0.897619047619049M7[t] + 0.83809523809524M8[t] + 1.02142857142857M9[t] -2.88095238095238M10[t] -2.34047619047619M11[t] -0.140476190476190t + e[t]

\begin{tabular}{lllllllll}
\hline
Multiple Linear Regression - Estimated Regression Equation \tabularnewline
Y[t] =  -1.54285714285714 -2.21428571428571D[t] +  4.73095238095238M1[t] +  3.5952380952381M2[t] +  2.53571428571429M3[t] +  2.07619047619048M4[t] +  1.21666666666667M5[t] +  2.35714285714286M6[t] +  0.897619047619049M7[t] +  0.83809523809524M8[t] +  1.02142857142857M9[t] -2.88095238095238M10[t] -2.34047619047619M11[t] -0.140476190476190t  + e[t] \tabularnewline
\hline
\end{tabular}
%Source: https://freestatistics.org/blog/index.php?pk=25819&T=1

[TABLE]
[ROW][C]Multiple Linear Regression - Estimated Regression Equation[/C][/ROW]
[ROW][C]Y[t] =  -1.54285714285714 -2.21428571428571D[t] +  4.73095238095238M1[t] +  3.5952380952381M2[t] +  2.53571428571429M3[t] +  2.07619047619048M4[t] +  1.21666666666667M5[t] +  2.35714285714286M6[t] +  0.897619047619049M7[t] +  0.83809523809524M8[t] +  1.02142857142857M9[t] -2.88095238095238M10[t] -2.34047619047619M11[t] -0.140476190476190t  + e[t][/C][/ROW]
[/TABLE]
Source: https://freestatistics.org/blog/index.php?pk=25819&T=1

Globally Unique Identifier (entire table): ba.freestatistics.org/blog/index.php?pk=25819&T=1

As an alternative you can also use a QR Code:  

The GUIDs for individual cells are displayed in the table below:

Multiple Linear Regression - Estimated Regression Equation
Y[t] = -1.54285714285714 -2.21428571428571D[t] + 4.73095238095238M1[t] + 3.5952380952381M2[t] + 2.53571428571429M3[t] + 2.07619047619048M4[t] + 1.21666666666667M5[t] + 2.35714285714286M6[t] + 0.897619047619049M7[t] + 0.83809523809524M8[t] + 1.02142857142857M9[t] -2.88095238095238M10[t] -2.34047619047619M11[t] -0.140476190476190t + e[t]


Multiple Linear Regression - Ordinary Least Squares
VariableParameterS.D.T-STATH0: parameter = 02-tail p-value1-tail p-value
(Intercept)-1.542857142857143.037721-0.50790.6138990.30695
D-2.214285714285716.625758-0.33420.739720.36986
M14.730952380952383.5242521.34240.1859150.092958
M23.59523809523813.699810.97170.3361570.168078
M32.535714285714293.6948950.68630.4959110.247956
M42.076190476190483.6904920.56260.5763960.288198
M51.216666666666673.6866020.330.7428480.371424
M62.357142857142863.6832280.640.5253020.262651
M70.8976190476190493.6803710.24390.8083750.404187
M80.838095238095243.6780310.22790.8207390.41037
M91.021428571428573.8989340.2620.7944840.397242
M10-2.880952380952383.674909-0.7840.4370010.218501
M11-2.340476190476193.674128-0.6370.5272060.263603
t-0.1404761904761900.043737-3.21190.0023820.001191

\begin{tabular}{lllllllll}
\hline
Multiple Linear Regression - Ordinary Least Squares \tabularnewline
Variable & Parameter & S.D. & T-STATH0: parameter = 0 & 2-tail p-value & 1-tail p-value \tabularnewline
(Intercept) & -1.54285714285714 & 3.037721 & -0.5079 & 0.613899 & 0.30695 \tabularnewline
D & -2.21428571428571 & 6.625758 & -0.3342 & 0.73972 & 0.36986 \tabularnewline
M1 & 4.73095238095238 & 3.524252 & 1.3424 & 0.185915 & 0.092958 \tabularnewline
M2 & 3.5952380952381 & 3.69981 & 0.9717 & 0.336157 & 0.168078 \tabularnewline
M3 & 2.53571428571429 & 3.694895 & 0.6863 & 0.495911 & 0.247956 \tabularnewline
M4 & 2.07619047619048 & 3.690492 & 0.5626 & 0.576396 & 0.288198 \tabularnewline
M5 & 1.21666666666667 & 3.686602 & 0.33 & 0.742848 & 0.371424 \tabularnewline
M6 & 2.35714285714286 & 3.683228 & 0.64 & 0.525302 & 0.262651 \tabularnewline
M7 & 0.897619047619049 & 3.680371 & 0.2439 & 0.808375 & 0.404187 \tabularnewline
M8 & 0.83809523809524 & 3.678031 & 0.2279 & 0.820739 & 0.41037 \tabularnewline
M9 & 1.02142857142857 & 3.898934 & 0.262 & 0.794484 & 0.397242 \tabularnewline
M10 & -2.88095238095238 & 3.674909 & -0.784 & 0.437001 & 0.218501 \tabularnewline
M11 & -2.34047619047619 & 3.674128 & -0.637 & 0.527206 & 0.263603 \tabularnewline
t & -0.140476190476190 & 0.043737 & -3.2119 & 0.002382 & 0.001191 \tabularnewline
\hline
\end{tabular}
%Source: https://freestatistics.org/blog/index.php?pk=25819&T=2

[TABLE]
[ROW][C]Multiple Linear Regression - Ordinary Least Squares[/C][/ROW]
[ROW][C]Variable[/C][C]Parameter[/C][C]S.D.[/C][C]T-STATH0: parameter = 0[/C][C]2-tail p-value[/C][C]1-tail p-value[/C][/ROW]
[ROW][C](Intercept)[/C][C]-1.54285714285714[/C][C]3.037721[/C][C]-0.5079[/C][C]0.613899[/C][C]0.30695[/C][/ROW]
[ROW][C]D[/C][C]-2.21428571428571[/C][C]6.625758[/C][C]-0.3342[/C][C]0.73972[/C][C]0.36986[/C][/ROW]
[ROW][C]M1[/C][C]4.73095238095238[/C][C]3.524252[/C][C]1.3424[/C][C]0.185915[/C][C]0.092958[/C][/ROW]
[ROW][C]M2[/C][C]3.5952380952381[/C][C]3.69981[/C][C]0.9717[/C][C]0.336157[/C][C]0.168078[/C][/ROW]
[ROW][C]M3[/C][C]2.53571428571429[/C][C]3.694895[/C][C]0.6863[/C][C]0.495911[/C][C]0.247956[/C][/ROW]
[ROW][C]M4[/C][C]2.07619047619048[/C][C]3.690492[/C][C]0.5626[/C][C]0.576396[/C][C]0.288198[/C][/ROW]
[ROW][C]M5[/C][C]1.21666666666667[/C][C]3.686602[/C][C]0.33[/C][C]0.742848[/C][C]0.371424[/C][/ROW]
[ROW][C]M6[/C][C]2.35714285714286[/C][C]3.683228[/C][C]0.64[/C][C]0.525302[/C][C]0.262651[/C][/ROW]
[ROW][C]M7[/C][C]0.897619047619049[/C][C]3.680371[/C][C]0.2439[/C][C]0.808375[/C][C]0.404187[/C][/ROW]
[ROW][C]M8[/C][C]0.83809523809524[/C][C]3.678031[/C][C]0.2279[/C][C]0.820739[/C][C]0.41037[/C][/ROW]
[ROW][C]M9[/C][C]1.02142857142857[/C][C]3.898934[/C][C]0.262[/C][C]0.794484[/C][C]0.397242[/C][/ROW]
[ROW][C]M10[/C][C]-2.88095238095238[/C][C]3.674909[/C][C]-0.784[/C][C]0.437001[/C][C]0.218501[/C][/ROW]
[ROW][C]M11[/C][C]-2.34047619047619[/C][C]3.674128[/C][C]-0.637[/C][C]0.527206[/C][C]0.263603[/C][/ROW]
[ROW][C]t[/C][C]-0.140476190476190[/C][C]0.043737[/C][C]-3.2119[/C][C]0.002382[/C][C]0.001191[/C][/ROW]
[/TABLE]
Source: https://freestatistics.org/blog/index.php?pk=25819&T=2

Globally Unique Identifier (entire table): ba.freestatistics.org/blog/index.php?pk=25819&T=2

As an alternative you can also use a QR Code:  

The GUIDs for individual cells are displayed in the table below:

Multiple Linear Regression - Ordinary Least Squares
VariableParameterS.D.T-STATH0: parameter = 02-tail p-value1-tail p-value
(Intercept)-1.542857142857143.037721-0.50790.6138990.30695
D-2.214285714285716.625758-0.33420.739720.36986
M14.730952380952383.5242521.34240.1859150.092958
M23.59523809523813.699810.97170.3361570.168078
M32.535714285714293.6948950.68630.4959110.247956
M42.076190476190483.6904920.56260.5763960.288198
M51.216666666666673.6866020.330.7428480.371424
M62.357142857142863.6832280.640.5253020.262651
M70.8976190476190493.6803710.24390.8083750.404187
M80.838095238095243.6780310.22790.8207390.41037
M91.021428571428573.8989340.2620.7944840.397242
M10-2.880952380952383.674909-0.7840.4370010.218501
M11-2.340476190476193.674128-0.6370.5272060.263603
t-0.1404761904761900.043737-3.21190.0023820.001191


Multiple Linear Regression - Regression Statistics
Multiple R0.558450105749248
R-squared0.311866520611346
Adjusted R-squared0.121531728440016
F-TEST (value)1.63851557066151
F-TEST (DF numerator)13
F-TEST (DF denominator)47
p-value0.10811902855139
Multiple Linear Regression - Residual Statistics
Residual Standard Deviation5.80889511106437
Sum Squared Residuals1585.93333333333

\begin{tabular}{lllllllll}
\hline
Multiple Linear Regression - Regression Statistics \tabularnewline
Multiple R & 0.558450105749248 \tabularnewline
R-squared & 0.311866520611346 \tabularnewline
Adjusted R-squared & 0.121531728440016 \tabularnewline
F-TEST (value) & 1.63851557066151 \tabularnewline
F-TEST (DF numerator) & 13 \tabularnewline
F-TEST (DF denominator) & 47 \tabularnewline
p-value & 0.10811902855139 \tabularnewline
Multiple Linear Regression - Residual Statistics \tabularnewline
Residual Standard Deviation & 5.80889511106437 \tabularnewline
Sum Squared Residuals & 1585.93333333333 \tabularnewline
\hline
\end{tabular}
%Source: https://freestatistics.org/blog/index.php?pk=25819&T=3

[TABLE]
[ROW][C]Multiple Linear Regression - Regression Statistics[/C][/ROW]
[ROW][C]Multiple R[/C][C]0.558450105749248[/C][/ROW]
[ROW][C]R-squared[/C][C]0.311866520611346[/C][/ROW]
[ROW][C]Adjusted R-squared[/C][C]0.121531728440016[/C][/ROW]
[ROW][C]F-TEST (value)[/C][C]1.63851557066151[/C][/ROW]
[ROW][C]F-TEST (DF numerator)[/C][C]13[/C][/ROW]
[ROW][C]F-TEST (DF denominator)[/C][C]47[/C][/ROW]
[ROW][C]p-value[/C][C]0.10811902855139[/C][/ROW]
[ROW][C]Multiple Linear Regression - Residual Statistics[/C][/ROW]
[ROW][C]Residual Standard Deviation[/C][C]5.80889511106437[/C][/ROW]
[ROW][C]Sum Squared Residuals[/C][C]1585.93333333333[/C][/ROW]
[/TABLE]
Source: https://freestatistics.org/blog/index.php?pk=25819&T=3

Globally Unique Identifier (entire table): ba.freestatistics.org/blog/index.php?pk=25819&T=3

As an alternative you can also use a QR Code:  

The GUIDs for individual cells are displayed in the table below:

Multiple Linear Regression - Regression Statistics
Multiple R0.558450105749248
R-squared0.311866520611346
Adjusted R-squared0.121531728440016
F-TEST (value)1.63851557066151
F-TEST (DF numerator)13
F-TEST (DF denominator)47
p-value0.10811902855139
Multiple Linear Regression - Residual Statistics
Residual Standard Deviation5.80889511106437
Sum Squared Residuals1585.93333333333


Multiple Linear Regression - Actuals, Interpolation, and Residuals
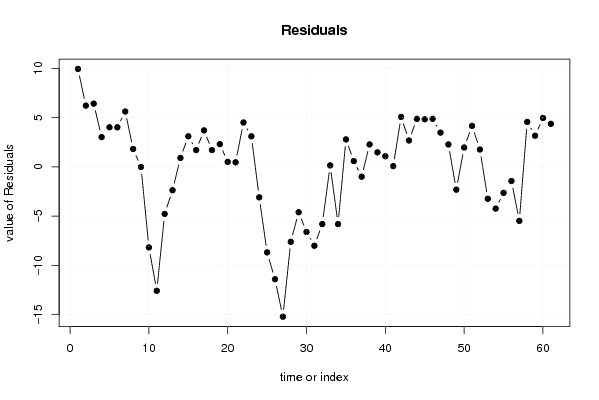
Time or IndexActualsInterpolationForecastResidualsPrediction Error
1133.047619047619059.95238095238095
281.771428571428576.22857142857143
370.571428571428576.42857142857143
43-0.02857142857142983.02857142857143
53-1.028571428571434.02857142857143
64-0.02857142857143114.02857142857143
74-1.628571428571435.62857142857143
80-1.828571428571431.82857142857143
9-4-46.55074952615742e-16
10-14-5.82857142857143-8.17142857142857
11-18-5.42857142857142-12.5714285714286
12-8-3.22857142857143-4.77142857142857
13-11.36190476190476-2.36190476190476
1410.0857142857142860.914285714285714
152-1.114285714285713.11428571428571
160-1.714285714285711.71428571428571
171-2.714285714285713.71428571428571
180-1.714285714285711.71428571428571
19-1-3.314285714285712.31428571428571
20-3-3.514285714285710.514285714285713
21-3-3.471428571428570.47142857142857
22-3-7.514285714285724.51428571428572
23-4-7.114285714285713.11428571428571
24-8-4.91428571428572-3.08571428571428
25-9-0.323809523809524-8.67619047619048
26-13-1.60000000000000-11.4
27-18-2.8-15.2
28-11-3.4-7.6
29-9-4.4-4.6
30-10-3.4-6.6
31-13-5-8
32-11-5.2-5.8
33-5-5.157142857142860.157142857142857
34-15-9.2-5.8
35-6-8.82.8
36-6-6.60.6
37-3-2.00952380952381-0.99047619047619
38-1-3.285714285714282.28571428571428
39-3-4.485714285714291.48571428571429
40-4-5.085714285714291.08571428571429
41-6-6.085714285714290.0857142857142858
420-5.085714285714295.08571428571429
43-4-6.685714285714292.68571428571429
44-2-6.885714285714294.88571428571429
45-2-6.842857142857144.84285714285714
46-6-10.88571428571434.88571428571429
47-7-10.48571428571433.48571428571429
48-6-8.285714285714292.28571428571429
49-6-3.6952380952381-2.30476190476190
50-3-4.971428571428571.97142857142857
51-2-6.171428571428574.17142857142857
52-5-6.771428571428571.77142857142857
53-11-7.77142857142857-3.22857142857143
54-11-6.77142857142857-4.22857142857143
55-11-8.37142857142857-2.62857142857143
56-10-8.57142857142857-1.42857142857143
57-14-8.52857142857143-5.47142857142857
58-8-12.57142857142864.57142857142857
59-9-12.17142857142863.17142857142857
60-5-9.971428571428574.97142857142857
61-1-5.380952380952384.38095238095238

\begin{tabular}{lllllllll}
\hline
Multiple Linear Regression - Actuals, Interpolation, and Residuals \tabularnewline
Time or Index & Actuals & InterpolationForecast & ResidualsPrediction Error \tabularnewline
1 & 13 & 3.04761904761905 & 9.95238095238095 \tabularnewline
2 & 8 & 1.77142857142857 & 6.22857142857143 \tabularnewline
3 & 7 & 0.57142857142857 & 6.42857142857143 \tabularnewline
4 & 3 & -0.0285714285714298 & 3.02857142857143 \tabularnewline
5 & 3 & -1.02857142857143 & 4.02857142857143 \tabularnewline
6 & 4 & -0.0285714285714311 & 4.02857142857143 \tabularnewline
7 & 4 & -1.62857142857143 & 5.62857142857143 \tabularnewline
8 & 0 & -1.82857142857143 & 1.82857142857143 \tabularnewline
9 & -4 & -4 & 6.55074952615742e-16 \tabularnewline
10 & -14 & -5.82857142857143 & -8.17142857142857 \tabularnewline
11 & -18 & -5.42857142857142 & -12.5714285714286 \tabularnewline
12 & -8 & -3.22857142857143 & -4.77142857142857 \tabularnewline
13 & -1 & 1.36190476190476 & -2.36190476190476 \tabularnewline
14 & 1 & 0.085714285714286 & 0.914285714285714 \tabularnewline
15 & 2 & -1.11428571428571 & 3.11428571428571 \tabularnewline
16 & 0 & -1.71428571428571 & 1.71428571428571 \tabularnewline
17 & 1 & -2.71428571428571 & 3.71428571428571 \tabularnewline
18 & 0 & -1.71428571428571 & 1.71428571428571 \tabularnewline
19 & -1 & -3.31428571428571 & 2.31428571428571 \tabularnewline
20 & -3 & -3.51428571428571 & 0.514285714285713 \tabularnewline
21 & -3 & -3.47142857142857 & 0.47142857142857 \tabularnewline
22 & -3 & -7.51428571428572 & 4.51428571428572 \tabularnewline
23 & -4 & -7.11428571428571 & 3.11428571428571 \tabularnewline
24 & -8 & -4.91428571428572 & -3.08571428571428 \tabularnewline
25 & -9 & -0.323809523809524 & -8.67619047619048 \tabularnewline
26 & -13 & -1.60000000000000 & -11.4 \tabularnewline
27 & -18 & -2.8 & -15.2 \tabularnewline
28 & -11 & -3.4 & -7.6 \tabularnewline
29 & -9 & -4.4 & -4.6 \tabularnewline
30 & -10 & -3.4 & -6.6 \tabularnewline
31 & -13 & -5 & -8 \tabularnewline
32 & -11 & -5.2 & -5.8 \tabularnewline
33 & -5 & -5.15714285714286 & 0.157142857142857 \tabularnewline
34 & -15 & -9.2 & -5.8 \tabularnewline
35 & -6 & -8.8 & 2.8 \tabularnewline
36 & -6 & -6.6 & 0.6 \tabularnewline
37 & -3 & -2.00952380952381 & -0.99047619047619 \tabularnewline
38 & -1 & -3.28571428571428 & 2.28571428571428 \tabularnewline
39 & -3 & -4.48571428571429 & 1.48571428571429 \tabularnewline
40 & -4 & -5.08571428571429 & 1.08571428571429 \tabularnewline
41 & -6 & -6.08571428571429 & 0.0857142857142858 \tabularnewline
42 & 0 & -5.08571428571429 & 5.08571428571429 \tabularnewline
43 & -4 & -6.68571428571429 & 2.68571428571429 \tabularnewline
44 & -2 & -6.88571428571429 & 4.88571428571429 \tabularnewline
45 & -2 & -6.84285714285714 & 4.84285714285714 \tabularnewline
46 & -6 & -10.8857142857143 & 4.88571428571429 \tabularnewline
47 & -7 & -10.4857142857143 & 3.48571428571429 \tabularnewline
48 & -6 & -8.28571428571429 & 2.28571428571429 \tabularnewline
49 & -6 & -3.6952380952381 & -2.30476190476190 \tabularnewline
50 & -3 & -4.97142857142857 & 1.97142857142857 \tabularnewline
51 & -2 & -6.17142857142857 & 4.17142857142857 \tabularnewline
52 & -5 & -6.77142857142857 & 1.77142857142857 \tabularnewline
53 & -11 & -7.77142857142857 & -3.22857142857143 \tabularnewline
54 & -11 & -6.77142857142857 & -4.22857142857143 \tabularnewline
55 & -11 & -8.37142857142857 & -2.62857142857143 \tabularnewline
56 & -10 & -8.57142857142857 & -1.42857142857143 \tabularnewline
57 & -14 & -8.52857142857143 & -5.47142857142857 \tabularnewline
58 & -8 & -12.5714285714286 & 4.57142857142857 \tabularnewline
59 & -9 & -12.1714285714286 & 3.17142857142857 \tabularnewline
60 & -5 & -9.97142857142857 & 4.97142857142857 \tabularnewline
61 & -1 & -5.38095238095238 & 4.38095238095238 \tabularnewline
\hline
\end{tabular}
%Source: https://freestatistics.org/blog/index.php?pk=25819&T=4

[TABLE]
[ROW][C]Multiple Linear Regression - Actuals, Interpolation, and Residuals[/C][/ROW]
[ROW][C]Time or Index[/C][C]Actuals[/C][C]InterpolationForecast[/C][C]ResidualsPrediction Error[/C][/ROW]
[ROW][C]1[/C][C]13[/C][C]3.04761904761905[/C][C]9.95238095238095[/C][/ROW]
[ROW][C]2[/C][C]8[/C][C]1.77142857142857[/C][C]6.22857142857143[/C][/ROW]
[ROW][C]3[/C][C]7[/C][C]0.57142857142857[/C][C]6.42857142857143[/C][/ROW]
[ROW][C]4[/C][C]3[/C][C]-0.0285714285714298[/C][C]3.02857142857143[/C][/ROW]
[ROW][C]5[/C][C]3[/C][C]-1.02857142857143[/C][C]4.02857142857143[/C][/ROW]
[ROW][C]6[/C][C]4[/C][C]-0.0285714285714311[/C][C]4.02857142857143[/C][/ROW]
[ROW][C]7[/C][C]4[/C][C]-1.62857142857143[/C][C]5.62857142857143[/C][/ROW]
[ROW][C]8[/C][C]0[/C][C]-1.82857142857143[/C][C]1.82857142857143[/C][/ROW]
[ROW][C]9[/C][C]-4[/C][C]-4[/C][C]6.55074952615742e-16[/C][/ROW]
[ROW][C]10[/C][C]-14[/C][C]-5.82857142857143[/C][C]-8.17142857142857[/C][/ROW]
[ROW][C]11[/C][C]-18[/C][C]-5.42857142857142[/C][C]-12.5714285714286[/C][/ROW]
[ROW][C]12[/C][C]-8[/C][C]-3.22857142857143[/C][C]-4.77142857142857[/C][/ROW]
[ROW][C]13[/C][C]-1[/C][C]1.36190476190476[/C][C]-2.36190476190476[/C][/ROW]
[ROW][C]14[/C][C]1[/C][C]0.085714285714286[/C][C]0.914285714285714[/C][/ROW]
[ROW][C]15[/C][C]2[/C][C]-1.11428571428571[/C][C]3.11428571428571[/C][/ROW]
[ROW][C]16[/C][C]0[/C][C]-1.71428571428571[/C][C]1.71428571428571[/C][/ROW]
[ROW][C]17[/C][C]1[/C][C]-2.71428571428571[/C][C]3.71428571428571[/C][/ROW]
[ROW][C]18[/C][C]0[/C][C]-1.71428571428571[/C][C]1.71428571428571[/C][/ROW]
[ROW][C]19[/C][C]-1[/C][C]-3.31428571428571[/C][C]2.31428571428571[/C][/ROW]
[ROW][C]20[/C][C]-3[/C][C]-3.51428571428571[/C][C]0.514285714285713[/C][/ROW]
[ROW][C]21[/C][C]-3[/C][C]-3.47142857142857[/C][C]0.47142857142857[/C][/ROW]
[ROW][C]22[/C][C]-3[/C][C]-7.51428571428572[/C][C]4.51428571428572[/C][/ROW]
[ROW][C]23[/C][C]-4[/C][C]-7.11428571428571[/C][C]3.11428571428571[/C][/ROW]
[ROW][C]24[/C][C]-8[/C][C]-4.91428571428572[/C][C]-3.08571428571428[/C][/ROW]
[ROW][C]25[/C][C]-9[/C][C]-0.323809523809524[/C][C]-8.67619047619048[/C][/ROW]
[ROW][C]26[/C][C]-13[/C][C]-1.60000000000000[/C][C]-11.4[/C][/ROW]
[ROW][C]27[/C][C]-18[/C][C]-2.8[/C][C]-15.2[/C][/ROW]
[ROW][C]28[/C][C]-11[/C][C]-3.4[/C][C]-7.6[/C][/ROW]
[ROW][C]29[/C][C]-9[/C][C]-4.4[/C][C]-4.6[/C][/ROW]
[ROW][C]30[/C][C]-10[/C][C]-3.4[/C][C]-6.6[/C][/ROW]
[ROW][C]31[/C][C]-13[/C][C]-5[/C][C]-8[/C][/ROW]
[ROW][C]32[/C][C]-11[/C][C]-5.2[/C][C]-5.8[/C][/ROW]
[ROW][C]33[/C][C]-5[/C][C]-5.15714285714286[/C][C]0.157142857142857[/C][/ROW]
[ROW][C]34[/C][C]-15[/C][C]-9.2[/C][C]-5.8[/C][/ROW]
[ROW][C]35[/C][C]-6[/C][C]-8.8[/C][C]2.8[/C][/ROW]
[ROW][C]36[/C][C]-6[/C][C]-6.6[/C][C]0.6[/C][/ROW]
[ROW][C]37[/C][C]-3[/C][C]-2.00952380952381[/C][C]-0.99047619047619[/C][/ROW]
[ROW][C]38[/C][C]-1[/C][C]-3.28571428571428[/C][C]2.28571428571428[/C][/ROW]
[ROW][C]39[/C][C]-3[/C][C]-4.48571428571429[/C][C]1.48571428571429[/C][/ROW]
[ROW][C]40[/C][C]-4[/C][C]-5.08571428571429[/C][C]1.08571428571429[/C][/ROW]
[ROW][C]41[/C][C]-6[/C][C]-6.08571428571429[/C][C]0.0857142857142858[/C][/ROW]
[ROW][C]42[/C][C]0[/C][C]-5.08571428571429[/C][C]5.08571428571429[/C][/ROW]
[ROW][C]43[/C][C]-4[/C][C]-6.68571428571429[/C][C]2.68571428571429[/C][/ROW]
[ROW][C]44[/C][C]-2[/C][C]-6.88571428571429[/C][C]4.88571428571429[/C][/ROW]
[ROW][C]45[/C][C]-2[/C][C]-6.84285714285714[/C][C]4.84285714285714[/C][/ROW]
[ROW][C]46[/C][C]-6[/C][C]-10.8857142857143[/C][C]4.88571428571429[/C][/ROW]
[ROW][C]47[/C][C]-7[/C][C]-10.4857142857143[/C][C]3.48571428571429[/C][/ROW]
[ROW][C]48[/C][C]-6[/C][C]-8.28571428571429[/C][C]2.28571428571429[/C][/ROW]
[ROW][C]49[/C][C]-6[/C][C]-3.6952380952381[/C][C]-2.30476190476190[/C][/ROW]
[ROW][C]50[/C][C]-3[/C][C]-4.97142857142857[/C][C]1.97142857142857[/C][/ROW]
[ROW][C]51[/C][C]-2[/C][C]-6.17142857142857[/C][C]4.17142857142857[/C][/ROW]
[ROW][C]52[/C][C]-5[/C][C]-6.77142857142857[/C][C]1.77142857142857[/C][/ROW]
[ROW][C]53[/C][C]-11[/C][C]-7.77142857142857[/C][C]-3.22857142857143[/C][/ROW]
[ROW][C]54[/C][C]-11[/C][C]-6.77142857142857[/C][C]-4.22857142857143[/C][/ROW]
[ROW][C]55[/C][C]-11[/C][C]-8.37142857142857[/C][C]-2.62857142857143[/C][/ROW]
[ROW][C]56[/C][C]-10[/C][C]-8.57142857142857[/C][C]-1.42857142857143[/C][/ROW]
[ROW][C]57[/C][C]-14[/C][C]-8.52857142857143[/C][C]-5.47142857142857[/C][/ROW]
[ROW][C]58[/C][C]-8[/C][C]-12.5714285714286[/C][C]4.57142857142857[/C][/ROW]
[ROW][C]59[/C][C]-9[/C][C]-12.1714285714286[/C][C]3.17142857142857[/C][/ROW]
[ROW][C]60[/C][C]-5[/C][C]-9.97142857142857[/C][C]4.97142857142857[/C][/ROW]
[ROW][C]61[/C][C]-1[/C][C]-5.38095238095238[/C][C]4.38095238095238[/C][/ROW]
[/TABLE]
Source: https://freestatistics.org/blog/index.php?pk=25819&T=4

Globally Unique Identifier (entire table): ba.freestatistics.org/blog/index.php?pk=25819&T=4

As an alternative you can also use a QR Code:  

The GUIDs for individual cells are displayed in the table below:

Multiple Linear Regression - Actuals, Interpolation, and Residuals
Time or IndexActualsInterpolationForecastResidualsPrediction Error
1133.047619047619059.95238095238095
281.771428571428576.22857142857143
370.571428571428576.42857142857143
43-0.02857142857142983.02857142857143
53-1.028571428571434.02857142857143
64-0.02857142857143114.02857142857143
74-1.628571428571435.62857142857143
80-1.828571428571431.82857142857143
9-4-46.55074952615742e-16
10-14-5.82857142857143-8.17142857142857
11-18-5.42857142857142-12.5714285714286
12-8-3.22857142857143-4.77142857142857
13-11.36190476190476-2.36190476190476
1410.0857142857142860.914285714285714
152-1.114285714285713.11428571428571
160-1.714285714285711.71428571428571
171-2.714285714285713.71428571428571
180-1.714285714285711.71428571428571
19-1-3.314285714285712.31428571428571
20-3-3.514285714285710.514285714285713
21-3-3.471428571428570.47142857142857
22-3-7.514285714285724.51428571428572
23-4-7.114285714285713.11428571428571
24-8-4.91428571428572-3.08571428571428
25-9-0.323809523809524-8.67619047619048
26-13-1.60000000000000-11.4
27-18-2.8-15.2
28-11-3.4-7.6
29-9-4.4-4.6
30-10-3.4-6.6
31-13-5-8
32-11-5.2-5.8
33-5-5.157142857142860.157142857142857
34-15-9.2-5.8
35-6-8.82.8
36-6-6.60.6
37-3-2.00952380952381-0.99047619047619
38-1-3.285714285714282.28571428571428
39-3-4.485714285714291.48571428571429
40-4-5.085714285714291.08571428571429
41-6-6.085714285714290.0857142857142858
420-5.085714285714295.08571428571429
43-4-6.685714285714292.68571428571429
44-2-6.885714285714294.88571428571429
45-2-6.842857142857144.84285714285714
46-6-10.88571428571434.88571428571429
47-7-10.48571428571433.48571428571429
48-6-8.285714285714292.28571428571429
49-6-3.6952380952381-2.30476190476190
50-3-4.971428571428571.97142857142857
51-2-6.171428571428574.17142857142857
52-5-6.771428571428571.77142857142857
53-11-7.77142857142857-3.22857142857143
54-11-6.77142857142857-4.22857142857143
55-11-8.37142857142857-2.62857142857143
56-10-8.57142857142857-1.42857142857143
57-14-8.52857142857143-5.47142857142857
58-8-12.57142857142864.57142857142857
59-9-12.17142857142863.17142857142857
60-5-9.971428571428574.97142857142857
61-1-5.380952380952384.38095238095238


Parameters (Session):
par1 = 1 ; par2 = Include Monthly Dummies ; par3 = Linear Trend ;
Parameters (R input):
par1 = 1 ; par2 = Include Monthly Dummies ; par3 = Linear Trend ;
R code (references can be found in the software module):
library(lattice)
par1 <- as.numeric(par1)
x <- t(y)
k <- length(x[1,])
n <- length(x[,1])
x1 <- cbind(x[,par1], x[,1:k!=par1])
mycolnames <- c(colnames(x)[par1], colnames(x)[1:k!=par1])
colnames(x1) <- mycolnames #colnames(x)[par1]
x <- x1
if (par3 == 'First Differences'){
x2 <- array(0, dim=c(n-1,k), dimnames=list(1:(n-1), paste('(1-B)',colnames(x),sep='')))
for (i in 1:n-1) {
for (j in 1:k) {
x2[i,j] <- x[i+1,j] - x[i,j]
}
}
x <- x2
}
if (par2 == 'Include Monthly Dummies'){
x2 <- array(0, dim=c(n,11), dimnames=list(1:n, paste('M', seq(1:11), sep ='')))
for (i in 1:11){
x2[seq(i,n,12),i] <- 1
}
x <- cbind(x, x2)
}
if (par2 == 'Include Quarterly Dummies'){
x2 <- array(0, dim=c(n,3), dimnames=list(1:n, paste('Q', seq(1:3), sep ='')))
for (i in 1:3){
x2[seq(i,n,4),i] <- 1
}
x <- cbind(x, x2)
}
k <- length(x[1,])
if (par3 == 'Linear Trend'){
x <- cbind(x, c(1:n))
colnames(x)[k+1] <- 't'
}
x
k <- length(x[1,])
df <- as.data.frame(x)
(mylm <- lm(df))
(mysum <- summary(mylm))
bitmap(file='test0.png')
plot(x[,1], type='l', main='Actuals and Interpolation', ylab='value of Actuals and Interpolation (dots)', xlab='time or index')
points(x[,1]-mysum$resid)
grid()
dev.off()
bitmap(file='test1.png')
plot(mysum$resid, type='b', pch=19, main='Residuals', ylab='value of Residuals', xlab='time or index')
grid()
dev.off()
bitmap(file='test2.png')
hist(mysum$resid, main='Residual Histogram', xlab='values of Residuals')
grid()
dev.off()
bitmap(file='test3.png')
densityplot(~mysum$resid,col='black',main='Residual Density Plot', xlab='values of Residuals')
dev.off()
bitmap(file='test4.png')
qqnorm(mysum$resid, main='Residual Normal Q-Q Plot')
grid()
dev.off()
(myerror <- as.ts(mysum$resid))
bitmap(file='test5.png')
dum <- cbind(lag(myerror,k=1),myerror)
dum
dum1 <- dum[2:length(myerror),]
dum1
z <- as.data.frame(dum1)
z
plot(z,main=paste('Residual Lag plot, lowess, and regression line'), ylab='values of Residuals', xlab='lagged values of Residuals')
lines(lowess(z))
abline(lm(z))
grid()
dev.off()
bitmap(file='test6.png')
acf(mysum$resid, lag.max=length(mysum$resid)/2, main='Residual Autocorrelation Function')
grid()
dev.off()
bitmap(file='test7.png')
pacf(mysum$resid, lag.max=length(mysum$resid)/2, main='Residual Partial Autocorrelation Function')
grid()
dev.off()
bitmap(file='test8.png')
opar <- par(mfrow = c(2,2), oma = c(0, 0, 1.1, 0))
plot(mylm, las = 1, sub='Residual Diagnostics')
par(opar)
dev.off()
load(file='createtable')
a<-table.start()
a<-table.row.start(a)
a<-table.element(a, 'Multiple Linear Regression - Estimated Regression Equation', 1, TRUE)
a<-table.row.end(a)
myeq <- colnames(x)[1]
myeq <- paste(myeq, '[t] = ', sep='')
for (i in 1:k){
if (mysum$coefficients[i,1] > 0) myeq <- paste(myeq, '+', '')
myeq <- paste(myeq, mysum$coefficients[i,1], sep=' ')
if (rownames(mysum$coefficients)[i] != '(Intercept)') {
myeq <- paste(myeq, rownames(mysum$coefficients)[i], sep='')
if (rownames(mysum$coefficients)[i] != 't') myeq <- paste(myeq, '[t]', sep='')
}
}
myeq <- paste(myeq, ' + e[t]')
a<-table.row.start(a)
a<-table.element(a, myeq)
a<-table.row.end(a)
a<-table.end(a)
table.save(a,file='mytable1.tab')
a<-table.start()
a<-table.row.start(a)
a<-table.element(a,hyperlink('ols1.htm','Multiple Linear Regression - Ordinary Least Squares',''), 6, TRUE)
a<-table.row.end(a)
a<-table.row.start(a)
a<-table.element(a,'Variable',header=TRUE)
a<-table.element(a,'Parameter',header=TRUE)
a<-table.element(a,'S.D.',header=TRUE)
a<-table.element(a,'T-STAT
H0: parameter = 0',header=TRUE)
a<-table.element(a,'2-tail p-value',header=TRUE)
a<-table.element(a,'1-tail p-value',header=TRUE)
a<-table.row.end(a)
for (i in 1:k){
a<-table.row.start(a)
a<-table.element(a,rownames(mysum$coefficients)[i],header=TRUE)
a<-table.element(a,mysum$coefficients[i,1])
a<-table.element(a, round(mysum$coefficients[i,2],6))
a<-table.element(a, round(mysum$coefficients[i,3],4))
a<-table.element(a, round(mysum$coefficients[i,4],6))
a<-table.element(a, round(mysum$coefficients[i,4]/2,6))
a<-table.row.end(a)
}
a<-table.end(a)
table.save(a,file='mytable2.tab')
a<-table.start()
a<-table.row.start(a)
a<-table.element(a, 'Multiple Linear Regression - Regression Statistics', 2, TRUE)
a<-table.row.end(a)
a<-table.row.start(a)
a<-table.element(a, 'Multiple R',1,TRUE)
a<-table.element(a, sqrt(mysum$r.squared))
a<-table.row.end(a)
a<-table.row.start(a)
a<-table.element(a, 'R-squared',1,TRUE)
a<-table.element(a, mysum$r.squared)
a<-table.row.end(a)
a<-table.row.start(a)
a<-table.element(a, 'Adjusted R-squared',1,TRUE)
a<-table.element(a, mysum$adj.r.squared)
a<-table.row.end(a)
a<-table.row.start(a)
a<-table.element(a, 'F-TEST (value)',1,TRUE)
a<-table.element(a, mysum$fstatistic[1])
a<-table.row.end(a)
a<-table.row.start(a)
a<-table.element(a, 'F-TEST (DF numerator)',1,TRUE)
a<-table.element(a, mysum$fstatistic[2])
a<-table.row.end(a)
a<-table.row.start(a)
a<-table.element(a, 'F-TEST (DF denominator)',1,TRUE)
a<-table.element(a, mysum$fstatistic[3])
a<-table.row.end(a)
a<-table.row.start(a)
a<-table.element(a, 'p-value',1,TRUE)
a<-table.element(a, 1-pf(mysum$fstatistic[1],mysum$fstatistic[2],mysum$fstatistic[3]))
a<-table.row.end(a)
a<-table.row.start(a)
a<-table.element(a, 'Multiple Linear Regression - Residual Statistics', 2, TRUE)
a<-table.row.end(a)
a<-table.row.start(a)
a<-table.element(a, 'Residual Standard Deviation',1,TRUE)
a<-table.element(a, mysum$sigma)
a<-table.row.end(a)
a<-table.row.start(a)
a<-table.element(a, 'Sum Squared Residuals',1,TRUE)
a<-table.element(a, sum(myerror*myerror))
a<-table.row.end(a)
a<-table.end(a)
table.save(a,file='mytable3.tab')
a<-table.start()
a<-table.row.start(a)
a<-table.element(a, 'Multiple Linear Regression - Actuals, Interpolation, and Residuals', 4, TRUE)
a<-table.row.end(a)
a<-table.row.start(a)
a<-table.element(a, 'Time or Index', 1, TRUE)
a<-table.element(a, 'Actuals', 1, TRUE)
a<-table.element(a, 'Interpolation
Forecast', 1, TRUE)
a<-table.element(a, 'Residuals
Prediction Error', 1, TRUE)
a<-table.row.end(a)
for (i in 1:n) {
a<-table.row.start(a)
a<-table.element(a,i, 1, TRUE)
a<-table.element(a,x[i])
a<-table.element(a,x[i]-mysum$resid[i])
a<-table.element(a,mysum$resid[i])
a<-table.row.end(a)
}
a<-table.end(a)
table.save(a,file='mytable4.tab')