Free Statistics

of Irreproducible Research!

Author's title

Author*The author of this computation has been verified*
R Software Modulerwasp_multipleregression.wasp
Title produced by softwareMultiple Regression
Date of computationThu, 27 Nov 2008 08:06:29 -0700
Cite this page as followsStatistical Computations at FreeStatistics.org, Office for Research Development and Education, URL https://freestatistics.org/blog/index.php?v=date/2008/Nov/27/t1227798458zhnvwh2l4g2s5yv.htm/, Retrieved Sun, 19 May 2024 07:19:21 +0000
Statistical Computations at FreeStatistics.org, Office for Research Development and Education, URL https://freestatistics.org/blog/index.php?pk=25831, Retrieved Sun, 19 May 2024 07:19:21 +0000
QR Codes:

Original text written by user:
IsPrivate?No (this computation is public)
User-defined keywords
Estimated Impact134
Family? (F = Feedback message, R = changed R code, M = changed R Module, P = changed Parameters, D = changed Data)
-     [Multiple Regression] [Q1 The Seatbeltlaw] [2007-11-14 19:27:43] [8cd6641b921d30ebe00b648d1481bba0]
F    D    [Multiple Regression] [Workshop 6, Q3] [2008-11-27 15:06:29] [a16dfd7e948381d8b6391003c5d09447] [Current]
Feedback Forum
2008-11-30 15:37:53 [Stephanie Vanderlinden] [reply
Deze vraag had ik duidelijker en uitgebreider kunnen oplossen en verklaren. De uitleg bij de grafieken is zeer miniem.
2008-11-30 16:43:19 [Lana Van Wesemael] [reply
De student maakt hier een foutje betreffende de p-waardes. Wanneerde p-waarde kleiner is dan 5% dan is het verschil ten opzichte van de referentiemaand significant. In de tabel van de student kan men zien dat het verschil soms wel en dikwijls niet significant is.
In de tweede tabel van de student kan men aflezen dat 46% van de schommelingen verklaard kan worden aan de hand van het model.
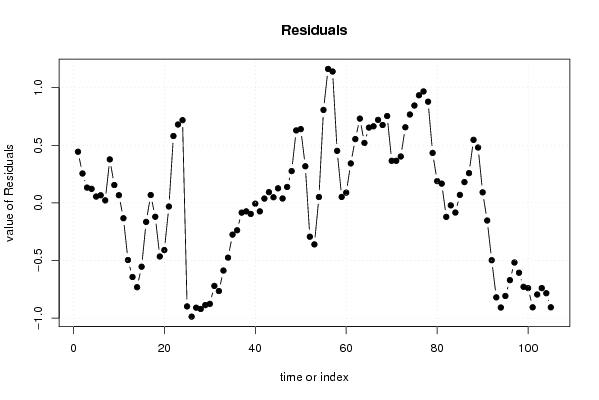
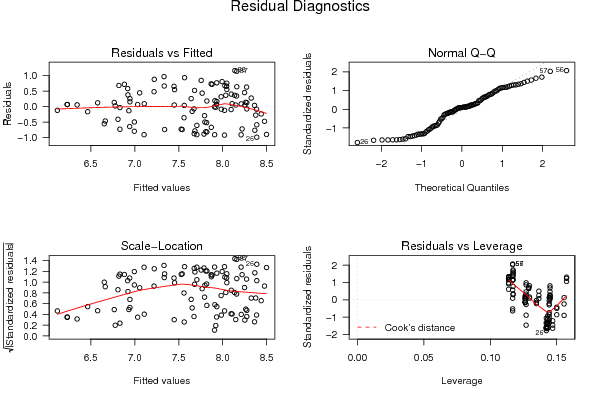
- residuals: aangzien de residuals niet rond nul liggen is het model voor verbetering vatbaar.
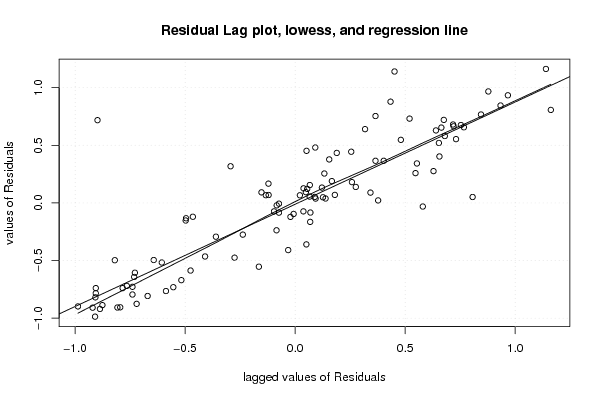
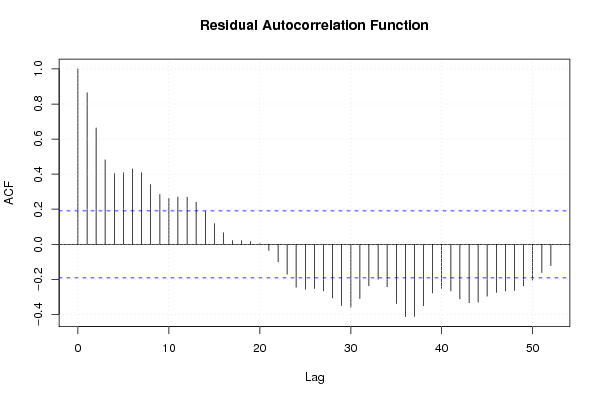
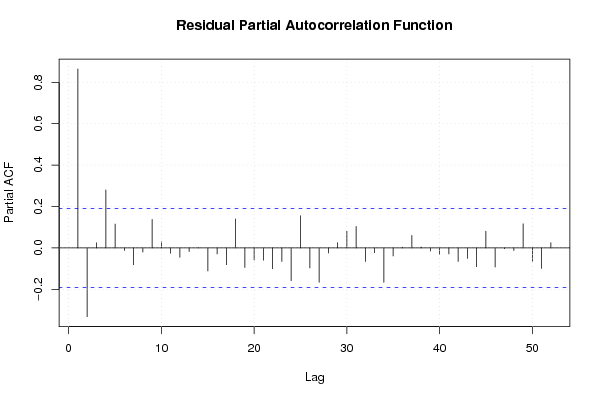
- residual autocorrelation:hier kan ik nog aan toevoegen dat er sprake is van autocorrelatie, positieve waarden worden gevolgd door positieve waarden en omgekeerd. Dus het model kan nog verbeterd worden.
2008-12-01 13:59:34 [Stefan Temmerman] [reply
De gebeurtenis van de invoering van de euro heeft volgens het model als gevolg dat de werkloosheid daalt. De H0 wordt hier verworpen voor deze variabele, omdat de T-stat waarde niet tussen het interval -2, 2 ligt, en ook de 2-tailed value 0 is (omdat de invoering een positief of negatief effect zou kunnen hebben). De seasonal dummies kunnen bijna allemaal aan het toeval gewezen worden, gezien de T-STAT en de p-waarden. De studente zegt hier dat een waarneming enkel significant is als de p-value verschilt van 0. Dit is niet waar, het is als de waarde groter is als 5%, dat je deze verwerpt. Ook verkeerd geïnterpreteerd is de variabelen M1 enz te linken met de invoering van de euro. Het is alleen de variabele ‘x’ die de invoering weerspiegeld. De lange termijn trend stelt, zoals hier gezegd, niet veel voor. Het besluit kon uitgebreider. Het is hier geen goed model omdat de gemiddelden niet constant gelijk zijn aan 0, en dat er geen autocorrelatie aanwezig mag zijn.

Post a new message
Dataseries X:
7,5	0
7,2	0
6,9	0
6,7	0
6,4	0
6,3	0
6,8	0
7,3	0
7,1	0
7,1	0
6,8	0
6,5	0
6,3	0
6,1	0
6,1	0
6,3	0
6,3	0
6	0
6,2	0
6,4	0
6,8	0
7,5	0
7,5	0
7,6	0
7,6	1
7,4	1
7,3	1
7,1	1
6,9	1
6,8	1
7,5	1
7,6	1
7,8	1
8	1
8,1	1
8,2	1
8,3	1
8,2	1
8	1
7,9	1
7,6	1
7,6	1
8,2	1
8,3	1
8,4	1
8,4	1
8,4	1
8,6	1
8,9	1
8,8	1
8,3	1
7,5	1
7,2	1
7,5	1
8,8	1
9,3	1
9,3	1
8,7	1
8,2	1
8,3	1
8,5	1
8,6	1
8,6	1
8,2	1
8,1	1
8	1
8,6	1
8,7	1
8,8	1
8,5	1
8,4	1
8,5	1
8,7	1
8,7	1
8,6	1
8,5	1
8,3	1
8,1	1
8,2	1
8,1	1
8,1	1
7,9	1
7,9	1
7,9	1
8	1
8	1
7,9	1
8	1
7,7	1
7,2	1
7,5	1
7,3	1
7	1
7	1
7	1
7,2	1
7,3	1
7,1	1
6,8	1
6,6	1
6,2	1
6,2	1
6,8	1
6,9	1
6,8	1


Summary of computational transaction
Raw Inputview raw input (R code)
Raw Outputview raw output of R engine
Computing time3 seconds
R Server'Gwilym Jenkins' @ 72.249.127.135

\begin{tabular}{lllllllll}
\hline
Summary of computational transaction \tabularnewline
Raw Input & view raw input (R code)  \tabularnewline
Raw Output & view raw output of R engine  \tabularnewline
Computing time & 3 seconds \tabularnewline
R Server & 'Gwilym Jenkins' @ 72.249.127.135 \tabularnewline
\hline
\end{tabular}
%Source: https://freestatistics.org/blog/index.php?pk=25831&T=0

[TABLE]
[ROW][C]Summary of computational transaction[/C][/ROW]
[ROW][C]Raw Input[/C][C]view raw input (R code) [/C][/ROW]
[ROW][C]Raw Output[/C][C]view raw output of R engine [/C][/ROW]
[ROW][C]Computing time[/C][C]3 seconds[/C][/ROW]
[ROW][C]R Server[/C][C]'Gwilym Jenkins' @ 72.249.127.135[/C][/ROW]
[/TABLE]
Source: https://freestatistics.org/blog/index.php?pk=25831&T=0

Globally Unique Identifier (entire table): ba.freestatistics.org/blog/index.php?pk=25831&T=0

As an alternative you can also use a QR Code:  

The GUIDs for individual cells are displayed in the table below:

Summary of computational transaction
Raw Inputview raw input (R code)
Raw Outputview raw output of R engine
Computing time3 seconds
R Server'Gwilym Jenkins' @ 72.249.127.135


Multiple Linear Regression - Estimated Regression Equation
y[t] = + 7.10898437500001 + 1.66901041666666x[t] -0.0436523437499963M1[t] -0.145305266203702M2[t] -0.313624855324074M3[t] -0.493055555555555M4[t] -0.716930700231482M5[t] -0.818583622685185M6[t] -0.264680989583333M7[t] -0.110778356481481M8[t] -0.0790979456018516M9[t] + 0.0185836226851854M10[t] -0.0719581886574073M11[t] -0.0094581886574074t + e[t]

\begin{tabular}{lllllllll}
\hline
Multiple Linear Regression - Estimated Regression Equation \tabularnewline
y[t] =  +  7.10898437500001 +  1.66901041666666x[t] -0.0436523437499963M1[t] -0.145305266203702M2[t] -0.313624855324074M3[t] -0.493055555555555M4[t] -0.716930700231482M5[t] -0.818583622685185M6[t] -0.264680989583333M7[t] -0.110778356481481M8[t] -0.0790979456018516M9[t] +  0.0185836226851854M10[t] -0.0719581886574073M11[t] -0.0094581886574074t  + e[t] \tabularnewline
\hline
\end{tabular}
%Source: https://freestatistics.org/blog/index.php?pk=25831&T=1

[TABLE]
[ROW][C]Multiple Linear Regression - Estimated Regression Equation[/C][/ROW]
[ROW][C]y[t] =  +  7.10898437500001 +  1.66901041666666x[t] -0.0436523437499963M1[t] -0.145305266203702M2[t] -0.313624855324074M3[t] -0.493055555555555M4[t] -0.716930700231482M5[t] -0.818583622685185M6[t] -0.264680989583333M7[t] -0.110778356481481M8[t] -0.0790979456018516M9[t] +  0.0185836226851854M10[t] -0.0719581886574073M11[t] -0.0094581886574074t  + e[t][/C][/ROW]
[/TABLE]
Source: https://freestatistics.org/blog/index.php?pk=25831&T=1

Globally Unique Identifier (entire table): ba.freestatistics.org/blog/index.php?pk=25831&T=1

As an alternative you can also use a QR Code:  

The GUIDs for individual cells are displayed in the table below:

Multiple Linear Regression - Estimated Regression Equation
y[t] = + 7.10898437500001 + 1.66901041666666x[t] -0.0436523437499963M1[t] -0.145305266203702M2[t] -0.313624855324074M3[t] -0.493055555555555M4[t] -0.716930700231482M5[t] -0.818583622685185M6[t] -0.264680989583333M7[t] -0.110778356481481M8[t] -0.0790979456018516M9[t] + 0.0185836226851854M10[t] -0.0719581886574073M11[t] -0.0094581886574074t + e[t]


Multiple Linear Regression - Ordinary Least Squares
VariableParameterS.D.T-STATH0: parameter = 02-tail p-value1-tail p-value
(Intercept)7.108984375000010.2397329.654100
x1.669010416666660.2036938.193700
M1-0.04365234374999630.291677-0.14970.8813640.440682
M2-0.1453052662037020.291513-0.49850.6193680.309684
M3-0.3136248553240740.291377-1.07640.2846140.142307
M4-0.4930555555555550.291268-1.69280.0939170.046958
M5-0.7169307002314820.291187-2.46210.0156960.007848
M6-0.8185836226851850.291133-2.81170.0060350.003018
M7-0.2646809895833330.291106-0.90920.3656340.182817
M8-0.1107783564814810.291108-0.38050.7044310.352215
M9-0.07909794560185160.291136-0.27170.7864780.393239
M100.01858362268518540.299570.0620.9506720.475336
M11-0.07195818865740730.29953-0.24020.8106870.405343
t-0.00945818865740740.002829-3.34320.0012040.000602

\begin{tabular}{lllllllll}
\hline
Multiple Linear Regression - Ordinary Least Squares \tabularnewline
Variable & Parameter & S.D. & T-STATH0: parameter = 0 & 2-tail p-value & 1-tail p-value \tabularnewline
(Intercept) & 7.10898437500001 & 0.23973 & 29.6541 & 0 & 0 \tabularnewline
x & 1.66901041666666 & 0.203693 & 8.1937 & 0 & 0 \tabularnewline
M1 & -0.0436523437499963 & 0.291677 & -0.1497 & 0.881364 & 0.440682 \tabularnewline
M2 & -0.145305266203702 & 0.291513 & -0.4985 & 0.619368 & 0.309684 \tabularnewline
M3 & -0.313624855324074 & 0.291377 & -1.0764 & 0.284614 & 0.142307 \tabularnewline
M4 & -0.493055555555555 & 0.291268 & -1.6928 & 0.093917 & 0.046958 \tabularnewline
M5 & -0.716930700231482 & 0.291187 & -2.4621 & 0.015696 & 0.007848 \tabularnewline
M6 & -0.818583622685185 & 0.291133 & -2.8117 & 0.006035 & 0.003018 \tabularnewline
M7 & -0.264680989583333 & 0.291106 & -0.9092 & 0.365634 & 0.182817 \tabularnewline
M8 & -0.110778356481481 & 0.291108 & -0.3805 & 0.704431 & 0.352215 \tabularnewline
M9 & -0.0790979456018516 & 0.291136 & -0.2717 & 0.786478 & 0.393239 \tabularnewline
M10 & 0.0185836226851854 & 0.29957 & 0.062 & 0.950672 & 0.475336 \tabularnewline
M11 & -0.0719581886574073 & 0.29953 & -0.2402 & 0.810687 & 0.405343 \tabularnewline
t & -0.0094581886574074 & 0.002829 & -3.3432 & 0.001204 & 0.000602 \tabularnewline
\hline
\end{tabular}
%Source: https://freestatistics.org/blog/index.php?pk=25831&T=2

[TABLE]
[ROW][C]Multiple Linear Regression - Ordinary Least Squares[/C][/ROW]
[ROW][C]Variable[/C][C]Parameter[/C][C]S.D.[/C][C]T-STATH0: parameter = 0[/C][C]2-tail p-value[/C][C]1-tail p-value[/C][/ROW]
[ROW][C](Intercept)[/C][C]7.10898437500001[/C][C]0.23973[/C][C]29.6541[/C][C]0[/C][C]0[/C][/ROW]
[ROW][C]x[/C][C]1.66901041666666[/C][C]0.203693[/C][C]8.1937[/C][C]0[/C][C]0[/C][/ROW]
[ROW][C]M1[/C][C]-0.0436523437499963[/C][C]0.291677[/C][C]-0.1497[/C][C]0.881364[/C][C]0.440682[/C][/ROW]
[ROW][C]M2[/C][C]-0.145305266203702[/C][C]0.291513[/C][C]-0.4985[/C][C]0.619368[/C][C]0.309684[/C][/ROW]
[ROW][C]M3[/C][C]-0.313624855324074[/C][C]0.291377[/C][C]-1.0764[/C][C]0.284614[/C][C]0.142307[/C][/ROW]
[ROW][C]M4[/C][C]-0.493055555555555[/C][C]0.291268[/C][C]-1.6928[/C][C]0.093917[/C][C]0.046958[/C][/ROW]
[ROW][C]M5[/C][C]-0.716930700231482[/C][C]0.291187[/C][C]-2.4621[/C][C]0.015696[/C][C]0.007848[/C][/ROW]
[ROW][C]M6[/C][C]-0.818583622685185[/C][C]0.291133[/C][C]-2.8117[/C][C]0.006035[/C][C]0.003018[/C][/ROW]
[ROW][C]M7[/C][C]-0.264680989583333[/C][C]0.291106[/C][C]-0.9092[/C][C]0.365634[/C][C]0.182817[/C][/ROW]
[ROW][C]M8[/C][C]-0.110778356481481[/C][C]0.291108[/C][C]-0.3805[/C][C]0.704431[/C][C]0.352215[/C][/ROW]
[ROW][C]M9[/C][C]-0.0790979456018516[/C][C]0.291136[/C][C]-0.2717[/C][C]0.786478[/C][C]0.393239[/C][/ROW]
[ROW][C]M10[/C][C]0.0185836226851854[/C][C]0.29957[/C][C]0.062[/C][C]0.950672[/C][C]0.475336[/C][/ROW]
[ROW][C]M11[/C][C]-0.0719581886574073[/C][C]0.29953[/C][C]-0.2402[/C][C]0.810687[/C][C]0.405343[/C][/ROW]
[ROW][C]t[/C][C]-0.0094581886574074[/C][C]0.002829[/C][C]-3.3432[/C][C]0.001204[/C][C]0.000602[/C][/ROW]
[/TABLE]
Source: https://freestatistics.org/blog/index.php?pk=25831&T=2

Globally Unique Identifier (entire table): ba.freestatistics.org/blog/index.php?pk=25831&T=2

As an alternative you can also use a QR Code:  

The GUIDs for individual cells are displayed in the table below:

Multiple Linear Regression - Ordinary Least Squares
VariableParameterS.D.T-STATH0: parameter = 02-tail p-value1-tail p-value
(Intercept)7.108984375000010.2397329.654100
x1.669010416666660.2036938.193700
M1-0.04365234374999630.291677-0.14970.8813640.440682
M2-0.1453052662037020.291513-0.49850.6193680.309684
M3-0.3136248553240740.291377-1.07640.2846140.142307
M4-0.4930555555555550.291268-1.69280.0939170.046958
M5-0.7169307002314820.291187-2.46210.0156960.007848
M6-0.8185836226851850.291133-2.81170.0060350.003018
M7-0.2646809895833330.291106-0.90920.3656340.182817
M8-0.1107783564814810.291108-0.38050.7044310.352215
M9-0.07909794560185160.291136-0.27170.7864780.393239
M100.01858362268518540.299570.0620.9506720.475336
M11-0.07195818865740730.29953-0.24020.8106870.405343
t-0.00945818865740740.002829-3.34320.0012040.000602


Multiple Linear Regression - Regression Statistics
Multiple R0.727461330250513
R-squared0.529199987009846
Adjusted R-squared0.461942842296967
F-TEST (value)7.8683088505913
F-TEST (DF numerator)13
F-TEST (DF denominator)91
p-value2.91432322718777e-10
Multiple Linear Regression - Residual Statistics
Residual Standard Deviation0.599033191292813
Sum Squared Residuals32.6545095486112

\begin{tabular}{lllllllll}
\hline
Multiple Linear Regression - Regression Statistics \tabularnewline
Multiple R & 0.727461330250513 \tabularnewline
R-squared & 0.529199987009846 \tabularnewline
Adjusted R-squared & 0.461942842296967 \tabularnewline
F-TEST (value) & 7.8683088505913 \tabularnewline
F-TEST (DF numerator) & 13 \tabularnewline
F-TEST (DF denominator) & 91 \tabularnewline
p-value & 2.91432322718777e-10 \tabularnewline
Multiple Linear Regression - Residual Statistics \tabularnewline
Residual Standard Deviation & 0.599033191292813 \tabularnewline
Sum Squared Residuals & 32.6545095486112 \tabularnewline
\hline
\end{tabular}
%Source: https://freestatistics.org/blog/index.php?pk=25831&T=3

[TABLE]
[ROW][C]Multiple Linear Regression - Regression Statistics[/C][/ROW]
[ROW][C]Multiple R[/C][C]0.727461330250513[/C][/ROW]
[ROW][C]R-squared[/C][C]0.529199987009846[/C][/ROW]
[ROW][C]Adjusted R-squared[/C][C]0.461942842296967[/C][/ROW]
[ROW][C]F-TEST (value)[/C][C]7.8683088505913[/C][/ROW]
[ROW][C]F-TEST (DF numerator)[/C][C]13[/C][/ROW]
[ROW][C]F-TEST (DF denominator)[/C][C]91[/C][/ROW]
[ROW][C]p-value[/C][C]2.91432322718777e-10[/C][/ROW]
[ROW][C]Multiple Linear Regression - Residual Statistics[/C][/ROW]
[ROW][C]Residual Standard Deviation[/C][C]0.599033191292813[/C][/ROW]
[ROW][C]Sum Squared Residuals[/C][C]32.6545095486112[/C][/ROW]
[/TABLE]
Source: https://freestatistics.org/blog/index.php?pk=25831&T=3

Globally Unique Identifier (entire table): ba.freestatistics.org/blog/index.php?pk=25831&T=3

As an alternative you can also use a QR Code:  

The GUIDs for individual cells are displayed in the table below:

Multiple Linear Regression - Regression Statistics
Multiple R0.727461330250513
R-squared0.529199987009846
Adjusted R-squared0.461942842296967
F-TEST (value)7.8683088505913
F-TEST (DF numerator)13
F-TEST (DF denominator)91
p-value2.91432322718777e-10
Multiple Linear Regression - Residual Statistics
Residual Standard Deviation0.599033191292813
Sum Squared Residuals32.6545095486112


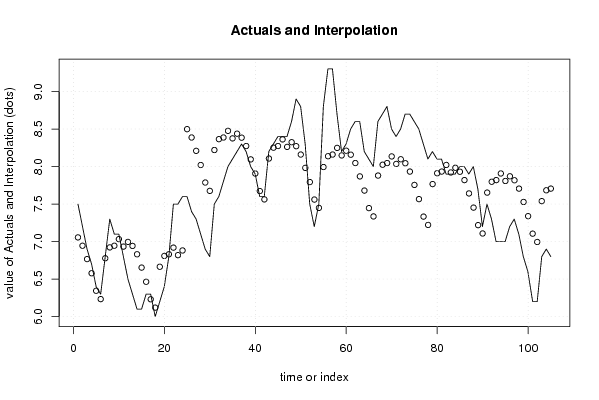
Multiple Linear Regression - Actuals, Interpolation, and Residuals
Time or IndexActualsInterpolationForecastResidualsPrediction Error
17.57.055873842592570.444126157407434
27.26.944762731481470.255237268518531
36.96.766984953703710.133015046296294
46.76.578096064814820.121903935185183
56.46.344762731481480.0552372685185177
66.36.233651620370370.066348379629627
76.86.778096064814820.0219039351851845
87.36.922540509259260.377459490740739
97.16.944762731481480.155237268518516
107.17.032986111111110.0670138888888871
116.86.93298611111111-0.132986111111113
126.56.99548611111111-0.495486111111112
136.36.94237557870371-0.642375578703709
146.16.8312644675926-0.731264467592597
156.16.65348668981482-0.553486689814817
166.36.46459780092593-0.164597800925927
176.36.231264467592590.0687355324074054
1866.12015335648148-0.120153356481483
196.26.66459780092593-0.464597800925928
206.46.80904224537037-0.409042245370372
216.86.8312644675926-0.0312644675925944
227.56.919487847222220.580512152777776
237.56.819487847222220.680512152777776
247.66.881987847222220.718012152777776
257.68.49788773148148-0.897887731481484
267.48.38677662037037-0.98677662037037
277.38.2089988425926-0.908998842592592
287.18.0201099537037-0.920109953703703
296.97.78677662037037-0.88677662037037
306.87.67566550925926-0.875665509259258
317.58.2201099537037-0.720109953703703
327.68.36455439814815-0.764554398148148
337.88.38677662037037-0.58677662037037
3488.475-0.474999999999999
358.18.375-0.275000000000000
368.28.4375-0.2375
378.38.3843894675926-0.0843894675925945
388.28.27327835648148-0.073278356481483
3988.0955005787037-0.095500578703703
407.97.90661168981481-0.00661168981481376
417.67.67327835648148-0.0732783564814813
427.67.562167245370370.03783275462963
438.28.106611689814810.093388310185185
448.38.251056134259260.0489438657407421
458.48.273278356481480.126721643518519
468.48.361501736111110.0384982638888898
478.48.261501736111110.138498263888890
488.68.324001736111110.275998263888889
498.98.270891203703710.629108796296294
508.88.15978009259260.640219907407407
518.37.982002314814810.317997685185187
527.57.79311342592593-0.293113425925925
537.27.55978009259259-0.359780092592592
547.57.448668981481480.0513310185185192
558.87.993113425925930.806886574074075
569.38.137557870370371.16244212962963
579.38.15978009259261.14021990740741
588.78.248003472222220.451996527777777
598.28.148003472222220.0519965277777777
608.38.210503472222220.0894965277777792
618.58.157392939814820.342607060185183
628.68.04628182870370.553718171296295
638.67.868504050925930.731495949074074
648.27.679615162037040.520384837962963
658.17.44628182870370.653718171296296
6687.335170717592590.664829282407408
678.67.879615162037040.720384837962963
688.78.024059606481480.675940393518518
698.88.04628182870370.753718171296297
708.58.134505208333330.365494791666667
718.48.034505208333330.365494791666668
728.58.097005208333330.402994791666667
738.78.043894675925930.65610532407407
748.77.932783564814820.767216435185183
758.67.755005787037040.844994212962963
768.57.566116898148150.933883101851852
778.37.332783564814810.967216435185186
788.17.22167245370370.878327546296297
798.27.766116898148150.433883101851852
808.17.91056134259260.189438657407407
818.17.932783564814810.167216435185185
827.98.02100694444444-0.121006944444444
837.97.92100694444444-0.0210069444444437
847.97.98350694444444-0.0835069444444436
8587.930396412037040.0696035879629601
8687.819285300925930.180714699074073
877.97.641507523148150.258492476851853
8887.452618634259260.547381365740741
897.77.219285300925930.480714699074074
907.27.108174189814810.0918258101851858
917.57.65261863425926-0.152618634259259
927.37.7970630787037-0.497063078703703
9377.81928530092593-0.819285300925926
9477.90750868055556-0.907508680555555
9577.80750868055556-0.807508680555555
967.27.87000868055556-0.670008680555555
977.37.81689814814815-0.516898148148151
987.17.70578703703704-0.605787037037039
996.87.52800925925926-0.728009259259259
1006.67.33912037037037-0.73912037037037
1016.27.10578703703704-0.905787037037037
1026.26.99467592592593-0.794675925925925
1036.87.53912037037037-0.73912037037037
1046.97.68356481481481-0.783564814814814
1056.87.70578703703704-0.905787037037037

\begin{tabular}{lllllllll}
\hline
Multiple Linear Regression - Actuals, Interpolation, and Residuals \tabularnewline
Time or Index & Actuals & InterpolationForecast & ResidualsPrediction Error \tabularnewline
1 & 7.5 & 7.05587384259257 & 0.444126157407434 \tabularnewline
2 & 7.2 & 6.94476273148147 & 0.255237268518531 \tabularnewline
3 & 6.9 & 6.76698495370371 & 0.133015046296294 \tabularnewline
4 & 6.7 & 6.57809606481482 & 0.121903935185183 \tabularnewline
5 & 6.4 & 6.34476273148148 & 0.0552372685185177 \tabularnewline
6 & 6.3 & 6.23365162037037 & 0.066348379629627 \tabularnewline
7 & 6.8 & 6.77809606481482 & 0.0219039351851845 \tabularnewline
8 & 7.3 & 6.92254050925926 & 0.377459490740739 \tabularnewline
9 & 7.1 & 6.94476273148148 & 0.155237268518516 \tabularnewline
10 & 7.1 & 7.03298611111111 & 0.0670138888888871 \tabularnewline
11 & 6.8 & 6.93298611111111 & -0.132986111111113 \tabularnewline
12 & 6.5 & 6.99548611111111 & -0.495486111111112 \tabularnewline
13 & 6.3 & 6.94237557870371 & -0.642375578703709 \tabularnewline
14 & 6.1 & 6.8312644675926 & -0.731264467592597 \tabularnewline
15 & 6.1 & 6.65348668981482 & -0.553486689814817 \tabularnewline
16 & 6.3 & 6.46459780092593 & -0.164597800925927 \tabularnewline
17 & 6.3 & 6.23126446759259 & 0.0687355324074054 \tabularnewline
18 & 6 & 6.12015335648148 & -0.120153356481483 \tabularnewline
19 & 6.2 & 6.66459780092593 & -0.464597800925928 \tabularnewline
20 & 6.4 & 6.80904224537037 & -0.409042245370372 \tabularnewline
21 & 6.8 & 6.8312644675926 & -0.0312644675925944 \tabularnewline
22 & 7.5 & 6.91948784722222 & 0.580512152777776 \tabularnewline
23 & 7.5 & 6.81948784722222 & 0.680512152777776 \tabularnewline
24 & 7.6 & 6.88198784722222 & 0.718012152777776 \tabularnewline
25 & 7.6 & 8.49788773148148 & -0.897887731481484 \tabularnewline
26 & 7.4 & 8.38677662037037 & -0.98677662037037 \tabularnewline
27 & 7.3 & 8.2089988425926 & -0.908998842592592 \tabularnewline
28 & 7.1 & 8.0201099537037 & -0.920109953703703 \tabularnewline
29 & 6.9 & 7.78677662037037 & -0.88677662037037 \tabularnewline
30 & 6.8 & 7.67566550925926 & -0.875665509259258 \tabularnewline
31 & 7.5 & 8.2201099537037 & -0.720109953703703 \tabularnewline
32 & 7.6 & 8.36455439814815 & -0.764554398148148 \tabularnewline
33 & 7.8 & 8.38677662037037 & -0.58677662037037 \tabularnewline
34 & 8 & 8.475 & -0.474999999999999 \tabularnewline
35 & 8.1 & 8.375 & -0.275000000000000 \tabularnewline
36 & 8.2 & 8.4375 & -0.2375 \tabularnewline
37 & 8.3 & 8.3843894675926 & -0.0843894675925945 \tabularnewline
38 & 8.2 & 8.27327835648148 & -0.073278356481483 \tabularnewline
39 & 8 & 8.0955005787037 & -0.095500578703703 \tabularnewline
40 & 7.9 & 7.90661168981481 & -0.00661168981481376 \tabularnewline
41 & 7.6 & 7.67327835648148 & -0.0732783564814813 \tabularnewline
42 & 7.6 & 7.56216724537037 & 0.03783275462963 \tabularnewline
43 & 8.2 & 8.10661168981481 & 0.093388310185185 \tabularnewline
44 & 8.3 & 8.25105613425926 & 0.0489438657407421 \tabularnewline
45 & 8.4 & 8.27327835648148 & 0.126721643518519 \tabularnewline
46 & 8.4 & 8.36150173611111 & 0.0384982638888898 \tabularnewline
47 & 8.4 & 8.26150173611111 & 0.138498263888890 \tabularnewline
48 & 8.6 & 8.32400173611111 & 0.275998263888889 \tabularnewline
49 & 8.9 & 8.27089120370371 & 0.629108796296294 \tabularnewline
50 & 8.8 & 8.1597800925926 & 0.640219907407407 \tabularnewline
51 & 8.3 & 7.98200231481481 & 0.317997685185187 \tabularnewline
52 & 7.5 & 7.79311342592593 & -0.293113425925925 \tabularnewline
53 & 7.2 & 7.55978009259259 & -0.359780092592592 \tabularnewline
54 & 7.5 & 7.44866898148148 & 0.0513310185185192 \tabularnewline
55 & 8.8 & 7.99311342592593 & 0.806886574074075 \tabularnewline
56 & 9.3 & 8.13755787037037 & 1.16244212962963 \tabularnewline
57 & 9.3 & 8.1597800925926 & 1.14021990740741 \tabularnewline
58 & 8.7 & 8.24800347222222 & 0.451996527777777 \tabularnewline
59 & 8.2 & 8.14800347222222 & 0.0519965277777777 \tabularnewline
60 & 8.3 & 8.21050347222222 & 0.0894965277777792 \tabularnewline
61 & 8.5 & 8.15739293981482 & 0.342607060185183 \tabularnewline
62 & 8.6 & 8.0462818287037 & 0.553718171296295 \tabularnewline
63 & 8.6 & 7.86850405092593 & 0.731495949074074 \tabularnewline
64 & 8.2 & 7.67961516203704 & 0.520384837962963 \tabularnewline
65 & 8.1 & 7.4462818287037 & 0.653718171296296 \tabularnewline
66 & 8 & 7.33517071759259 & 0.664829282407408 \tabularnewline
67 & 8.6 & 7.87961516203704 & 0.720384837962963 \tabularnewline
68 & 8.7 & 8.02405960648148 & 0.675940393518518 \tabularnewline
69 & 8.8 & 8.0462818287037 & 0.753718171296297 \tabularnewline
70 & 8.5 & 8.13450520833333 & 0.365494791666667 \tabularnewline
71 & 8.4 & 8.03450520833333 & 0.365494791666668 \tabularnewline
72 & 8.5 & 8.09700520833333 & 0.402994791666667 \tabularnewline
73 & 8.7 & 8.04389467592593 & 0.65610532407407 \tabularnewline
74 & 8.7 & 7.93278356481482 & 0.767216435185183 \tabularnewline
75 & 8.6 & 7.75500578703704 & 0.844994212962963 \tabularnewline
76 & 8.5 & 7.56611689814815 & 0.933883101851852 \tabularnewline
77 & 8.3 & 7.33278356481481 & 0.967216435185186 \tabularnewline
78 & 8.1 & 7.2216724537037 & 0.878327546296297 \tabularnewline
79 & 8.2 & 7.76611689814815 & 0.433883101851852 \tabularnewline
80 & 8.1 & 7.9105613425926 & 0.189438657407407 \tabularnewline
81 & 8.1 & 7.93278356481481 & 0.167216435185185 \tabularnewline
82 & 7.9 & 8.02100694444444 & -0.121006944444444 \tabularnewline
83 & 7.9 & 7.92100694444444 & -0.0210069444444437 \tabularnewline
84 & 7.9 & 7.98350694444444 & -0.0835069444444436 \tabularnewline
85 & 8 & 7.93039641203704 & 0.0696035879629601 \tabularnewline
86 & 8 & 7.81928530092593 & 0.180714699074073 \tabularnewline
87 & 7.9 & 7.64150752314815 & 0.258492476851853 \tabularnewline
88 & 8 & 7.45261863425926 & 0.547381365740741 \tabularnewline
89 & 7.7 & 7.21928530092593 & 0.480714699074074 \tabularnewline
90 & 7.2 & 7.10817418981481 & 0.0918258101851858 \tabularnewline
91 & 7.5 & 7.65261863425926 & -0.152618634259259 \tabularnewline
92 & 7.3 & 7.7970630787037 & -0.497063078703703 \tabularnewline
93 & 7 & 7.81928530092593 & -0.819285300925926 \tabularnewline
94 & 7 & 7.90750868055556 & -0.907508680555555 \tabularnewline
95 & 7 & 7.80750868055556 & -0.807508680555555 \tabularnewline
96 & 7.2 & 7.87000868055556 & -0.670008680555555 \tabularnewline
97 & 7.3 & 7.81689814814815 & -0.516898148148151 \tabularnewline
98 & 7.1 & 7.70578703703704 & -0.605787037037039 \tabularnewline
99 & 6.8 & 7.52800925925926 & -0.728009259259259 \tabularnewline
100 & 6.6 & 7.33912037037037 & -0.73912037037037 \tabularnewline
101 & 6.2 & 7.10578703703704 & -0.905787037037037 \tabularnewline
102 & 6.2 & 6.99467592592593 & -0.794675925925925 \tabularnewline
103 & 6.8 & 7.53912037037037 & -0.73912037037037 \tabularnewline
104 & 6.9 & 7.68356481481481 & -0.783564814814814 \tabularnewline
105 & 6.8 & 7.70578703703704 & -0.905787037037037 \tabularnewline
\hline
\end{tabular}
%Source: https://freestatistics.org/blog/index.php?pk=25831&T=4

[TABLE]
[ROW][C]Multiple Linear Regression - Actuals, Interpolation, and Residuals[/C][/ROW]
[ROW][C]Time or Index[/C][C]Actuals[/C][C]InterpolationForecast[/C][C]ResidualsPrediction Error[/C][/ROW]
[ROW][C]1[/C][C]7.5[/C][C]7.05587384259257[/C][C]0.444126157407434[/C][/ROW]
[ROW][C]2[/C][C]7.2[/C][C]6.94476273148147[/C][C]0.255237268518531[/C][/ROW]
[ROW][C]3[/C][C]6.9[/C][C]6.76698495370371[/C][C]0.133015046296294[/C][/ROW]
[ROW][C]4[/C][C]6.7[/C][C]6.57809606481482[/C][C]0.121903935185183[/C][/ROW]
[ROW][C]5[/C][C]6.4[/C][C]6.34476273148148[/C][C]0.0552372685185177[/C][/ROW]
[ROW][C]6[/C][C]6.3[/C][C]6.23365162037037[/C][C]0.066348379629627[/C][/ROW]
[ROW][C]7[/C][C]6.8[/C][C]6.77809606481482[/C][C]0.0219039351851845[/C][/ROW]
[ROW][C]8[/C][C]7.3[/C][C]6.92254050925926[/C][C]0.377459490740739[/C][/ROW]
[ROW][C]9[/C][C]7.1[/C][C]6.94476273148148[/C][C]0.155237268518516[/C][/ROW]
[ROW][C]10[/C][C]7.1[/C][C]7.03298611111111[/C][C]0.0670138888888871[/C][/ROW]
[ROW][C]11[/C][C]6.8[/C][C]6.93298611111111[/C][C]-0.132986111111113[/C][/ROW]
[ROW][C]12[/C][C]6.5[/C][C]6.99548611111111[/C][C]-0.495486111111112[/C][/ROW]
[ROW][C]13[/C][C]6.3[/C][C]6.94237557870371[/C][C]-0.642375578703709[/C][/ROW]
[ROW][C]14[/C][C]6.1[/C][C]6.8312644675926[/C][C]-0.731264467592597[/C][/ROW]
[ROW][C]15[/C][C]6.1[/C][C]6.65348668981482[/C][C]-0.553486689814817[/C][/ROW]
[ROW][C]16[/C][C]6.3[/C][C]6.46459780092593[/C][C]-0.164597800925927[/C][/ROW]
[ROW][C]17[/C][C]6.3[/C][C]6.23126446759259[/C][C]0.0687355324074054[/C][/ROW]
[ROW][C]18[/C][C]6[/C][C]6.12015335648148[/C][C]-0.120153356481483[/C][/ROW]
[ROW][C]19[/C][C]6.2[/C][C]6.66459780092593[/C][C]-0.464597800925928[/C][/ROW]
[ROW][C]20[/C][C]6.4[/C][C]6.80904224537037[/C][C]-0.409042245370372[/C][/ROW]
[ROW][C]21[/C][C]6.8[/C][C]6.8312644675926[/C][C]-0.0312644675925944[/C][/ROW]
[ROW][C]22[/C][C]7.5[/C][C]6.91948784722222[/C][C]0.580512152777776[/C][/ROW]
[ROW][C]23[/C][C]7.5[/C][C]6.81948784722222[/C][C]0.680512152777776[/C][/ROW]
[ROW][C]24[/C][C]7.6[/C][C]6.88198784722222[/C][C]0.718012152777776[/C][/ROW]
[ROW][C]25[/C][C]7.6[/C][C]8.49788773148148[/C][C]-0.897887731481484[/C][/ROW]
[ROW][C]26[/C][C]7.4[/C][C]8.38677662037037[/C][C]-0.98677662037037[/C][/ROW]
[ROW][C]27[/C][C]7.3[/C][C]8.2089988425926[/C][C]-0.908998842592592[/C][/ROW]
[ROW][C]28[/C][C]7.1[/C][C]8.0201099537037[/C][C]-0.920109953703703[/C][/ROW]
[ROW][C]29[/C][C]6.9[/C][C]7.78677662037037[/C][C]-0.88677662037037[/C][/ROW]
[ROW][C]30[/C][C]6.8[/C][C]7.67566550925926[/C][C]-0.875665509259258[/C][/ROW]
[ROW][C]31[/C][C]7.5[/C][C]8.2201099537037[/C][C]-0.720109953703703[/C][/ROW]
[ROW][C]32[/C][C]7.6[/C][C]8.36455439814815[/C][C]-0.764554398148148[/C][/ROW]
[ROW][C]33[/C][C]7.8[/C][C]8.38677662037037[/C][C]-0.58677662037037[/C][/ROW]
[ROW][C]34[/C][C]8[/C][C]8.475[/C][C]-0.474999999999999[/C][/ROW]
[ROW][C]35[/C][C]8.1[/C][C]8.375[/C][C]-0.275000000000000[/C][/ROW]
[ROW][C]36[/C][C]8.2[/C][C]8.4375[/C][C]-0.2375[/C][/ROW]
[ROW][C]37[/C][C]8.3[/C][C]8.3843894675926[/C][C]-0.0843894675925945[/C][/ROW]
[ROW][C]38[/C][C]8.2[/C][C]8.27327835648148[/C][C]-0.073278356481483[/C][/ROW]
[ROW][C]39[/C][C]8[/C][C]8.0955005787037[/C][C]-0.095500578703703[/C][/ROW]
[ROW][C]40[/C][C]7.9[/C][C]7.90661168981481[/C][C]-0.00661168981481376[/C][/ROW]
[ROW][C]41[/C][C]7.6[/C][C]7.67327835648148[/C][C]-0.0732783564814813[/C][/ROW]
[ROW][C]42[/C][C]7.6[/C][C]7.56216724537037[/C][C]0.03783275462963[/C][/ROW]
[ROW][C]43[/C][C]8.2[/C][C]8.10661168981481[/C][C]0.093388310185185[/C][/ROW]
[ROW][C]44[/C][C]8.3[/C][C]8.25105613425926[/C][C]0.0489438657407421[/C][/ROW]
[ROW][C]45[/C][C]8.4[/C][C]8.27327835648148[/C][C]0.126721643518519[/C][/ROW]
[ROW][C]46[/C][C]8.4[/C][C]8.36150173611111[/C][C]0.0384982638888898[/C][/ROW]
[ROW][C]47[/C][C]8.4[/C][C]8.26150173611111[/C][C]0.138498263888890[/C][/ROW]
[ROW][C]48[/C][C]8.6[/C][C]8.32400173611111[/C][C]0.275998263888889[/C][/ROW]
[ROW][C]49[/C][C]8.9[/C][C]8.27089120370371[/C][C]0.629108796296294[/C][/ROW]
[ROW][C]50[/C][C]8.8[/C][C]8.1597800925926[/C][C]0.640219907407407[/C][/ROW]
[ROW][C]51[/C][C]8.3[/C][C]7.98200231481481[/C][C]0.317997685185187[/C][/ROW]
[ROW][C]52[/C][C]7.5[/C][C]7.79311342592593[/C][C]-0.293113425925925[/C][/ROW]
[ROW][C]53[/C][C]7.2[/C][C]7.55978009259259[/C][C]-0.359780092592592[/C][/ROW]
[ROW][C]54[/C][C]7.5[/C][C]7.44866898148148[/C][C]0.0513310185185192[/C][/ROW]
[ROW][C]55[/C][C]8.8[/C][C]7.99311342592593[/C][C]0.806886574074075[/C][/ROW]
[ROW][C]56[/C][C]9.3[/C][C]8.13755787037037[/C][C]1.16244212962963[/C][/ROW]
[ROW][C]57[/C][C]9.3[/C][C]8.1597800925926[/C][C]1.14021990740741[/C][/ROW]
[ROW][C]58[/C][C]8.7[/C][C]8.24800347222222[/C][C]0.451996527777777[/C][/ROW]
[ROW][C]59[/C][C]8.2[/C][C]8.14800347222222[/C][C]0.0519965277777777[/C][/ROW]
[ROW][C]60[/C][C]8.3[/C][C]8.21050347222222[/C][C]0.0894965277777792[/C][/ROW]
[ROW][C]61[/C][C]8.5[/C][C]8.15739293981482[/C][C]0.342607060185183[/C][/ROW]
[ROW][C]62[/C][C]8.6[/C][C]8.0462818287037[/C][C]0.553718171296295[/C][/ROW]
[ROW][C]63[/C][C]8.6[/C][C]7.86850405092593[/C][C]0.731495949074074[/C][/ROW]
[ROW][C]64[/C][C]8.2[/C][C]7.67961516203704[/C][C]0.520384837962963[/C][/ROW]
[ROW][C]65[/C][C]8.1[/C][C]7.4462818287037[/C][C]0.653718171296296[/C][/ROW]
[ROW][C]66[/C][C]8[/C][C]7.33517071759259[/C][C]0.664829282407408[/C][/ROW]
[ROW][C]67[/C][C]8.6[/C][C]7.87961516203704[/C][C]0.720384837962963[/C][/ROW]
[ROW][C]68[/C][C]8.7[/C][C]8.02405960648148[/C][C]0.675940393518518[/C][/ROW]
[ROW][C]69[/C][C]8.8[/C][C]8.0462818287037[/C][C]0.753718171296297[/C][/ROW]
[ROW][C]70[/C][C]8.5[/C][C]8.13450520833333[/C][C]0.365494791666667[/C][/ROW]
[ROW][C]71[/C][C]8.4[/C][C]8.03450520833333[/C][C]0.365494791666668[/C][/ROW]
[ROW][C]72[/C][C]8.5[/C][C]8.09700520833333[/C][C]0.402994791666667[/C][/ROW]
[ROW][C]73[/C][C]8.7[/C][C]8.04389467592593[/C][C]0.65610532407407[/C][/ROW]
[ROW][C]74[/C][C]8.7[/C][C]7.93278356481482[/C][C]0.767216435185183[/C][/ROW]
[ROW][C]75[/C][C]8.6[/C][C]7.75500578703704[/C][C]0.844994212962963[/C][/ROW]
[ROW][C]76[/C][C]8.5[/C][C]7.56611689814815[/C][C]0.933883101851852[/C][/ROW]
[ROW][C]77[/C][C]8.3[/C][C]7.33278356481481[/C][C]0.967216435185186[/C][/ROW]
[ROW][C]78[/C][C]8.1[/C][C]7.2216724537037[/C][C]0.878327546296297[/C][/ROW]
[ROW][C]79[/C][C]8.2[/C][C]7.76611689814815[/C][C]0.433883101851852[/C][/ROW]
[ROW][C]80[/C][C]8.1[/C][C]7.9105613425926[/C][C]0.189438657407407[/C][/ROW]
[ROW][C]81[/C][C]8.1[/C][C]7.93278356481481[/C][C]0.167216435185185[/C][/ROW]
[ROW][C]82[/C][C]7.9[/C][C]8.02100694444444[/C][C]-0.121006944444444[/C][/ROW]
[ROW][C]83[/C][C]7.9[/C][C]7.92100694444444[/C][C]-0.0210069444444437[/C][/ROW]
[ROW][C]84[/C][C]7.9[/C][C]7.98350694444444[/C][C]-0.0835069444444436[/C][/ROW]
[ROW][C]85[/C][C]8[/C][C]7.93039641203704[/C][C]0.0696035879629601[/C][/ROW]
[ROW][C]86[/C][C]8[/C][C]7.81928530092593[/C][C]0.180714699074073[/C][/ROW]
[ROW][C]87[/C][C]7.9[/C][C]7.64150752314815[/C][C]0.258492476851853[/C][/ROW]
[ROW][C]88[/C][C]8[/C][C]7.45261863425926[/C][C]0.547381365740741[/C][/ROW]
[ROW][C]89[/C][C]7.7[/C][C]7.21928530092593[/C][C]0.480714699074074[/C][/ROW]
[ROW][C]90[/C][C]7.2[/C][C]7.10817418981481[/C][C]0.0918258101851858[/C][/ROW]
[ROW][C]91[/C][C]7.5[/C][C]7.65261863425926[/C][C]-0.152618634259259[/C][/ROW]
[ROW][C]92[/C][C]7.3[/C][C]7.7970630787037[/C][C]-0.497063078703703[/C][/ROW]
[ROW][C]93[/C][C]7[/C][C]7.81928530092593[/C][C]-0.819285300925926[/C][/ROW]
[ROW][C]94[/C][C]7[/C][C]7.90750868055556[/C][C]-0.907508680555555[/C][/ROW]
[ROW][C]95[/C][C]7[/C][C]7.80750868055556[/C][C]-0.807508680555555[/C][/ROW]
[ROW][C]96[/C][C]7.2[/C][C]7.87000868055556[/C][C]-0.670008680555555[/C][/ROW]
[ROW][C]97[/C][C]7.3[/C][C]7.81689814814815[/C][C]-0.516898148148151[/C][/ROW]
[ROW][C]98[/C][C]7.1[/C][C]7.70578703703704[/C][C]-0.605787037037039[/C][/ROW]
[ROW][C]99[/C][C]6.8[/C][C]7.52800925925926[/C][C]-0.728009259259259[/C][/ROW]
[ROW][C]100[/C][C]6.6[/C][C]7.33912037037037[/C][C]-0.73912037037037[/C][/ROW]
[ROW][C]101[/C][C]6.2[/C][C]7.10578703703704[/C][C]-0.905787037037037[/C][/ROW]
[ROW][C]102[/C][C]6.2[/C][C]6.99467592592593[/C][C]-0.794675925925925[/C][/ROW]
[ROW][C]103[/C][C]6.8[/C][C]7.53912037037037[/C][C]-0.73912037037037[/C][/ROW]
[ROW][C]104[/C][C]6.9[/C][C]7.68356481481481[/C][C]-0.783564814814814[/C][/ROW]
[ROW][C]105[/C][C]6.8[/C][C]7.70578703703704[/C][C]-0.905787037037037[/C][/ROW]
[/TABLE]
Source: https://freestatistics.org/blog/index.php?pk=25831&T=4

Globally Unique Identifier (entire table): ba.freestatistics.org/blog/index.php?pk=25831&T=4

As an alternative you can also use a QR Code:  

The GUIDs for individual cells are displayed in the table below:

Multiple Linear Regression - Actuals, Interpolation, and Residuals
Time or IndexActualsInterpolationForecastResidualsPrediction Error
17.57.055873842592570.444126157407434
27.26.944762731481470.255237268518531
36.96.766984953703710.133015046296294
46.76.578096064814820.121903935185183
56.46.344762731481480.0552372685185177
66.36.233651620370370.066348379629627
76.86.778096064814820.0219039351851845
87.36.922540509259260.377459490740739
97.16.944762731481480.155237268518516
107.17.032986111111110.0670138888888871
116.86.93298611111111-0.132986111111113
126.56.99548611111111-0.495486111111112
136.36.94237557870371-0.642375578703709
146.16.8312644675926-0.731264467592597
156.16.65348668981482-0.553486689814817
166.36.46459780092593-0.164597800925927
176.36.231264467592590.0687355324074054
1866.12015335648148-0.120153356481483
196.26.66459780092593-0.464597800925928
206.46.80904224537037-0.409042245370372
216.86.8312644675926-0.0312644675925944
227.56.919487847222220.580512152777776
237.56.819487847222220.680512152777776
247.66.881987847222220.718012152777776
257.68.49788773148148-0.897887731481484
267.48.38677662037037-0.98677662037037
277.38.2089988425926-0.908998842592592
287.18.0201099537037-0.920109953703703
296.97.78677662037037-0.88677662037037
306.87.67566550925926-0.875665509259258
317.58.2201099537037-0.720109953703703
327.68.36455439814815-0.764554398148148
337.88.38677662037037-0.58677662037037
3488.475-0.474999999999999
358.18.375-0.275000000000000
368.28.4375-0.2375
378.38.3843894675926-0.0843894675925945
388.28.27327835648148-0.073278356481483
3988.0955005787037-0.095500578703703
407.97.90661168981481-0.00661168981481376
417.67.67327835648148-0.0732783564814813
427.67.562167245370370.03783275462963
438.28.106611689814810.093388310185185
448.38.251056134259260.0489438657407421
458.48.273278356481480.126721643518519
468.48.361501736111110.0384982638888898
478.48.261501736111110.138498263888890
488.68.324001736111110.275998263888889
498.98.270891203703710.629108796296294
508.88.15978009259260.640219907407407
518.37.982002314814810.317997685185187
527.57.79311342592593-0.293113425925925
537.27.55978009259259-0.359780092592592
547.57.448668981481480.0513310185185192
558.87.993113425925930.806886574074075
569.38.137557870370371.16244212962963
579.38.15978009259261.14021990740741
588.78.248003472222220.451996527777777
598.28.148003472222220.0519965277777777
608.38.210503472222220.0894965277777792
618.58.157392939814820.342607060185183
628.68.04628182870370.553718171296295
638.67.868504050925930.731495949074074
648.27.679615162037040.520384837962963
658.17.44628182870370.653718171296296
6687.335170717592590.664829282407408
678.67.879615162037040.720384837962963
688.78.024059606481480.675940393518518
698.88.04628182870370.753718171296297
708.58.134505208333330.365494791666667
718.48.034505208333330.365494791666668
728.58.097005208333330.402994791666667
738.78.043894675925930.65610532407407
748.77.932783564814820.767216435185183
758.67.755005787037040.844994212962963
768.57.566116898148150.933883101851852
778.37.332783564814810.967216435185186
788.17.22167245370370.878327546296297
798.27.766116898148150.433883101851852
808.17.91056134259260.189438657407407
818.17.932783564814810.167216435185185
827.98.02100694444444-0.121006944444444
837.97.92100694444444-0.0210069444444437
847.97.98350694444444-0.0835069444444436
8587.930396412037040.0696035879629601
8687.819285300925930.180714699074073
877.97.641507523148150.258492476851853
8887.452618634259260.547381365740741
897.77.219285300925930.480714699074074
907.27.108174189814810.0918258101851858
917.57.65261863425926-0.152618634259259
927.37.7970630787037-0.497063078703703
9377.81928530092593-0.819285300925926
9477.90750868055556-0.907508680555555
9577.80750868055556-0.807508680555555
967.27.87000868055556-0.670008680555555
977.37.81689814814815-0.516898148148151
987.17.70578703703704-0.605787037037039
996.87.52800925925926-0.728009259259259
1006.67.33912037037037-0.73912037037037
1016.27.10578703703704-0.905787037037037
1026.26.99467592592593-0.794675925925925
1036.87.53912037037037-0.73912037037037
1046.97.68356481481481-0.783564814814814
1056.87.70578703703704-0.905787037037037


Parameters (Session):
par1 = 1 ; par2 = Include Monthly Dummies ; par3 = Linear Trend ;
Parameters (R input):
par1 = 1 ; par2 = Include Monthly Dummies ; par3 = Linear Trend ;
R code (references can be found in the software module):
library(lattice)
par1 <- as.numeric(par1)
x <- t(y)
k <- length(x[1,])
n <- length(x[,1])
x1 <- cbind(x[,par1], x[,1:k!=par1])
mycolnames <- c(colnames(x)[par1], colnames(x)[1:k!=par1])
colnames(x1) <- mycolnames #colnames(x)[par1]
x <- x1
if (par3 == 'First Differences'){
x2 <- array(0, dim=c(n-1,k), dimnames=list(1:(n-1), paste('(1-B)',colnames(x),sep='')))
for (i in 1:n-1) {
for (j in 1:k) {
x2[i,j] <- x[i+1,j] - x[i,j]
}
}
x <- x2
}
if (par2 == 'Include Monthly Dummies'){
x2 <- array(0, dim=c(n,11), dimnames=list(1:n, paste('M', seq(1:11), sep ='')))
for (i in 1:11){
x2[seq(i,n,12),i] <- 1
}
x <- cbind(x, x2)
}
if (par2 == 'Include Quarterly Dummies'){
x2 <- array(0, dim=c(n,3), dimnames=list(1:n, paste('Q', seq(1:3), sep ='')))
for (i in 1:3){
x2[seq(i,n,4),i] <- 1
}
x <- cbind(x, x2)
}
k <- length(x[1,])
if (par3 == 'Linear Trend'){
x <- cbind(x, c(1:n))
colnames(x)[k+1] <- 't'
}
x
k <- length(x[1,])
df <- as.data.frame(x)
(mylm <- lm(df))
(mysum <- summary(mylm))
bitmap(file='test0.png')
plot(x[,1], type='l', main='Actuals and Interpolation', ylab='value of Actuals and Interpolation (dots)', xlab='time or index')
points(x[,1]-mysum$resid)
grid()
dev.off()
bitmap(file='test1.png')
plot(mysum$resid, type='b', pch=19, main='Residuals', ylab='value of Residuals', xlab='time or index')
grid()
dev.off()
bitmap(file='test2.png')
hist(mysum$resid, main='Residual Histogram', xlab='values of Residuals')
grid()
dev.off()
bitmap(file='test3.png')
densityplot(~mysum$resid,col='black',main='Residual Density Plot', xlab='values of Residuals')
dev.off()
bitmap(file='test4.png')
qqnorm(mysum$resid, main='Residual Normal Q-Q Plot')
grid()
dev.off()
(myerror <- as.ts(mysum$resid))
bitmap(file='test5.png')
dum <- cbind(lag(myerror,k=1),myerror)
dum
dum1 <- dum[2:length(myerror),]
dum1
z <- as.data.frame(dum1)
z
plot(z,main=paste('Residual Lag plot, lowess, and regression line'), ylab='values of Residuals', xlab='lagged values of Residuals')
lines(lowess(z))
abline(lm(z))
grid()
dev.off()
bitmap(file='test6.png')
acf(mysum$resid, lag.max=length(mysum$resid)/2, main='Residual Autocorrelation Function')
grid()
dev.off()
bitmap(file='test7.png')
pacf(mysum$resid, lag.max=length(mysum$resid)/2, main='Residual Partial Autocorrelation Function')
grid()
dev.off()
bitmap(file='test8.png')
opar <- par(mfrow = c(2,2), oma = c(0, 0, 1.1, 0))
plot(mylm, las = 1, sub='Residual Diagnostics')
par(opar)
dev.off()
load(file='createtable')
a<-table.start()
a<-table.row.start(a)
a<-table.element(a, 'Multiple Linear Regression - Estimated Regression Equation', 1, TRUE)
a<-table.row.end(a)
myeq <- colnames(x)[1]
myeq <- paste(myeq, '[t] = ', sep='')
for (i in 1:k){
if (mysum$coefficients[i,1] > 0) myeq <- paste(myeq, '+', '')
myeq <- paste(myeq, mysum$coefficients[i,1], sep=' ')
if (rownames(mysum$coefficients)[i] != '(Intercept)') {
myeq <- paste(myeq, rownames(mysum$coefficients)[i], sep='')
if (rownames(mysum$coefficients)[i] != 't') myeq <- paste(myeq, '[t]', sep='')
}
}
myeq <- paste(myeq, ' + e[t]')
a<-table.row.start(a)
a<-table.element(a, myeq)
a<-table.row.end(a)
a<-table.end(a)
table.save(a,file='mytable1.tab')
a<-table.start()
a<-table.row.start(a)
a<-table.element(a,hyperlink('ols1.htm','Multiple Linear Regression - Ordinary Least Squares',''), 6, TRUE)
a<-table.row.end(a)
a<-table.row.start(a)
a<-table.element(a,'Variable',header=TRUE)
a<-table.element(a,'Parameter',header=TRUE)
a<-table.element(a,'S.D.',header=TRUE)
a<-table.element(a,'T-STAT
H0: parameter = 0',header=TRUE)
a<-table.element(a,'2-tail p-value',header=TRUE)
a<-table.element(a,'1-tail p-value',header=TRUE)
a<-table.row.end(a)
for (i in 1:k){
a<-table.row.start(a)
a<-table.element(a,rownames(mysum$coefficients)[i],header=TRUE)
a<-table.element(a,mysum$coefficients[i,1])
a<-table.element(a, round(mysum$coefficients[i,2],6))
a<-table.element(a, round(mysum$coefficients[i,3],4))
a<-table.element(a, round(mysum$coefficients[i,4],6))
a<-table.element(a, round(mysum$coefficients[i,4]/2,6))
a<-table.row.end(a)
}
a<-table.end(a)
table.save(a,file='mytable2.tab')
a<-table.start()
a<-table.row.start(a)
a<-table.element(a, 'Multiple Linear Regression - Regression Statistics', 2, TRUE)
a<-table.row.end(a)
a<-table.row.start(a)
a<-table.element(a, 'Multiple R',1,TRUE)
a<-table.element(a, sqrt(mysum$r.squared))
a<-table.row.end(a)
a<-table.row.start(a)
a<-table.element(a, 'R-squared',1,TRUE)
a<-table.element(a, mysum$r.squared)
a<-table.row.end(a)
a<-table.row.start(a)
a<-table.element(a, 'Adjusted R-squared',1,TRUE)
a<-table.element(a, mysum$adj.r.squared)
a<-table.row.end(a)
a<-table.row.start(a)
a<-table.element(a, 'F-TEST (value)',1,TRUE)
a<-table.element(a, mysum$fstatistic[1])
a<-table.row.end(a)
a<-table.row.start(a)
a<-table.element(a, 'F-TEST (DF numerator)',1,TRUE)
a<-table.element(a, mysum$fstatistic[2])
a<-table.row.end(a)
a<-table.row.start(a)
a<-table.element(a, 'F-TEST (DF denominator)',1,TRUE)
a<-table.element(a, mysum$fstatistic[3])
a<-table.row.end(a)
a<-table.row.start(a)
a<-table.element(a, 'p-value',1,TRUE)
a<-table.element(a, 1-pf(mysum$fstatistic[1],mysum$fstatistic[2],mysum$fstatistic[3]))
a<-table.row.end(a)
a<-table.row.start(a)
a<-table.element(a, 'Multiple Linear Regression - Residual Statistics', 2, TRUE)
a<-table.row.end(a)
a<-table.row.start(a)
a<-table.element(a, 'Residual Standard Deviation',1,TRUE)
a<-table.element(a, mysum$sigma)
a<-table.row.end(a)
a<-table.row.start(a)
a<-table.element(a, 'Sum Squared Residuals',1,TRUE)
a<-table.element(a, sum(myerror*myerror))
a<-table.row.end(a)
a<-table.end(a)
table.save(a,file='mytable3.tab')
a<-table.start()
a<-table.row.start(a)
a<-table.element(a, 'Multiple Linear Regression - Actuals, Interpolation, and Residuals', 4, TRUE)
a<-table.row.end(a)
a<-table.row.start(a)
a<-table.element(a, 'Time or Index', 1, TRUE)
a<-table.element(a, 'Actuals', 1, TRUE)
a<-table.element(a, 'Interpolation
Forecast', 1, TRUE)
a<-table.element(a, 'Residuals
Prediction Error', 1, TRUE)
a<-table.row.end(a)
for (i in 1:n) {
a<-table.row.start(a)
a<-table.element(a,i, 1, TRUE)
a<-table.element(a,x[i])
a<-table.element(a,x[i]-mysum$resid[i])
a<-table.element(a,mysum$resid[i])
a<-table.row.end(a)
}
a<-table.end(a)
table.save(a,file='mytable4.tab')