Free Statistics

of Irreproducible Research!

Author's title

Author*Unverified author*
R Software Modulerwasp_multipleregression.wasp
Title produced by softwareMultiple Regression
Date of computationThu, 27 Nov 2008 08:32:08 -0700
Cite this page as followsStatistical Computations at FreeStatistics.org, Office for Research Development and Education, URL https://freestatistics.org/blog/index.php?v=date/2008/Nov/27/t1227799981g4j7aicfnqjacx1.htm/, Retrieved Mon, 27 May 2024 08:44:32 +0000
Statistical Computations at FreeStatistics.org, Office for Research Development and Education, URL https://freestatistics.org/blog/index.php?pk=25839, Retrieved Mon, 27 May 2024 08:44:32 +0000
QR Codes:

Original text written by user:
IsPrivate?No (this computation is public)
User-defined keywords
Estimated Impact130
Family? (F = Feedback message, R = changed R code, M = changed R Module, P = changed Parameters, D = changed Data)
F       [Multiple Regression] [seatbelt law q3] [2008-11-27 15:32:08] [51254d789fff0741e6503951f574c682] [Current]
Feedback Forum
2008-11-28 13:03:19 [407693b66d7f2e0b350979005057872d] [reply
Dit is een vraag waarbij je een eigen datareeks moest zoeken. Deze conclusie van de student is correct.
2008-11-29 14:45:33 [Carole Thielens] [reply
Het lijkt me wel een goed idee om bij een tijdsreeks met productiecijfers, een dummyvariabele in te voeren dat betrekking heeft op de aanslagen van 9/11.
Toch denk ik dat de student niet zo goed weet hoe hij het effect van deze dummy moet onderzoeken.
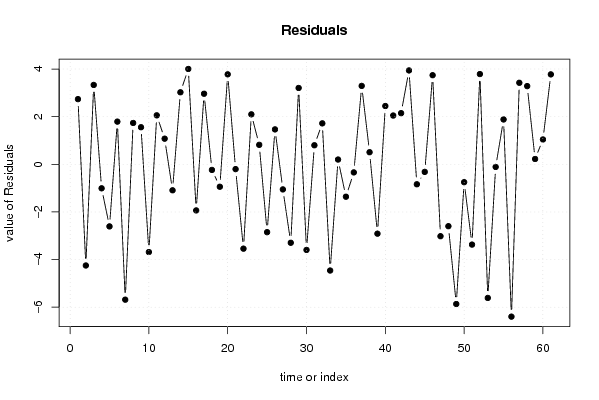
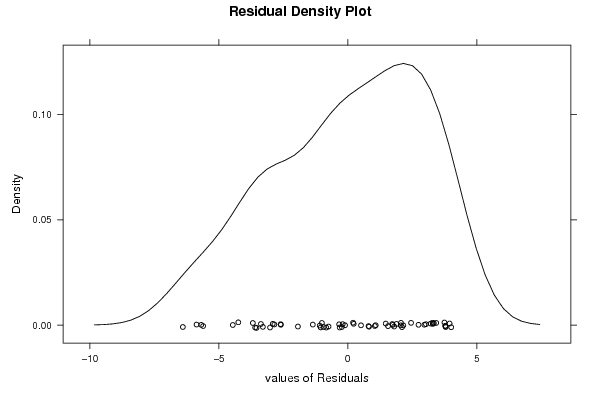
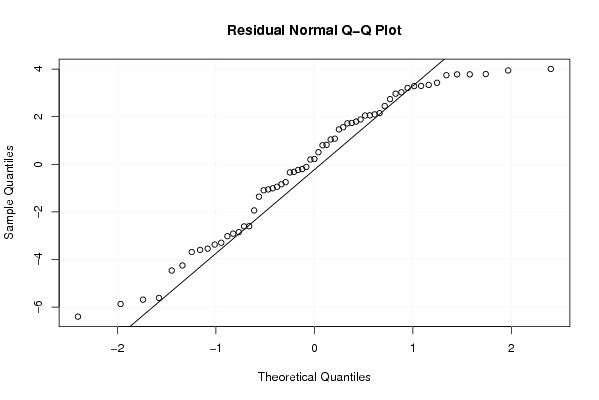
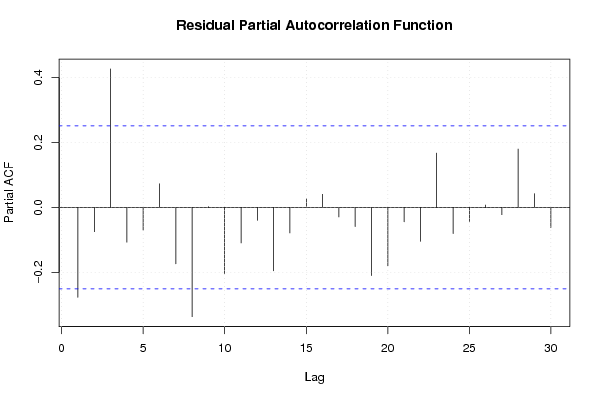
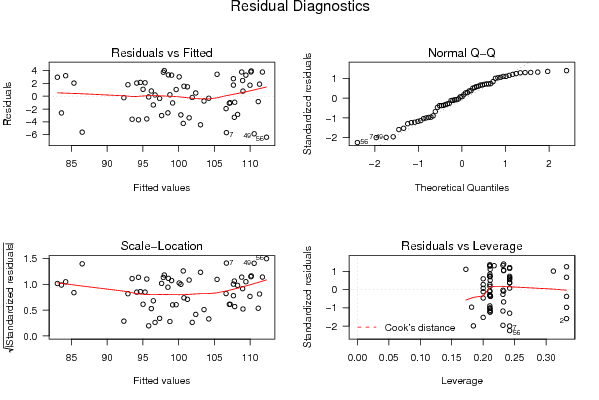
Hij merkte vooreerst correct op dat de p-waarden schommelen en gedurende bepaalde maandan gelijk zijn aan 0. Hier zijn ze dus kleiner dan de type I error(0.05), waaruit blijkt dat ze significant verschillen. Ook kijkt hij naar de adjusted R-squared-waarde van 0.82, waaruit blijkt dat dit een vrij goed model is. Wanneer echter gekeken wordt naar de residuals-grafiek, kan waargenomen worden dat de waarden helemaal niet dicht bij hun gemiddelde(0) liggen en het dus toch niet zo’n goed model is.
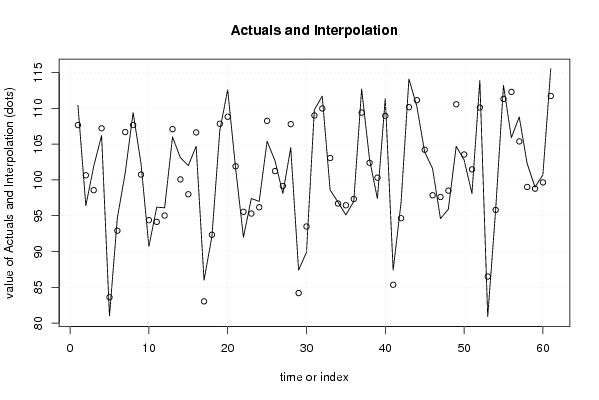
De student denkt eveneens dat de aanslagen een effect hebben op de productie omdat de maanden waar de p-waarden laag liggen, de productie ook piekt op de actuals and interpolation plot. Ik denk niet dat dit kan kloppen. We kunnen immers op deze grafiek geen effect zien van de aanslagen, gezien op het moment van het invoeren van de dummyvariabele er geen verandering op te merken is aan het verloop op deze grafiek.
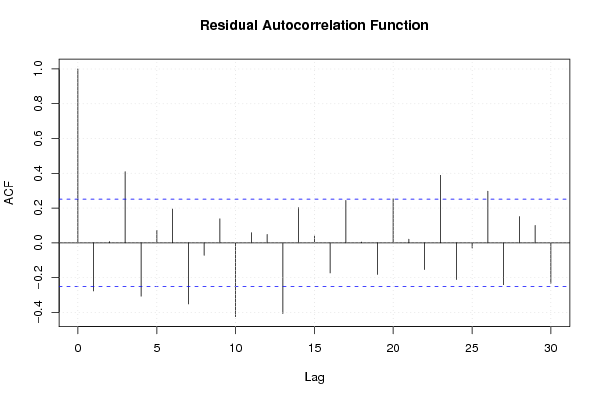
Ook sloeg de student er niet in om een interpretatie te maken van de autocorrelatiefunctie.
2008-12-01 20:17:57 [Daniel Utzeri] [reply

Post a new message
Dataseries X:
110.40	0
96.40	0
101.90	0
106.20	0
81.00	0
94.70	0
101.00	1
109.40	1
102.30	1
90.70	1
96.20	1
96.10	1
106.00	1
103.10	1
102.00	1
104.70	1
86.00	1
92.10	1
106.90	1
112.60	1
101.70	1
92.00	1
97.40	1
97.00	1
105.40	1
102.70	1
98.10	1
104.50	1
87.40	1
89.90	1
109.80	1
111.70	1
98.60	1
96.90	1
95.10	1
97.00	1
112.70	1
102.90	1
97.40	1
111.40	1
87.40	1
96.80	1
114.10	1
110.30	1
103.90	1
101.60	1
94.60	1
95.90	1
104.70	1
102.80	1
98.10	1
113.90	1
80.90	1
95.70	1
113.20	1
105.90	1
108.80	1
102.30	1
99.00	1
100.70	1
115.50	1


Summary of computational transaction
Raw Inputview raw input (R code)
Raw Outputview raw output of R engine
Computing time7 seconds
R Server'Herman Ole Andreas Wold' @ 193.190.124.10:1001

\begin{tabular}{lllllllll}
\hline
Summary of computational transaction \tabularnewline
Raw Input & view raw input (R code)  \tabularnewline
Raw Output & view raw output of R engine  \tabularnewline
Computing time & 7 seconds \tabularnewline
R Server & 'Herman Ole Andreas Wold' @ 193.190.124.10:1001 \tabularnewline
\hline
\end{tabular}
%Source: https://freestatistics.org/blog/index.php?pk=25839&T=0

[TABLE]
[ROW][C]Summary of computational transaction[/C][/ROW]
[ROW][C]Raw Input[/C][C]view raw input (R code) [/C][/ROW]
[ROW][C]Raw Output[/C][C]view raw output of R engine [/C][/ROW]
[ROW][C]Computing time[/C][C]7 seconds[/C][/ROW]
[ROW][C]R Server[/C][C]'Herman Ole Andreas Wold' @ 193.190.124.10:1001[/C][/ROW]
[/TABLE]
Source: https://freestatistics.org/blog/index.php?pk=25839&T=0

Globally Unique Identifier (entire table): ba.freestatistics.org/blog/index.php?pk=25839&T=0

As an alternative you can also use a QR Code:  

The GUIDs for individual cells are displayed in the table below:

Summary of computational transaction
Raw Inputview raw input (R code)
Raw Outputview raw output of R engine
Computing time7 seconds
R Server'Herman Ole Andreas Wold' @ 193.190.124.10:1001


Multiple Linear Regression - Estimated Regression Equation
IP[t] = + 95.5952173913044 -1.72989130434784d[t] + 11.9709450483092M1[t] + 4.85920893719806M2[t] + 2.6826902173913M3[t] + 11.2261714975845M4[t] -12.4703472222222M5[t] -3.26686594202899M6[t] + 12.1425935990338M7[t] + 13.0260748792271M8[t] + 6.00955615942029M9[t] -0.446962560386472M10[t] -0.783481280193238M11[t] + 0.0965187198067633t + e[t]

\begin{tabular}{lllllllll}
\hline
Multiple Linear Regression - Estimated Regression Equation \tabularnewline
IP[t] =  +  95.5952173913044 -1.72989130434784d[t] +  11.9709450483092M1[t] +  4.85920893719806M2[t] +  2.6826902173913M3[t] +  11.2261714975845M4[t] -12.4703472222222M5[t] -3.26686594202899M6[t] +  12.1425935990338M7[t] +  13.0260748792271M8[t] +  6.00955615942029M9[t] -0.446962560386472M10[t] -0.783481280193238M11[t] +  0.0965187198067633t  + e[t] \tabularnewline
\hline
\end{tabular}
%Source: https://freestatistics.org/blog/index.php?pk=25839&T=1

[TABLE]
[ROW][C]Multiple Linear Regression - Estimated Regression Equation[/C][/ROW]
[ROW][C]IP[t] =  +  95.5952173913044 -1.72989130434784d[t] +  11.9709450483092M1[t] +  4.85920893719806M2[t] +  2.6826902173913M3[t] +  11.2261714975845M4[t] -12.4703472222222M5[t] -3.26686594202899M6[t] +  12.1425935990338M7[t] +  13.0260748792271M8[t] +  6.00955615942029M9[t] -0.446962560386472M10[t] -0.783481280193238M11[t] +  0.0965187198067633t  + e[t][/C][/ROW]
[/TABLE]
Source: https://freestatistics.org/blog/index.php?pk=25839&T=1

Globally Unique Identifier (entire table): ba.freestatistics.org/blog/index.php?pk=25839&T=1

As an alternative you can also use a QR Code:  

The GUIDs for individual cells are displayed in the table below:

Multiple Linear Regression - Estimated Regression Equation
IP[t] = + 95.5952173913044 -1.72989130434784d[t] + 11.9709450483092M1[t] + 4.85920893719806M2[t] + 2.6826902173913M3[t] + 11.2261714975845M4[t] -12.4703472222222M5[t] -3.26686594202899M6[t] + 12.1425935990338M7[t] + 13.0260748792271M8[t] + 6.00955615942029M9[t] -0.446962560386472M10[t] -0.783481280193238M11[t] + 0.0965187198067633t + e[t]


Multiple Linear Regression - Ordinary Least Squares
VariableParameterS.D.T-STATH0: parameter = 02-tail p-value1-tail p-value
(Intercept)95.59521739130442.08969245.746100
d-1.729891304347841.720911-1.00520.3199390.15997
M111.97094504830921.9947866.001100
M24.859208937198062.0913022.32350.0245260.012263
M32.68269021739132.0900741.28350.2055960.102798
M411.22617149758452.0892185.37342e-061e-06
M5-12.47034722222222.088736-5.970300
M6-3.266865942028992.088626-1.56410.1244980.062249
M712.14259359903382.072055.860200
M813.02607487922712.0703566.291700
M96.009556159420292.0690382.90450.005590.002795
M10-0.4469625603864722.068095-0.21610.8298270.414914
M11-0.7834812801932382.06753-0.37890.7064350.353217
t0.09651871980676330.0279223.45670.0011710.000585

\begin{tabular}{lllllllll}
\hline
Multiple Linear Regression - Ordinary Least Squares \tabularnewline
Variable & Parameter & S.D. & T-STATH0: parameter = 0 & 2-tail p-value & 1-tail p-value \tabularnewline
(Intercept) & 95.5952173913044 & 2.089692 & 45.7461 & 0 & 0 \tabularnewline
d & -1.72989130434784 & 1.720911 & -1.0052 & 0.319939 & 0.15997 \tabularnewline
M1 & 11.9709450483092 & 1.994786 & 6.0011 & 0 & 0 \tabularnewline
M2 & 4.85920893719806 & 2.091302 & 2.3235 & 0.024526 & 0.012263 \tabularnewline
M3 & 2.6826902173913 & 2.090074 & 1.2835 & 0.205596 & 0.102798 \tabularnewline
M4 & 11.2261714975845 & 2.089218 & 5.3734 & 2e-06 & 1e-06 \tabularnewline
M5 & -12.4703472222222 & 2.088736 & -5.9703 & 0 & 0 \tabularnewline
M6 & -3.26686594202899 & 2.088626 & -1.5641 & 0.124498 & 0.062249 \tabularnewline
M7 & 12.1425935990338 & 2.07205 & 5.8602 & 0 & 0 \tabularnewline
M8 & 13.0260748792271 & 2.070356 & 6.2917 & 0 & 0 \tabularnewline
M9 & 6.00955615942029 & 2.069038 & 2.9045 & 0.00559 & 0.002795 \tabularnewline
M10 & -0.446962560386472 & 2.068095 & -0.2161 & 0.829827 & 0.414914 \tabularnewline
M11 & -0.783481280193238 & 2.06753 & -0.3789 & 0.706435 & 0.353217 \tabularnewline
t & 0.0965187198067633 & 0.027922 & 3.4567 & 0.001171 & 0.000585 \tabularnewline
\hline
\end{tabular}
%Source: https://freestatistics.org/blog/index.php?pk=25839&T=2

[TABLE]
[ROW][C]Multiple Linear Regression - Ordinary Least Squares[/C][/ROW]
[ROW][C]Variable[/C][C]Parameter[/C][C]S.D.[/C][C]T-STATH0: parameter = 0[/C][C]2-tail p-value[/C][C]1-tail p-value[/C][/ROW]
[ROW][C](Intercept)[/C][C]95.5952173913044[/C][C]2.089692[/C][C]45.7461[/C][C]0[/C][C]0[/C][/ROW]
[ROW][C]d[/C][C]-1.72989130434784[/C][C]1.720911[/C][C]-1.0052[/C][C]0.319939[/C][C]0.15997[/C][/ROW]
[ROW][C]M1[/C][C]11.9709450483092[/C][C]1.994786[/C][C]6.0011[/C][C]0[/C][C]0[/C][/ROW]
[ROW][C]M2[/C][C]4.85920893719806[/C][C]2.091302[/C][C]2.3235[/C][C]0.024526[/C][C]0.012263[/C][/ROW]
[ROW][C]M3[/C][C]2.6826902173913[/C][C]2.090074[/C][C]1.2835[/C][C]0.205596[/C][C]0.102798[/C][/ROW]
[ROW][C]M4[/C][C]11.2261714975845[/C][C]2.089218[/C][C]5.3734[/C][C]2e-06[/C][C]1e-06[/C][/ROW]
[ROW][C]M5[/C][C]-12.4703472222222[/C][C]2.088736[/C][C]-5.9703[/C][C]0[/C][C]0[/C][/ROW]
[ROW][C]M6[/C][C]-3.26686594202899[/C][C]2.088626[/C][C]-1.5641[/C][C]0.124498[/C][C]0.062249[/C][/ROW]
[ROW][C]M7[/C][C]12.1425935990338[/C][C]2.07205[/C][C]5.8602[/C][C]0[/C][C]0[/C][/ROW]
[ROW][C]M8[/C][C]13.0260748792271[/C][C]2.070356[/C][C]6.2917[/C][C]0[/C][C]0[/C][/ROW]
[ROW][C]M9[/C][C]6.00955615942029[/C][C]2.069038[/C][C]2.9045[/C][C]0.00559[/C][C]0.002795[/C][/ROW]
[ROW][C]M10[/C][C]-0.446962560386472[/C][C]2.068095[/C][C]-0.2161[/C][C]0.829827[/C][C]0.414914[/C][/ROW]
[ROW][C]M11[/C][C]-0.783481280193238[/C][C]2.06753[/C][C]-0.3789[/C][C]0.706435[/C][C]0.353217[/C][/ROW]
[ROW][C]t[/C][C]0.0965187198067633[/C][C]0.027922[/C][C]3.4567[/C][C]0.001171[/C][C]0.000585[/C][/ROW]
[/TABLE]
Source: https://freestatistics.org/blog/index.php?pk=25839&T=2

Globally Unique Identifier (entire table): ba.freestatistics.org/blog/index.php?pk=25839&T=2

As an alternative you can also use a QR Code:  

The GUIDs for individual cells are displayed in the table below:

Multiple Linear Regression - Ordinary Least Squares
VariableParameterS.D.T-STATH0: parameter = 02-tail p-value1-tail p-value
(Intercept)95.59521739130442.08969245.746100
d-1.729891304347841.720911-1.00520.3199390.15997
M111.97094504830921.9947866.001100
M24.859208937198062.0913022.32350.0245260.012263
M32.68269021739132.0900741.28350.2055960.102798
M411.22617149758452.0892185.37342e-061e-06
M5-12.47034722222222.088736-5.970300
M6-3.266865942028992.088626-1.56410.1244980.062249
M712.14259359903382.072055.860200
M813.02607487922712.0703566.291700
M96.009556159420292.0690382.90450.005590.002795
M10-0.4469625603864722.068095-0.21610.8298270.414914
M11-0.7834812801932382.06753-0.37890.7064350.353217
t0.09651871980676330.0279223.45670.0011710.000585


Multiple Linear Regression - Regression Statistics
Multiple R0.93371807006284
R-squared0.871829434361873
Adjusted R-squared0.83637800131303
F-TEST (value)24.5922198169169
F-TEST (DF numerator)13
F-TEST (DF denominator)47
p-value1.11022302462516e-16
Multiple Linear Regression - Residual Statistics
Residual Standard Deviation3.26875370300229
Sum Squared Residuals502.183286231884

\begin{tabular}{lllllllll}
\hline
Multiple Linear Regression - Regression Statistics \tabularnewline
Multiple R & 0.93371807006284 \tabularnewline
R-squared & 0.871829434361873 \tabularnewline
Adjusted R-squared & 0.83637800131303 \tabularnewline
F-TEST (value) & 24.5922198169169 \tabularnewline
F-TEST (DF numerator) & 13 \tabularnewline
F-TEST (DF denominator) & 47 \tabularnewline
p-value & 1.11022302462516e-16 \tabularnewline
Multiple Linear Regression - Residual Statistics \tabularnewline
Residual Standard Deviation & 3.26875370300229 \tabularnewline
Sum Squared Residuals & 502.183286231884 \tabularnewline
\hline
\end{tabular}
%Source: https://freestatistics.org/blog/index.php?pk=25839&T=3

[TABLE]
[ROW][C]Multiple Linear Regression - Regression Statistics[/C][/ROW]
[ROW][C]Multiple R[/C][C]0.93371807006284[/C][/ROW]
[ROW][C]R-squared[/C][C]0.871829434361873[/C][/ROW]
[ROW][C]Adjusted R-squared[/C][C]0.83637800131303[/C][/ROW]
[ROW][C]F-TEST (value)[/C][C]24.5922198169169[/C][/ROW]
[ROW][C]F-TEST (DF numerator)[/C][C]13[/C][/ROW]
[ROW][C]F-TEST (DF denominator)[/C][C]47[/C][/ROW]
[ROW][C]p-value[/C][C]1.11022302462516e-16[/C][/ROW]
[ROW][C]Multiple Linear Regression - Residual Statistics[/C][/ROW]
[ROW][C]Residual Standard Deviation[/C][C]3.26875370300229[/C][/ROW]
[ROW][C]Sum Squared Residuals[/C][C]502.183286231884[/C][/ROW]
[/TABLE]
Source: https://freestatistics.org/blog/index.php?pk=25839&T=3

Globally Unique Identifier (entire table): ba.freestatistics.org/blog/index.php?pk=25839&T=3

As an alternative you can also use a QR Code:  

The GUIDs for individual cells are displayed in the table below:

Multiple Linear Regression - Regression Statistics
Multiple R0.93371807006284
R-squared0.871829434361873
Adjusted R-squared0.83637800131303
F-TEST (value)24.5922198169169
F-TEST (DF numerator)13
F-TEST (DF denominator)47
p-value1.11022302462516e-16
Multiple Linear Regression - Residual Statistics
Residual Standard Deviation3.26875370300229
Sum Squared Residuals502.183286231884


Multiple Linear Regression - Actuals, Interpolation, and Residuals
Time or IndexActualsInterpolationForecastResidualsPrediction Error
1110.4107.6626811594202.73731884057975
296.4100.647463768116-4.24746376811595
3101.998.5674637681163.33253623188405
4106.2107.207463768116-1.00746376811595
58183.607463768116-2.60746376811595
694.792.9074637681161.79253623188405
7101106.683550724638-5.68355072463768
8109.4107.6635507246381.73644927536232
9102.3100.7435507246381.55644927536232
1090.794.3835507246377-3.68355072463767
1196.294.14355072463772.05644927536232
1296.195.02355072463771.07644927536231
13106107.091014492754-1.09101449275363
14103.1100.0757971014493.02420289855072
1510297.99579710144934.00420289855073
16104.7106.635797101449-1.93579710144927
178683.03579710144932.96420289855072
1892.192.3357971014493-0.235797101449278
19106.9107.841775362319-0.941775362318836
20112.6108.8217753623193.77822463768115
21101.7101.901775362319-0.201775362318837
229295.5417753623188-3.54177536231884
2397.495.30177536231882.09822463768117
249796.18177536231880.81822463768116
25105.4108.249239130435-2.84923913043479
26102.7101.2340217391301.46597826086957
2798.199.1540217391304-1.05402173913044
28104.5107.794021739130-3.29402173913044
2987.484.19402173913043.20597826086957
3089.993.4940217391304-3.59402173913043
31109.81090.799999999999996
32111.7109.981.72000000000000
3398.6103.06-4.46000000000001
3496.996.70.200000000000004
3595.196.46-1.36000000000001
369797.34-0.34
37112.7109.4074637681163.29253623188405
38102.9102.3922463768120.507753623188412
3997.4100.312246376812-2.91224637681159
40111.4108.9522463768122.44775362318841
4187.485.35224637681162.04775362318841
4296.894.65224637681162.14775362318841
43114.1110.1582246376813.94177536231884
44110.3111.138224637681-0.838224637681161
45103.9104.218224637681-0.318224637681153
46101.697.85822463768123.74177536231883
4794.697.6182246376812-3.01822463768117
4895.998.4982246376812-2.59822463768115
49104.7110.565688405797-5.86568840579711
50102.8103.550471014493-0.750471014492755
5198.1101.470471014493-3.37047101449276
52113.9110.1104710144933.78952898550725
5380.986.5104710144928-5.61047101449275
5495.795.8104710144927-0.110471014492748
55113.2111.3164492753621.88355072463768
56105.9112.296449275362-6.39644927536232
57108.8105.3764492753623.42355072463768
58102.399.01644927536233.28355072463768
599998.77644927536230.223550724637683
60100.799.65644927536231.04355072463768
61115.5111.7239130434783.77608695652173

\begin{tabular}{lllllllll}
\hline
Multiple Linear Regression - Actuals, Interpolation, and Residuals \tabularnewline
Time or Index & Actuals & InterpolationForecast & ResidualsPrediction Error \tabularnewline
1 & 110.4 & 107.662681159420 & 2.73731884057975 \tabularnewline
2 & 96.4 & 100.647463768116 & -4.24746376811595 \tabularnewline
3 & 101.9 & 98.567463768116 & 3.33253623188405 \tabularnewline
4 & 106.2 & 107.207463768116 & -1.00746376811595 \tabularnewline
5 & 81 & 83.607463768116 & -2.60746376811595 \tabularnewline
6 & 94.7 & 92.907463768116 & 1.79253623188405 \tabularnewline
7 & 101 & 106.683550724638 & -5.68355072463768 \tabularnewline
8 & 109.4 & 107.663550724638 & 1.73644927536232 \tabularnewline
9 & 102.3 & 100.743550724638 & 1.55644927536232 \tabularnewline
10 & 90.7 & 94.3835507246377 & -3.68355072463767 \tabularnewline
11 & 96.2 & 94.1435507246377 & 2.05644927536232 \tabularnewline
12 & 96.1 & 95.0235507246377 & 1.07644927536231 \tabularnewline
13 & 106 & 107.091014492754 & -1.09101449275363 \tabularnewline
14 & 103.1 & 100.075797101449 & 3.02420289855072 \tabularnewline
15 & 102 & 97.9957971014493 & 4.00420289855073 \tabularnewline
16 & 104.7 & 106.635797101449 & -1.93579710144927 \tabularnewline
17 & 86 & 83.0357971014493 & 2.96420289855072 \tabularnewline
18 & 92.1 & 92.3357971014493 & -0.235797101449278 \tabularnewline
19 & 106.9 & 107.841775362319 & -0.941775362318836 \tabularnewline
20 & 112.6 & 108.821775362319 & 3.77822463768115 \tabularnewline
21 & 101.7 & 101.901775362319 & -0.201775362318837 \tabularnewline
22 & 92 & 95.5417753623188 & -3.54177536231884 \tabularnewline
23 & 97.4 & 95.3017753623188 & 2.09822463768117 \tabularnewline
24 & 97 & 96.1817753623188 & 0.81822463768116 \tabularnewline
25 & 105.4 & 108.249239130435 & -2.84923913043479 \tabularnewline
26 & 102.7 & 101.234021739130 & 1.46597826086957 \tabularnewline
27 & 98.1 & 99.1540217391304 & -1.05402173913044 \tabularnewline
28 & 104.5 & 107.794021739130 & -3.29402173913044 \tabularnewline
29 & 87.4 & 84.1940217391304 & 3.20597826086957 \tabularnewline
30 & 89.9 & 93.4940217391304 & -3.59402173913043 \tabularnewline
31 & 109.8 & 109 & 0.799999999999996 \tabularnewline
32 & 111.7 & 109.98 & 1.72000000000000 \tabularnewline
33 & 98.6 & 103.06 & -4.46000000000001 \tabularnewline
34 & 96.9 & 96.7 & 0.200000000000004 \tabularnewline
35 & 95.1 & 96.46 & -1.36000000000001 \tabularnewline
36 & 97 & 97.34 & -0.34 \tabularnewline
37 & 112.7 & 109.407463768116 & 3.29253623188405 \tabularnewline
38 & 102.9 & 102.392246376812 & 0.507753623188412 \tabularnewline
39 & 97.4 & 100.312246376812 & -2.91224637681159 \tabularnewline
40 & 111.4 & 108.952246376812 & 2.44775362318841 \tabularnewline
41 & 87.4 & 85.3522463768116 & 2.04775362318841 \tabularnewline
42 & 96.8 & 94.6522463768116 & 2.14775362318841 \tabularnewline
43 & 114.1 & 110.158224637681 & 3.94177536231884 \tabularnewline
44 & 110.3 & 111.138224637681 & -0.838224637681161 \tabularnewline
45 & 103.9 & 104.218224637681 & -0.318224637681153 \tabularnewline
46 & 101.6 & 97.8582246376812 & 3.74177536231883 \tabularnewline
47 & 94.6 & 97.6182246376812 & -3.01822463768117 \tabularnewline
48 & 95.9 & 98.4982246376812 & -2.59822463768115 \tabularnewline
49 & 104.7 & 110.565688405797 & -5.86568840579711 \tabularnewline
50 & 102.8 & 103.550471014493 & -0.750471014492755 \tabularnewline
51 & 98.1 & 101.470471014493 & -3.37047101449276 \tabularnewline
52 & 113.9 & 110.110471014493 & 3.78952898550725 \tabularnewline
53 & 80.9 & 86.5104710144928 & -5.61047101449275 \tabularnewline
54 & 95.7 & 95.8104710144927 & -0.110471014492748 \tabularnewline
55 & 113.2 & 111.316449275362 & 1.88355072463768 \tabularnewline
56 & 105.9 & 112.296449275362 & -6.39644927536232 \tabularnewline
57 & 108.8 & 105.376449275362 & 3.42355072463768 \tabularnewline
58 & 102.3 & 99.0164492753623 & 3.28355072463768 \tabularnewline
59 & 99 & 98.7764492753623 & 0.223550724637683 \tabularnewline
60 & 100.7 & 99.6564492753623 & 1.04355072463768 \tabularnewline
61 & 115.5 & 111.723913043478 & 3.77608695652173 \tabularnewline
\hline
\end{tabular}
%Source: https://freestatistics.org/blog/index.php?pk=25839&T=4

[TABLE]
[ROW][C]Multiple Linear Regression - Actuals, Interpolation, and Residuals[/C][/ROW]
[ROW][C]Time or Index[/C][C]Actuals[/C][C]InterpolationForecast[/C][C]ResidualsPrediction Error[/C][/ROW]
[ROW][C]1[/C][C]110.4[/C][C]107.662681159420[/C][C]2.73731884057975[/C][/ROW]
[ROW][C]2[/C][C]96.4[/C][C]100.647463768116[/C][C]-4.24746376811595[/C][/ROW]
[ROW][C]3[/C][C]101.9[/C][C]98.567463768116[/C][C]3.33253623188405[/C][/ROW]
[ROW][C]4[/C][C]106.2[/C][C]107.207463768116[/C][C]-1.00746376811595[/C][/ROW]
[ROW][C]5[/C][C]81[/C][C]83.607463768116[/C][C]-2.60746376811595[/C][/ROW]
[ROW][C]6[/C][C]94.7[/C][C]92.907463768116[/C][C]1.79253623188405[/C][/ROW]
[ROW][C]7[/C][C]101[/C][C]106.683550724638[/C][C]-5.68355072463768[/C][/ROW]
[ROW][C]8[/C][C]109.4[/C][C]107.663550724638[/C][C]1.73644927536232[/C][/ROW]
[ROW][C]9[/C][C]102.3[/C][C]100.743550724638[/C][C]1.55644927536232[/C][/ROW]
[ROW][C]10[/C][C]90.7[/C][C]94.3835507246377[/C][C]-3.68355072463767[/C][/ROW]
[ROW][C]11[/C][C]96.2[/C][C]94.1435507246377[/C][C]2.05644927536232[/C][/ROW]
[ROW][C]12[/C][C]96.1[/C][C]95.0235507246377[/C][C]1.07644927536231[/C][/ROW]
[ROW][C]13[/C][C]106[/C][C]107.091014492754[/C][C]-1.09101449275363[/C][/ROW]
[ROW][C]14[/C][C]103.1[/C][C]100.075797101449[/C][C]3.02420289855072[/C][/ROW]
[ROW][C]15[/C][C]102[/C][C]97.9957971014493[/C][C]4.00420289855073[/C][/ROW]
[ROW][C]16[/C][C]104.7[/C][C]106.635797101449[/C][C]-1.93579710144927[/C][/ROW]
[ROW][C]17[/C][C]86[/C][C]83.0357971014493[/C][C]2.96420289855072[/C][/ROW]
[ROW][C]18[/C][C]92.1[/C][C]92.3357971014493[/C][C]-0.235797101449278[/C][/ROW]
[ROW][C]19[/C][C]106.9[/C][C]107.841775362319[/C][C]-0.941775362318836[/C][/ROW]
[ROW][C]20[/C][C]112.6[/C][C]108.821775362319[/C][C]3.77822463768115[/C][/ROW]
[ROW][C]21[/C][C]101.7[/C][C]101.901775362319[/C][C]-0.201775362318837[/C][/ROW]
[ROW][C]22[/C][C]92[/C][C]95.5417753623188[/C][C]-3.54177536231884[/C][/ROW]
[ROW][C]23[/C][C]97.4[/C][C]95.3017753623188[/C][C]2.09822463768117[/C][/ROW]
[ROW][C]24[/C][C]97[/C][C]96.1817753623188[/C][C]0.81822463768116[/C][/ROW]
[ROW][C]25[/C][C]105.4[/C][C]108.249239130435[/C][C]-2.84923913043479[/C][/ROW]
[ROW][C]26[/C][C]102.7[/C][C]101.234021739130[/C][C]1.46597826086957[/C][/ROW]
[ROW][C]27[/C][C]98.1[/C][C]99.1540217391304[/C][C]-1.05402173913044[/C][/ROW]
[ROW][C]28[/C][C]104.5[/C][C]107.794021739130[/C][C]-3.29402173913044[/C][/ROW]
[ROW][C]29[/C][C]87.4[/C][C]84.1940217391304[/C][C]3.20597826086957[/C][/ROW]
[ROW][C]30[/C][C]89.9[/C][C]93.4940217391304[/C][C]-3.59402173913043[/C][/ROW]
[ROW][C]31[/C][C]109.8[/C][C]109[/C][C]0.799999999999996[/C][/ROW]
[ROW][C]32[/C][C]111.7[/C][C]109.98[/C][C]1.72000000000000[/C][/ROW]
[ROW][C]33[/C][C]98.6[/C][C]103.06[/C][C]-4.46000000000001[/C][/ROW]
[ROW][C]34[/C][C]96.9[/C][C]96.7[/C][C]0.200000000000004[/C][/ROW]
[ROW][C]35[/C][C]95.1[/C][C]96.46[/C][C]-1.36000000000001[/C][/ROW]
[ROW][C]36[/C][C]97[/C][C]97.34[/C][C]-0.34[/C][/ROW]
[ROW][C]37[/C][C]112.7[/C][C]109.407463768116[/C][C]3.29253623188405[/C][/ROW]
[ROW][C]38[/C][C]102.9[/C][C]102.392246376812[/C][C]0.507753623188412[/C][/ROW]
[ROW][C]39[/C][C]97.4[/C][C]100.312246376812[/C][C]-2.91224637681159[/C][/ROW]
[ROW][C]40[/C][C]111.4[/C][C]108.952246376812[/C][C]2.44775362318841[/C][/ROW]
[ROW][C]41[/C][C]87.4[/C][C]85.3522463768116[/C][C]2.04775362318841[/C][/ROW]
[ROW][C]42[/C][C]96.8[/C][C]94.6522463768116[/C][C]2.14775362318841[/C][/ROW]
[ROW][C]43[/C][C]114.1[/C][C]110.158224637681[/C][C]3.94177536231884[/C][/ROW]
[ROW][C]44[/C][C]110.3[/C][C]111.138224637681[/C][C]-0.838224637681161[/C][/ROW]
[ROW][C]45[/C][C]103.9[/C][C]104.218224637681[/C][C]-0.318224637681153[/C][/ROW]
[ROW][C]46[/C][C]101.6[/C][C]97.8582246376812[/C][C]3.74177536231883[/C][/ROW]
[ROW][C]47[/C][C]94.6[/C][C]97.6182246376812[/C][C]-3.01822463768117[/C][/ROW]
[ROW][C]48[/C][C]95.9[/C][C]98.4982246376812[/C][C]-2.59822463768115[/C][/ROW]
[ROW][C]49[/C][C]104.7[/C][C]110.565688405797[/C][C]-5.86568840579711[/C][/ROW]
[ROW][C]50[/C][C]102.8[/C][C]103.550471014493[/C][C]-0.750471014492755[/C][/ROW]
[ROW][C]51[/C][C]98.1[/C][C]101.470471014493[/C][C]-3.37047101449276[/C][/ROW]
[ROW][C]52[/C][C]113.9[/C][C]110.110471014493[/C][C]3.78952898550725[/C][/ROW]
[ROW][C]53[/C][C]80.9[/C][C]86.5104710144928[/C][C]-5.61047101449275[/C][/ROW]
[ROW][C]54[/C][C]95.7[/C][C]95.8104710144927[/C][C]-0.110471014492748[/C][/ROW]
[ROW][C]55[/C][C]113.2[/C][C]111.316449275362[/C][C]1.88355072463768[/C][/ROW]
[ROW][C]56[/C][C]105.9[/C][C]112.296449275362[/C][C]-6.39644927536232[/C][/ROW]
[ROW][C]57[/C][C]108.8[/C][C]105.376449275362[/C][C]3.42355072463768[/C][/ROW]
[ROW][C]58[/C][C]102.3[/C][C]99.0164492753623[/C][C]3.28355072463768[/C][/ROW]
[ROW][C]59[/C][C]99[/C][C]98.7764492753623[/C][C]0.223550724637683[/C][/ROW]
[ROW][C]60[/C][C]100.7[/C][C]99.6564492753623[/C][C]1.04355072463768[/C][/ROW]
[ROW][C]61[/C][C]115.5[/C][C]111.723913043478[/C][C]3.77608695652173[/C][/ROW]
[/TABLE]
Source: https://freestatistics.org/blog/index.php?pk=25839&T=4

Globally Unique Identifier (entire table): ba.freestatistics.org/blog/index.php?pk=25839&T=4

As an alternative you can also use a QR Code:  

The GUIDs for individual cells are displayed in the table below:

Multiple Linear Regression - Actuals, Interpolation, and Residuals
Time or IndexActualsInterpolationForecastResidualsPrediction Error
1110.4107.6626811594202.73731884057975
296.4100.647463768116-4.24746376811595
3101.998.5674637681163.33253623188405
4106.2107.207463768116-1.00746376811595
58183.607463768116-2.60746376811595
694.792.9074637681161.79253623188405
7101106.683550724638-5.68355072463768
8109.4107.6635507246381.73644927536232
9102.3100.7435507246381.55644927536232
1090.794.3835507246377-3.68355072463767
1196.294.14355072463772.05644927536232
1296.195.02355072463771.07644927536231
13106107.091014492754-1.09101449275363
14103.1100.0757971014493.02420289855072
1510297.99579710144934.00420289855073
16104.7106.635797101449-1.93579710144927
178683.03579710144932.96420289855072
1892.192.3357971014493-0.235797101449278
19106.9107.841775362319-0.941775362318836
20112.6108.8217753623193.77822463768115
21101.7101.901775362319-0.201775362318837
229295.5417753623188-3.54177536231884
2397.495.30177536231882.09822463768117
249796.18177536231880.81822463768116
25105.4108.249239130435-2.84923913043479
26102.7101.2340217391301.46597826086957
2798.199.1540217391304-1.05402173913044
28104.5107.794021739130-3.29402173913044
2987.484.19402173913043.20597826086957
3089.993.4940217391304-3.59402173913043
31109.81090.799999999999996
32111.7109.981.72000000000000
3398.6103.06-4.46000000000001
3496.996.70.200000000000004
3595.196.46-1.36000000000001
369797.34-0.34
37112.7109.4074637681163.29253623188405
38102.9102.3922463768120.507753623188412
3997.4100.312246376812-2.91224637681159
40111.4108.9522463768122.44775362318841
4187.485.35224637681162.04775362318841
4296.894.65224637681162.14775362318841
43114.1110.1582246376813.94177536231884
44110.3111.138224637681-0.838224637681161
45103.9104.218224637681-0.318224637681153
46101.697.85822463768123.74177536231883
4794.697.6182246376812-3.01822463768117
4895.998.4982246376812-2.59822463768115
49104.7110.565688405797-5.86568840579711
50102.8103.550471014493-0.750471014492755
5198.1101.470471014493-3.37047101449276
52113.9110.1104710144933.78952898550725
5380.986.5104710144928-5.61047101449275
5495.795.8104710144927-0.110471014492748
55113.2111.3164492753621.88355072463768
56105.9112.296449275362-6.39644927536232
57108.8105.3764492753623.42355072463768
58102.399.01644927536233.28355072463768
599998.77644927536230.223550724637683
60100.799.65644927536231.04355072463768
61115.5111.7239130434783.77608695652173


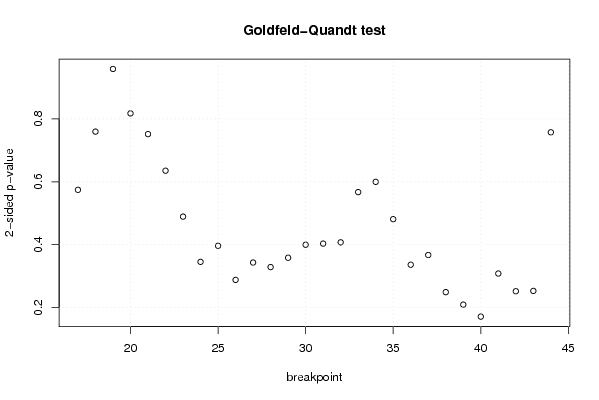
Goldfeld-Quandt test for Heteroskedasticity
p-valuesAlternative Hypothesis
breakpoint indexgreater2-sidedless
170.7128135486188250.574372902762350.287186451381175
180.6201393039277830.7597213921444350.379860696072217
190.4796739157821010.9593478315642030.520326084217899
200.4089428353924470.8178856707848940.591057164607553
210.3759108335181460.7518216670362920.624089166481854
220.3176366282949370.6352732565898740.682363371705063
230.2445378237795230.4890756475590450.755462176220477
240.172510505315220.345021010630440.82748949468478
250.1980770057587610.3961540115175220.801922994241239
260.1437756370188980.2875512740377950.856224362981102
270.1713861980056280.3427723960112560.828613801994372
280.1641360624988930.3282721249977850.835863937501107
290.1790102420928310.3580204841856610.82098975790717
300.1997215194313770.3994430388627550.800278480568623
310.2015596933666520.4031193867333040.798440306633348
320.2035765901994730.4071531803989450.796423409800527
330.283539937548910.567079875097820.71646006245109
340.2999053397863830.5998106795727660.700094660213617
350.2404489519156210.4808979038312420.759551048084379
360.1679207685930390.3358415371860790.83207923140696
370.1833472500754580.3666945001509170.816652749924542
380.1242362418910670.2484724837821350.875763758108933
390.1043598623259050.2087197246518090.895640137674095
400.08521831420258470.1704366284051690.914781685797415
410.1538703205197250.3077406410394490.846129679480276
420.1257001900200930.2514003800401860.874299809979907
430.1262455032515940.2524910065031870.873754496748406
440.3788028584797650.7576057169595290.621197141520236

\begin{tabular}{lllllllll}
\hline
Goldfeld-Quandt test for Heteroskedasticity \tabularnewline
p-values & Alternative Hypothesis \tabularnewline
breakpoint index & greater & 2-sided & less \tabularnewline
17 & 0.712813548618825 & 0.57437290276235 & 0.287186451381175 \tabularnewline
18 & 0.620139303927783 & 0.759721392144435 & 0.379860696072217 \tabularnewline
19 & 0.479673915782101 & 0.959347831564203 & 0.520326084217899 \tabularnewline
20 & 0.408942835392447 & 0.817885670784894 & 0.591057164607553 \tabularnewline
21 & 0.375910833518146 & 0.751821667036292 & 0.624089166481854 \tabularnewline
22 & 0.317636628294937 & 0.635273256589874 & 0.682363371705063 \tabularnewline
23 & 0.244537823779523 & 0.489075647559045 & 0.755462176220477 \tabularnewline
24 & 0.17251050531522 & 0.34502101063044 & 0.82748949468478 \tabularnewline
25 & 0.198077005758761 & 0.396154011517522 & 0.801922994241239 \tabularnewline
26 & 0.143775637018898 & 0.287551274037795 & 0.856224362981102 \tabularnewline
27 & 0.171386198005628 & 0.342772396011256 & 0.828613801994372 \tabularnewline
28 & 0.164136062498893 & 0.328272124997785 & 0.835863937501107 \tabularnewline
29 & 0.179010242092831 & 0.358020484185661 & 0.82098975790717 \tabularnewline
30 & 0.199721519431377 & 0.399443038862755 & 0.800278480568623 \tabularnewline
31 & 0.201559693366652 & 0.403119386733304 & 0.798440306633348 \tabularnewline
32 & 0.203576590199473 & 0.407153180398945 & 0.796423409800527 \tabularnewline
33 & 0.28353993754891 & 0.56707987509782 & 0.71646006245109 \tabularnewline
34 & 0.299905339786383 & 0.599810679572766 & 0.700094660213617 \tabularnewline
35 & 0.240448951915621 & 0.480897903831242 & 0.759551048084379 \tabularnewline
36 & 0.167920768593039 & 0.335841537186079 & 0.83207923140696 \tabularnewline
37 & 0.183347250075458 & 0.366694500150917 & 0.816652749924542 \tabularnewline
38 & 0.124236241891067 & 0.248472483782135 & 0.875763758108933 \tabularnewline
39 & 0.104359862325905 & 0.208719724651809 & 0.895640137674095 \tabularnewline
40 & 0.0852183142025847 & 0.170436628405169 & 0.914781685797415 \tabularnewline
41 & 0.153870320519725 & 0.307740641039449 & 0.846129679480276 \tabularnewline
42 & 0.125700190020093 & 0.251400380040186 & 0.874299809979907 \tabularnewline
43 & 0.126245503251594 & 0.252491006503187 & 0.873754496748406 \tabularnewline
44 & 0.378802858479765 & 0.757605716959529 & 0.621197141520236 \tabularnewline
\hline
\end{tabular}
%Source: https://freestatistics.org/blog/index.php?pk=25839&T=5

[TABLE]
[ROW][C]Goldfeld-Quandt test for Heteroskedasticity[/C][/ROW]
[ROW][C]p-values[/C][C]Alternative Hypothesis[/C][/ROW]
[ROW][C]breakpoint index[/C][C]greater[/C][C]2-sided[/C][C]less[/C][/ROW]
[ROW][C]17[/C][C]0.712813548618825[/C][C]0.57437290276235[/C][C]0.287186451381175[/C][/ROW]
[ROW][C]18[/C][C]0.620139303927783[/C][C]0.759721392144435[/C][C]0.379860696072217[/C][/ROW]
[ROW][C]19[/C][C]0.479673915782101[/C][C]0.959347831564203[/C][C]0.520326084217899[/C][/ROW]
[ROW][C]20[/C][C]0.408942835392447[/C][C]0.817885670784894[/C][C]0.591057164607553[/C][/ROW]
[ROW][C]21[/C][C]0.375910833518146[/C][C]0.751821667036292[/C][C]0.624089166481854[/C][/ROW]
[ROW][C]22[/C][C]0.317636628294937[/C][C]0.635273256589874[/C][C]0.682363371705063[/C][/ROW]
[ROW][C]23[/C][C]0.244537823779523[/C][C]0.489075647559045[/C][C]0.755462176220477[/C][/ROW]
[ROW][C]24[/C][C]0.17251050531522[/C][C]0.34502101063044[/C][C]0.82748949468478[/C][/ROW]
[ROW][C]25[/C][C]0.198077005758761[/C][C]0.396154011517522[/C][C]0.801922994241239[/C][/ROW]
[ROW][C]26[/C][C]0.143775637018898[/C][C]0.287551274037795[/C][C]0.856224362981102[/C][/ROW]
[ROW][C]27[/C][C]0.171386198005628[/C][C]0.342772396011256[/C][C]0.828613801994372[/C][/ROW]
[ROW][C]28[/C][C]0.164136062498893[/C][C]0.328272124997785[/C][C]0.835863937501107[/C][/ROW]
[ROW][C]29[/C][C]0.179010242092831[/C][C]0.358020484185661[/C][C]0.82098975790717[/C][/ROW]
[ROW][C]30[/C][C]0.199721519431377[/C][C]0.399443038862755[/C][C]0.800278480568623[/C][/ROW]
[ROW][C]31[/C][C]0.201559693366652[/C][C]0.403119386733304[/C][C]0.798440306633348[/C][/ROW]
[ROW][C]32[/C][C]0.203576590199473[/C][C]0.407153180398945[/C][C]0.796423409800527[/C][/ROW]
[ROW][C]33[/C][C]0.28353993754891[/C][C]0.56707987509782[/C][C]0.71646006245109[/C][/ROW]
[ROW][C]34[/C][C]0.299905339786383[/C][C]0.599810679572766[/C][C]0.700094660213617[/C][/ROW]
[ROW][C]35[/C][C]0.240448951915621[/C][C]0.480897903831242[/C][C]0.759551048084379[/C][/ROW]
[ROW][C]36[/C][C]0.167920768593039[/C][C]0.335841537186079[/C][C]0.83207923140696[/C][/ROW]
[ROW][C]37[/C][C]0.183347250075458[/C][C]0.366694500150917[/C][C]0.816652749924542[/C][/ROW]
[ROW][C]38[/C][C]0.124236241891067[/C][C]0.248472483782135[/C][C]0.875763758108933[/C][/ROW]
[ROW][C]39[/C][C]0.104359862325905[/C][C]0.208719724651809[/C][C]0.895640137674095[/C][/ROW]
[ROW][C]40[/C][C]0.0852183142025847[/C][C]0.170436628405169[/C][C]0.914781685797415[/C][/ROW]
[ROW][C]41[/C][C]0.153870320519725[/C][C]0.307740641039449[/C][C]0.846129679480276[/C][/ROW]
[ROW][C]42[/C][C]0.125700190020093[/C][C]0.251400380040186[/C][C]0.874299809979907[/C][/ROW]
[ROW][C]43[/C][C]0.126245503251594[/C][C]0.252491006503187[/C][C]0.873754496748406[/C][/ROW]
[ROW][C]44[/C][C]0.378802858479765[/C][C]0.757605716959529[/C][C]0.621197141520236[/C][/ROW]
[/TABLE]
Source: https://freestatistics.org/blog/index.php?pk=25839&T=5

Globally Unique Identifier (entire table): ba.freestatistics.org/blog/index.php?pk=25839&T=5

As an alternative you can also use a QR Code:  

The GUIDs for individual cells are displayed in the table below:

Goldfeld-Quandt test for Heteroskedasticity
p-valuesAlternative Hypothesis
breakpoint indexgreater2-sidedless
170.7128135486188250.574372902762350.287186451381175
180.6201393039277830.7597213921444350.379860696072217
190.4796739157821010.9593478315642030.520326084217899
200.4089428353924470.8178856707848940.591057164607553
210.3759108335181460.7518216670362920.624089166481854
220.3176366282949370.6352732565898740.682363371705063
230.2445378237795230.4890756475590450.755462176220477
240.172510505315220.345021010630440.82748949468478
250.1980770057587610.3961540115175220.801922994241239
260.1437756370188980.2875512740377950.856224362981102
270.1713861980056280.3427723960112560.828613801994372
280.1641360624988930.3282721249977850.835863937501107
290.1790102420928310.3580204841856610.82098975790717
300.1997215194313770.3994430388627550.800278480568623
310.2015596933666520.4031193867333040.798440306633348
320.2035765901994730.4071531803989450.796423409800527
330.283539937548910.567079875097820.71646006245109
340.2999053397863830.5998106795727660.700094660213617
350.2404489519156210.4808979038312420.759551048084379
360.1679207685930390.3358415371860790.83207923140696
370.1833472500754580.3666945001509170.816652749924542
380.1242362418910670.2484724837821350.875763758108933
390.1043598623259050.2087197246518090.895640137674095
400.08521831420258470.1704366284051690.914781685797415
410.1538703205197250.3077406410394490.846129679480276
420.1257001900200930.2514003800401860.874299809979907
430.1262455032515940.2524910065031870.873754496748406
440.3788028584797650.7576057169595290.621197141520236


Meta Analysis of Goldfeld-Quandt test for Heteroskedasticity
Description# significant tests% significant testsOK/NOK
1% type I error level00OK
5% type I error level00OK
10% type I error level00OK

\begin{tabular}{lllllllll}
\hline
Meta Analysis of Goldfeld-Quandt test for Heteroskedasticity \tabularnewline
Description & # significant tests & % significant tests & OK/NOK \tabularnewline
1% type I error level & 0 & 0 & OK \tabularnewline
5% type I error level & 0 & 0 & OK \tabularnewline
10% type I error level & 0 & 0 & OK \tabularnewline
\hline
\end{tabular}
%Source: https://freestatistics.org/blog/index.php?pk=25839&T=6

[TABLE]
[ROW][C]Meta Analysis of Goldfeld-Quandt test for Heteroskedasticity[/C][/ROW]
[ROW][C]Description[/C][C]# significant tests[/C][C]% significant tests[/C][C]OK/NOK[/C][/ROW]
[ROW][C]1% type I error level[/C][C]0[/C][C]0[/C][C]OK[/C][/ROW]
[ROW][C]5% type I error level[/C][C]0[/C][C]0[/C][C]OK[/C][/ROW]
[ROW][C]10% type I error level[/C][C]0[/C][C]0[/C][C]OK[/C][/ROW]
[/TABLE]
Source: https://freestatistics.org/blog/index.php?pk=25839&T=6

Globally Unique Identifier (entire table): ba.freestatistics.org/blog/index.php?pk=25839&T=6

As an alternative you can also use a QR Code:  

The GUIDs for individual cells are displayed in the table below:

Meta Analysis of Goldfeld-Quandt test for Heteroskedasticity
Description# significant tests% significant testsOK/NOK
1% type I error level00OK
5% type I error level00OK
10% type I error level00OK


Parameters (Session):
par1 = 1 ; par2 = Include Monthly Dummies ; par3 = Linear Trend ;
Parameters (R input):
par1 = 1 ; par2 = Include Monthly Dummies ; par3 = Linear Trend ;
R code (references can be found in the software module):
library(lattice)
library(lmtest)
n25 <- 25 #minimum number of obs. for Goldfeld-Quandt test
par1 <- as.numeric(par1)
x <- t(y)
k <- length(x[1,])
n <- length(x[,1])
x1 <- cbind(x[,par1], x[,1:k!=par1])
mycolnames <- c(colnames(x)[par1], colnames(x)[1:k!=par1])
colnames(x1) <- mycolnames #colnames(x)[par1]
x <- x1
if (par3 == 'First Differences'){
x2 <- array(0, dim=c(n-1,k), dimnames=list(1:(n-1), paste('(1-B)',colnames(x),sep='')))
for (i in 1:n-1) {
for (j in 1:k) {
x2[i,j] <- x[i+1,j] - x[i,j]
}
}
x <- x2
}
if (par2 == 'Include Monthly Dummies'){
x2 <- array(0, dim=c(n,11), dimnames=list(1:n, paste('M', seq(1:11), sep ='')))
for (i in 1:11){
x2[seq(i,n,12),i] <- 1
}
x <- cbind(x, x2)
}
if (par2 == 'Include Quarterly Dummies'){
x2 <- array(0, dim=c(n,3), dimnames=list(1:n, paste('Q', seq(1:3), sep ='')))
for (i in 1:3){
x2[seq(i,n,4),i] <- 1
}
x <- cbind(x, x2)
}
k <- length(x[1,])
if (par3 == 'Linear Trend'){
x <- cbind(x, c(1:n))
colnames(x)[k+1] <- 't'
}
x
k <- length(x[1,])
df <- as.data.frame(x)
(mylm <- lm(df))
(mysum <- summary(mylm))
if (n > n25) {
kp3 <- k + 3
nmkm3 <- n - k - 3
gqarr <- array(NA, dim=c(nmkm3-kp3+1,3))
numgqtests <- 0
numsignificant1 <- 0
numsignificant5 <- 0
numsignificant10 <- 0
for (mypoint in kp3:nmkm3) {
j <- 0
numgqtests <- numgqtests + 1
for (myalt in c('greater', 'two.sided', 'less')) {
j <- j + 1
gqarr[mypoint-kp3+1,j] <- gqtest(mylm, point=mypoint, alternative=myalt)$p.value
}
if (gqarr[mypoint-kp3+1,2] < 0.01) numsignificant1 <- numsignificant1 + 1
if (gqarr[mypoint-kp3+1,2] < 0.05) numsignificant5 <- numsignificant5 + 1
if (gqarr[mypoint-kp3+1,2] < 0.10) numsignificant10 <- numsignificant10 + 1
}
gqarr
}
bitmap(file='test0.png')
plot(x[,1], type='l', main='Actuals and Interpolation', ylab='value of Actuals and Interpolation (dots)', xlab='time or index')
points(x[,1]-mysum$resid)
grid()
dev.off()
bitmap(file='test1.png')
plot(mysum$resid, type='b', pch=19, main='Residuals', ylab='value of Residuals', xlab='time or index')
grid()
dev.off()
bitmap(file='test2.png')
hist(mysum$resid, main='Residual Histogram', xlab='values of Residuals')
grid()
dev.off()
bitmap(file='test3.png')
densityplot(~mysum$resid,col='black',main='Residual Density Plot', xlab='values of Residuals')
dev.off()
bitmap(file='test4.png')
qqnorm(mysum$resid, main='Residual Normal Q-Q Plot')
qqline(mysum$resid)
grid()
dev.off()
(myerror <- as.ts(mysum$resid))
bitmap(file='test5.png')
dum <- cbind(lag(myerror,k=1),myerror)
dum
dum1 <- dum[2:length(myerror),]
dum1
z <- as.data.frame(dum1)
z
plot(z,main=paste('Residual Lag plot, lowess, and regression line'), ylab='values of Residuals', xlab='lagged values of Residuals')
lines(lowess(z))
abline(lm(z))
grid()
dev.off()
bitmap(file='test6.png')
acf(mysum$resid, lag.max=length(mysum$resid)/2, main='Residual Autocorrelation Function')
grid()
dev.off()
bitmap(file='test7.png')
pacf(mysum$resid, lag.max=length(mysum$resid)/2, main='Residual Partial Autocorrelation Function')
grid()
dev.off()
bitmap(file='test8.png')
opar <- par(mfrow = c(2,2), oma = c(0, 0, 1.1, 0))
plot(mylm, las = 1, sub='Residual Diagnostics')
par(opar)
dev.off()
if (n > n25) {
bitmap(file='test9.png')
plot(kp3:nmkm3,gqarr[,2], main='Goldfeld-Quandt test',ylab='2-sided p-value',xlab='breakpoint')
grid()
dev.off()
}
load(file='createtable')
a<-table.start()
a<-table.row.start(a)
a<-table.element(a, 'Multiple Linear Regression - Estimated Regression Equation', 1, TRUE)
a<-table.row.end(a)
myeq <- colnames(x)[1]
myeq <- paste(myeq, '[t] = ', sep='')
for (i in 1:k){
if (mysum$coefficients[i,1] > 0) myeq <- paste(myeq, '+', '')
myeq <- paste(myeq, mysum$coefficients[i,1], sep=' ')
if (rownames(mysum$coefficients)[i] != '(Intercept)') {
myeq <- paste(myeq, rownames(mysum$coefficients)[i], sep='')
if (rownames(mysum$coefficients)[i] != 't') myeq <- paste(myeq, '[t]', sep='')
}
}
myeq <- paste(myeq, ' + e[t]')
a<-table.row.start(a)
a<-table.element(a, myeq)
a<-table.row.end(a)
a<-table.end(a)
table.save(a,file='mytable1.tab')
a<-table.start()
a<-table.row.start(a)
a<-table.element(a,hyperlink('ols1.htm','Multiple Linear Regression - Ordinary Least Squares',''), 6, TRUE)
a<-table.row.end(a)
a<-table.row.start(a)
a<-table.element(a,'Variable',header=TRUE)
a<-table.element(a,'Parameter',header=TRUE)
a<-table.element(a,'S.D.',header=TRUE)
a<-table.element(a,'T-STAT
H0: parameter = 0',header=TRUE)
a<-table.element(a,'2-tail p-value',header=TRUE)
a<-table.element(a,'1-tail p-value',header=TRUE)
a<-table.row.end(a)
for (i in 1:k){
a<-table.row.start(a)
a<-table.element(a,rownames(mysum$coefficients)[i],header=TRUE)
a<-table.element(a,mysum$coefficients[i,1])
a<-table.element(a, round(mysum$coefficients[i,2],6))
a<-table.element(a, round(mysum$coefficients[i,3],4))
a<-table.element(a, round(mysum$coefficients[i,4],6))
a<-table.element(a, round(mysum$coefficients[i,4]/2,6))
a<-table.row.end(a)
}
a<-table.end(a)
table.save(a,file='mytable2.tab')
a<-table.start()
a<-table.row.start(a)
a<-table.element(a, 'Multiple Linear Regression - Regression Statistics', 2, TRUE)
a<-table.row.end(a)
a<-table.row.start(a)
a<-table.element(a, 'Multiple R',1,TRUE)
a<-table.element(a, sqrt(mysum$r.squared))
a<-table.row.end(a)
a<-table.row.start(a)
a<-table.element(a, 'R-squared',1,TRUE)
a<-table.element(a, mysum$r.squared)
a<-table.row.end(a)
a<-table.row.start(a)
a<-table.element(a, 'Adjusted R-squared',1,TRUE)
a<-table.element(a, mysum$adj.r.squared)
a<-table.row.end(a)
a<-table.row.start(a)
a<-table.element(a, 'F-TEST (value)',1,TRUE)
a<-table.element(a, mysum$fstatistic[1])
a<-table.row.end(a)
a<-table.row.start(a)
a<-table.element(a, 'F-TEST (DF numerator)',1,TRUE)
a<-table.element(a, mysum$fstatistic[2])
a<-table.row.end(a)
a<-table.row.start(a)
a<-table.element(a, 'F-TEST (DF denominator)',1,TRUE)
a<-table.element(a, mysum$fstatistic[3])
a<-table.row.end(a)
a<-table.row.start(a)
a<-table.element(a, 'p-value',1,TRUE)
a<-table.element(a, 1-pf(mysum$fstatistic[1],mysum$fstatistic[2],mysum$fstatistic[3]))
a<-table.row.end(a)
a<-table.row.start(a)
a<-table.element(a, 'Multiple Linear Regression - Residual Statistics', 2, TRUE)
a<-table.row.end(a)
a<-table.row.start(a)
a<-table.element(a, 'Residual Standard Deviation',1,TRUE)
a<-table.element(a, mysum$sigma)
a<-table.row.end(a)
a<-table.row.start(a)
a<-table.element(a, 'Sum Squared Residuals',1,TRUE)
a<-table.element(a, sum(myerror*myerror))
a<-table.row.end(a)
a<-table.end(a)
table.save(a,file='mytable3.tab')
a<-table.start()
a<-table.row.start(a)
a<-table.element(a, 'Multiple Linear Regression - Actuals, Interpolation, and Residuals', 4, TRUE)
a<-table.row.end(a)
a<-table.row.start(a)
a<-table.element(a, 'Time or Index', 1, TRUE)
a<-table.element(a, 'Actuals', 1, TRUE)
a<-table.element(a, 'Interpolation
Forecast', 1, TRUE)
a<-table.element(a, 'Residuals
Prediction Error', 1, TRUE)
a<-table.row.end(a)
for (i in 1:n) {
a<-table.row.start(a)
a<-table.element(a,i, 1, TRUE)
a<-table.element(a,x[i])
a<-table.element(a,x[i]-mysum$resid[i])
a<-table.element(a,mysum$resid[i])
a<-table.row.end(a)
}
a<-table.end(a)
table.save(a,file='mytable4.tab')
if (n > n25) {
a<-table.start()
a<-table.row.start(a)
a<-table.element(a,'Goldfeld-Quandt test for Heteroskedasticity',4,TRUE)
a<-table.row.end(a)
a<-table.row.start(a)
a<-table.element(a,'p-values',header=TRUE)
a<-table.element(a,'Alternative Hypothesis',3,header=TRUE)
a<-table.row.end(a)
a<-table.row.start(a)
a<-table.element(a,'breakpoint index',header=TRUE)
a<-table.element(a,'greater',header=TRUE)
a<-table.element(a,'2-sided',header=TRUE)
a<-table.element(a,'less',header=TRUE)
a<-table.row.end(a)
for (mypoint in kp3:nmkm3) {
a<-table.row.start(a)
a<-table.element(a,mypoint,header=TRUE)
a<-table.element(a,gqarr[mypoint-kp3+1,1])
a<-table.element(a,gqarr[mypoint-kp3+1,2])
a<-table.element(a,gqarr[mypoint-kp3+1,3])
a<-table.row.end(a)
}
a<-table.end(a)
table.save(a,file='mytable5.tab')
a<-table.start()
a<-table.row.start(a)
a<-table.element(a,'Meta Analysis of Goldfeld-Quandt test for Heteroskedasticity',4,TRUE)
a<-table.row.end(a)
a<-table.row.start(a)
a<-table.element(a,'Description',header=TRUE)
a<-table.element(a,'# significant tests',header=TRUE)
a<-table.element(a,'% significant tests',header=TRUE)
a<-table.element(a,'OK/NOK',header=TRUE)
a<-table.row.end(a)
a<-table.row.start(a)
a<-table.element(a,'1% type I error level',header=TRUE)
a<-table.element(a,numsignificant1)
a<-table.element(a,numsignificant1/numgqtests)
if (numsignificant1/numgqtests < 0.01) dum <- 'OK' else dum <- 'NOK'
a<-table.element(a,dum)
a<-table.row.end(a)
a<-table.row.start(a)
a<-table.element(a,'5% type I error level',header=TRUE)
a<-table.element(a,numsignificant5)
a<-table.element(a,numsignificant5/numgqtests)
if (numsignificant5/numgqtests < 0.05) dum <- 'OK' else dum <- 'NOK'
a<-table.element(a,dum)
a<-table.row.end(a)
a<-table.row.start(a)
a<-table.element(a,'10% type I error level',header=TRUE)
a<-table.element(a,numsignificant10)
a<-table.element(a,numsignificant10/numgqtests)
if (numsignificant10/numgqtests < 0.1) dum <- 'OK' else dum <- 'NOK'
a<-table.element(a,dum)
a<-table.row.end(a)
a<-table.end(a)
table.save(a,file='mytable6.tab')
}