Free Statistics

of Irreproducible Research!

Author's title

Author*Unverified author*
R Software Modulerwasp_multipleregression.wasp
Title produced by softwareMultiple Regression
Date of computationThu, 27 Nov 2008 15:47:32 -0700
Cite this page as followsStatistical Computations at FreeStatistics.org, Office for Research Development and Education, URL https://freestatistics.org/blog/index.php?v=date/2008/Nov/27/t1227826082ggg6kr62xtztxqc.htm/, Retrieved Sun, 19 May 2024 06:44:34 +0000
Statistical Computations at FreeStatistics.org, Office for Research Development and Education, URL https://freestatistics.org/blog/index.php?pk=25942, Retrieved Sun, 19 May 2024 06:44:34 +0000
QR Codes:

Original text written by user:
IsPrivate?No (this computation is public)
User-defined keywords
Estimated Impact139
Family? (F = Feedback message, R = changed R code, M = changed R Module, P = changed Parameters, D = changed Data)
-       [Multiple Regression] [] [2008-11-27 22:47:32] [707275eb4030c85d1414565d3cd5b4f2] [Current]
Feedback Forum

Post a new message
Dataseries X:
2120.88	0
2174.56	0
2196.72	0
2350.44	0
2440.25	0
2408.64	0
2472.81	0
2407.6	0
2454.62	0
2448.05	0
2497.84	0
2645.64	0
2756.76	0
2849.27	0
2921.44	0
2981.85	0
3080.58	0
3106.22	0
3119.31	0
3061.26	0
3097.31	0
3161.69	0
3257.16	0
3277.01	0
3295.32	0
3363.99	0
3494.17	0
3667.03	0
3813.06	0
3917.96	0
3895.51	0
3801.06	0
3570.12	0
3701.61	0
3862.27	0
3970.1	0
4138.52	0
4199.75	0
4290.89	0
4443.91	0
4502.64	1
4356.98	1
4591.27	1
4696.96	1
4621.4	1
4562.84	1
4202.52	1
4296.49	1
4435.23	1
4105.18	1
4116.68	1
3844.49	1
3720.98	1
3674.4	1
3857.62	1
3801.06	1
3504.37	1
3032.6	1
3047.03	1
2962.34	1
2197.82	1


Summary of computational transaction
Raw Inputview raw input (R code)
Raw Outputview raw output of R engine
Computing time4 seconds
R Server'George Udny Yule' @ 72.249.76.132

\begin{tabular}{lllllllll}
\hline
Summary of computational transaction \tabularnewline
Raw Input & view raw input (R code)  \tabularnewline
Raw Output & view raw output of R engine  \tabularnewline
Computing time & 4 seconds \tabularnewline
R Server & 'George Udny Yule' @ 72.249.76.132 \tabularnewline
\hline
\end{tabular}
%Source: https://freestatistics.org/blog/index.php?pk=25942&T=0

[TABLE]
[ROW][C]Summary of computational transaction[/C][/ROW]
[ROW][C]Raw Input[/C][C]view raw input (R code) [/C][/ROW]
[ROW][C]Raw Output[/C][C]view raw output of R engine [/C][/ROW]
[ROW][C]Computing time[/C][C]4 seconds[/C][/ROW]
[ROW][C]R Server[/C][C]'George Udny Yule' @ 72.249.76.132[/C][/ROW]
[/TABLE]
Source: https://freestatistics.org/blog/index.php?pk=25942&T=0

Globally Unique Identifier (entire table): ba.freestatistics.org/blog/index.php?pk=25942&T=0

As an alternative you can also use a QR Code:  

The GUIDs for individual cells are displayed in the table below:

Summary of computational transaction
Raw Inputview raw input (R code)
Raw Outputview raw output of R engine
Computing time4 seconds
R Server'George Udny Yule' @ 72.249.76.132


Multiple Linear Regression - Estimated Regression Equation
Bel20[t] = + 3128.62668 + 754.2233dummy[t] -222.612779999999M1[t] + 59.0786599999997M2[t] + 124.508659999999M3[t] + 178.072659999999M4[t] + 81.1859999999996M5[t] + 62.523999999999M6[t] + 156.987999999999M7[t] + 123.271999999999M8[t] + 19.247999999999M9[t] -48.9580000000007M10[t] -56.9520000000007M11[t] + e[t]

\begin{tabular}{lllllllll}
\hline
Multiple Linear Regression - Estimated Regression Equation \tabularnewline
Bel20[t] =  +  3128.62668 +  754.2233dummy[t] -222.612779999999M1[t] +  59.0786599999997M2[t] +  124.508659999999M3[t] +  178.072659999999M4[t] +  81.1859999999996M5[t] +  62.523999999999M6[t] +  156.987999999999M7[t] +  123.271999999999M8[t] +  19.247999999999M9[t] -48.9580000000007M10[t] -56.9520000000007M11[t]  + e[t] \tabularnewline
\hline
\end{tabular}
%Source: https://freestatistics.org/blog/index.php?pk=25942&T=1

[TABLE]
[ROW][C]Multiple Linear Regression - Estimated Regression Equation[/C][/ROW]
[ROW][C]Bel20[t] =  +  3128.62668 +  754.2233dummy[t] -222.612779999999M1[t] +  59.0786599999997M2[t] +  124.508659999999M3[t] +  178.072659999999M4[t] +  81.1859999999996M5[t] +  62.523999999999M6[t] +  156.987999999999M7[t] +  123.271999999999M8[t] +  19.247999999999M9[t] -48.9580000000007M10[t] -56.9520000000007M11[t]  + e[t][/C][/ROW]
[/TABLE]
Source: https://freestatistics.org/blog/index.php?pk=25942&T=1

Globally Unique Identifier (entire table): ba.freestatistics.org/blog/index.php?pk=25942&T=1

As an alternative you can also use a QR Code:  

The GUIDs for individual cells are displayed in the table below:

Multiple Linear Regression - Estimated Regression Equation
Bel20[t] = + 3128.62668 + 754.2233dummy[t] -222.612779999999M1[t] + 59.0786599999997M2[t] + 124.508659999999M3[t] + 178.072659999999M4[t] + 81.1859999999996M5[t] + 62.523999999999M6[t] + 156.987999999999M7[t] + 123.271999999999M8[t] + 19.247999999999M9[t] -48.9580000000007M10[t] -56.9520000000007M11[t] + e[t]


Multiple Linear Regression - Ordinary Least Squares
VariableParameterS.D.T-STATH0: parameter = 02-tail p-value1-tail p-value
(Intercept)3128.62668331.2031899.446200
dummy754.2233196.9959113.82860.0003730.000187
M1-222.612779999999435.772291-0.51080.61180.3059
M259.0786599999997456.6454160.12940.8976010.448801
M3124.508659999999456.6454160.27270.7862850.393142
M4178.072659999999456.6454160.390.6982920.349146
M581.1859999999996454.9425680.17850.8591180.429559
M662.523999999999454.9425680.13740.8912640.445632
M7156.987999999999454.9425680.34510.7315480.365774
M8123.271999999999454.9425680.2710.7875820.393791
M919.247999999999454.9425680.04230.9664280.483214
M10-48.9580000000007454.942568-0.10760.9147510.457375
M11-56.9520000000007454.942568-0.12520.90090.45045

\begin{tabular}{lllllllll}
\hline
Multiple Linear Regression - Ordinary Least Squares \tabularnewline
Variable & Parameter & S.D. & T-STATH0: parameter = 0 & 2-tail p-value & 1-tail p-value \tabularnewline
(Intercept) & 3128.62668 & 331.203189 & 9.4462 & 0 & 0 \tabularnewline
dummy & 754.2233 & 196.995911 & 3.8286 & 0.000373 & 0.000187 \tabularnewline
M1 & -222.612779999999 & 435.772291 & -0.5108 & 0.6118 & 0.3059 \tabularnewline
M2 & 59.0786599999997 & 456.645416 & 0.1294 & 0.897601 & 0.448801 \tabularnewline
M3 & 124.508659999999 & 456.645416 & 0.2727 & 0.786285 & 0.393142 \tabularnewline
M4 & 178.072659999999 & 456.645416 & 0.39 & 0.698292 & 0.349146 \tabularnewline
M5 & 81.1859999999996 & 454.942568 & 0.1785 & 0.859118 & 0.429559 \tabularnewline
M6 & 62.523999999999 & 454.942568 & 0.1374 & 0.891264 & 0.445632 \tabularnewline
M7 & 156.987999999999 & 454.942568 & 0.3451 & 0.731548 & 0.365774 \tabularnewline
M8 & 123.271999999999 & 454.942568 & 0.271 & 0.787582 & 0.393791 \tabularnewline
M9 & 19.247999999999 & 454.942568 & 0.0423 & 0.966428 & 0.483214 \tabularnewline
M10 & -48.9580000000007 & 454.942568 & -0.1076 & 0.914751 & 0.457375 \tabularnewline
M11 & -56.9520000000007 & 454.942568 & -0.1252 & 0.9009 & 0.45045 \tabularnewline
\hline
\end{tabular}
%Source: https://freestatistics.org/blog/index.php?pk=25942&T=2

[TABLE]
[ROW][C]Multiple Linear Regression - Ordinary Least Squares[/C][/ROW]
[ROW][C]Variable[/C][C]Parameter[/C][C]S.D.[/C][C]T-STATH0: parameter = 0[/C][C]2-tail p-value[/C][C]1-tail p-value[/C][/ROW]
[ROW][C](Intercept)[/C][C]3128.62668[/C][C]331.203189[/C][C]9.4462[/C][C]0[/C][C]0[/C][/ROW]
[ROW][C]dummy[/C][C]754.2233[/C][C]196.995911[/C][C]3.8286[/C][C]0.000373[/C][C]0.000187[/C][/ROW]
[ROW][C]M1[/C][C]-222.612779999999[/C][C]435.772291[/C][C]-0.5108[/C][C]0.6118[/C][C]0.3059[/C][/ROW]
[ROW][C]M2[/C][C]59.0786599999997[/C][C]456.645416[/C][C]0.1294[/C][C]0.897601[/C][C]0.448801[/C][/ROW]
[ROW][C]M3[/C][C]124.508659999999[/C][C]456.645416[/C][C]0.2727[/C][C]0.786285[/C][C]0.393142[/C][/ROW]
[ROW][C]M4[/C][C]178.072659999999[/C][C]456.645416[/C][C]0.39[/C][C]0.698292[/C][C]0.349146[/C][/ROW]
[ROW][C]M5[/C][C]81.1859999999996[/C][C]454.942568[/C][C]0.1785[/C][C]0.859118[/C][C]0.429559[/C][/ROW]
[ROW][C]M6[/C][C]62.523999999999[/C][C]454.942568[/C][C]0.1374[/C][C]0.891264[/C][C]0.445632[/C][/ROW]
[ROW][C]M7[/C][C]156.987999999999[/C][C]454.942568[/C][C]0.3451[/C][C]0.731548[/C][C]0.365774[/C][/ROW]
[ROW][C]M8[/C][C]123.271999999999[/C][C]454.942568[/C][C]0.271[/C][C]0.787582[/C][C]0.393791[/C][/ROW]
[ROW][C]M9[/C][C]19.247999999999[/C][C]454.942568[/C][C]0.0423[/C][C]0.966428[/C][C]0.483214[/C][/ROW]
[ROW][C]M10[/C][C]-48.9580000000007[/C][C]454.942568[/C][C]-0.1076[/C][C]0.914751[/C][C]0.457375[/C][/ROW]
[ROW][C]M11[/C][C]-56.9520000000007[/C][C]454.942568[/C][C]-0.1252[/C][C]0.9009[/C][C]0.45045[/C][/ROW]
[/TABLE]
Source: https://freestatistics.org/blog/index.php?pk=25942&T=2

Globally Unique Identifier (entire table): ba.freestatistics.org/blog/index.php?pk=25942&T=2

As an alternative you can also use a QR Code:  

The GUIDs for individual cells are displayed in the table below:

Multiple Linear Regression - Ordinary Least Squares
VariableParameterS.D.T-STATH0: parameter = 02-tail p-value1-tail p-value
(Intercept)3128.62668331.2031899.446200
dummy754.2233196.9959113.82860.0003730.000187
M1-222.612779999999435.772291-0.51080.61180.3059
M259.0786599999997456.6454160.12940.8976010.448801
M3124.508659999999456.6454160.27270.7862850.393142
M4178.072659999999456.6454160.390.6982920.349146
M581.1859999999996454.9425680.17850.8591180.429559
M662.523999999999454.9425680.13740.8912640.445632
M7156.987999999999454.9425680.34510.7315480.365774
M8123.271999999999454.9425680.2710.7875820.393791
M919.247999999999454.9425680.04230.9664280.483214
M10-48.9580000000007454.942568-0.10760.9147510.457375
M11-56.9520000000007454.942568-0.12520.90090.45045


Multiple Linear Regression - Regression Statistics
Multiple R0.501826061360067
R-squared0.251829395860158
Adjusted R-squared0.0647867448251975
F-TEST (value)1.34637417972165
F-TEST (DF numerator)12
F-TEST (DF denominator)48
p-value0.224943719556308
Multiple Linear Regression - Residual Statistics
Residual Standard Deviation719.327359990521
Sum Squared Residuals24836728.8398848

\begin{tabular}{lllllllll}
\hline
Multiple Linear Regression - Regression Statistics \tabularnewline
Multiple R & 0.501826061360067 \tabularnewline
R-squared & 0.251829395860158 \tabularnewline
Adjusted R-squared & 0.0647867448251975 \tabularnewline
F-TEST (value) & 1.34637417972165 \tabularnewline
F-TEST (DF numerator) & 12 \tabularnewline
F-TEST (DF denominator) & 48 \tabularnewline
p-value & 0.224943719556308 \tabularnewline
Multiple Linear Regression - Residual Statistics \tabularnewline
Residual Standard Deviation & 719.327359990521 \tabularnewline
Sum Squared Residuals & 24836728.8398848 \tabularnewline
\hline
\end{tabular}
%Source: https://freestatistics.org/blog/index.php?pk=25942&T=3

[TABLE]
[ROW][C]Multiple Linear Regression - Regression Statistics[/C][/ROW]
[ROW][C]Multiple R[/C][C]0.501826061360067[/C][/ROW]
[ROW][C]R-squared[/C][C]0.251829395860158[/C][/ROW]
[ROW][C]Adjusted R-squared[/C][C]0.0647867448251975[/C][/ROW]
[ROW][C]F-TEST (value)[/C][C]1.34637417972165[/C][/ROW]
[ROW][C]F-TEST (DF numerator)[/C][C]12[/C][/ROW]
[ROW][C]F-TEST (DF denominator)[/C][C]48[/C][/ROW]
[ROW][C]p-value[/C][C]0.224943719556308[/C][/ROW]
[ROW][C]Multiple Linear Regression - Residual Statistics[/C][/ROW]
[ROW][C]Residual Standard Deviation[/C][C]719.327359990521[/C][/ROW]
[ROW][C]Sum Squared Residuals[/C][C]24836728.8398848[/C][/ROW]
[/TABLE]
Source: https://freestatistics.org/blog/index.php?pk=25942&T=3

Globally Unique Identifier (entire table): ba.freestatistics.org/blog/index.php?pk=25942&T=3

As an alternative you can also use a QR Code:  

The GUIDs for individual cells are displayed in the table below:

Multiple Linear Regression - Regression Statistics
Multiple R0.501826061360067
R-squared0.251829395860158
Adjusted R-squared0.0647867448251975
F-TEST (value)1.34637417972165
F-TEST (DF numerator)12
F-TEST (DF denominator)48
p-value0.224943719556308
Multiple Linear Regression - Residual Statistics
Residual Standard Deviation719.327359990521
Sum Squared Residuals24836728.8398848


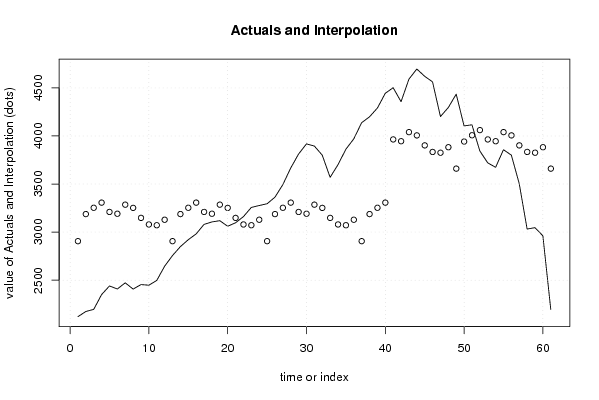
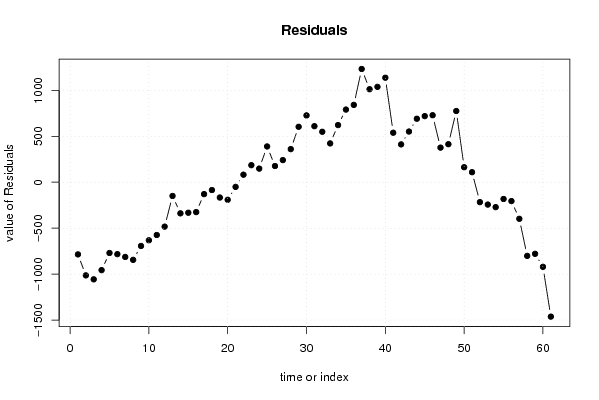
Multiple Linear Regression - Actuals, Interpolation, and Residuals
Time or IndexActualsInterpolationForecastResidualsPrediction Error
12120.882906.01389999999-785.133899999994
22174.563187.70534-1013.14534
32196.723253.13534-1056.41534
42350.443306.69934-956.25934
52440.253209.81268-769.56268
62408.643191.15068-782.51068
72472.813285.61468-812.80468
82407.63251.89868-844.29868
92454.623147.87468-693.25468
102448.053079.66868-631.61868
112497.843071.67468-573.83468
122645.643128.62668-482.986680000001
132756.762906.0139-149.253900000001
142849.273187.70534-338.43534
152921.443253.13534-331.695340000000
162981.853306.69934-324.849339999999
173080.583209.81268-129.232680000000
183106.223191.15068-84.9306799999997
193119.313285.61468-166.30468
203061.263251.89868-190.638680000000
213097.313147.87468-50.56468
223161.693079.6686882.02132
233257.163071.67468185.485320000000
243277.013128.62668148.383319999999
253295.322906.0139389.306099999999
263363.993187.70534176.284660000000
273494.173253.13534241.034660000001
283667.033306.69934360.330660000001
293813.063209.81268603.24732
303917.963191.15068726.80932
313895.513285.61468609.89532
323801.063251.89868549.16132
333570.123147.87468422.24532
343701.613079.66868621.94132
353862.273071.67468790.59532
363970.13128.62668841.47332
374138.522906.01391232.5061
384199.753187.705341012.04466
394290.893253.135341037.75466
404443.913306.699341137.21066
414502.643964.03598538.60402
424356.983945.37398411.60602
434591.274039.83798551.432020000001
444696.964006.12198690.83802
454621.43902.09798719.30202
464562.843833.89198728.94802
474202.523825.89798376.62202
484296.493882.84998413.640019999999
494435.233660.2372774.992799999999
504105.183941.92864163.251360000000
514116.684007.35864109.321360000001
523844.494060.92264-216.432639999999
533720.983964.03598-243.05598
543674.43945.37398-270.973979999999
553857.624039.83798-182.217980000000
563801.064006.12198-205.061980000000
573504.373902.09798-397.72798
583032.63833.89198-801.29198
593047.033825.89798-778.86798
602962.343882.84998-920.50998
612197.823660.2372-1462.41720000000

\begin{tabular}{lllllllll}
\hline
Multiple Linear Regression - Actuals, Interpolation, and Residuals \tabularnewline
Time or Index & Actuals & InterpolationForecast & ResidualsPrediction Error \tabularnewline
1 & 2120.88 & 2906.01389999999 & -785.133899999994 \tabularnewline
2 & 2174.56 & 3187.70534 & -1013.14534 \tabularnewline
3 & 2196.72 & 3253.13534 & -1056.41534 \tabularnewline
4 & 2350.44 & 3306.69934 & -956.25934 \tabularnewline
5 & 2440.25 & 3209.81268 & -769.56268 \tabularnewline
6 & 2408.64 & 3191.15068 & -782.51068 \tabularnewline
7 & 2472.81 & 3285.61468 & -812.80468 \tabularnewline
8 & 2407.6 & 3251.89868 & -844.29868 \tabularnewline
9 & 2454.62 & 3147.87468 & -693.25468 \tabularnewline
10 & 2448.05 & 3079.66868 & -631.61868 \tabularnewline
11 & 2497.84 & 3071.67468 & -573.83468 \tabularnewline
12 & 2645.64 & 3128.62668 & -482.986680000001 \tabularnewline
13 & 2756.76 & 2906.0139 & -149.253900000001 \tabularnewline
14 & 2849.27 & 3187.70534 & -338.43534 \tabularnewline
15 & 2921.44 & 3253.13534 & -331.695340000000 \tabularnewline
16 & 2981.85 & 3306.69934 & -324.849339999999 \tabularnewline
17 & 3080.58 & 3209.81268 & -129.232680000000 \tabularnewline
18 & 3106.22 & 3191.15068 & -84.9306799999997 \tabularnewline
19 & 3119.31 & 3285.61468 & -166.30468 \tabularnewline
20 & 3061.26 & 3251.89868 & -190.638680000000 \tabularnewline
21 & 3097.31 & 3147.87468 & -50.56468 \tabularnewline
22 & 3161.69 & 3079.66868 & 82.02132 \tabularnewline
23 & 3257.16 & 3071.67468 & 185.485320000000 \tabularnewline
24 & 3277.01 & 3128.62668 & 148.383319999999 \tabularnewline
25 & 3295.32 & 2906.0139 & 389.306099999999 \tabularnewline
26 & 3363.99 & 3187.70534 & 176.284660000000 \tabularnewline
27 & 3494.17 & 3253.13534 & 241.034660000001 \tabularnewline
28 & 3667.03 & 3306.69934 & 360.330660000001 \tabularnewline
29 & 3813.06 & 3209.81268 & 603.24732 \tabularnewline
30 & 3917.96 & 3191.15068 & 726.80932 \tabularnewline
31 & 3895.51 & 3285.61468 & 609.89532 \tabularnewline
32 & 3801.06 & 3251.89868 & 549.16132 \tabularnewline
33 & 3570.12 & 3147.87468 & 422.24532 \tabularnewline
34 & 3701.61 & 3079.66868 & 621.94132 \tabularnewline
35 & 3862.27 & 3071.67468 & 790.59532 \tabularnewline
36 & 3970.1 & 3128.62668 & 841.47332 \tabularnewline
37 & 4138.52 & 2906.0139 & 1232.5061 \tabularnewline
38 & 4199.75 & 3187.70534 & 1012.04466 \tabularnewline
39 & 4290.89 & 3253.13534 & 1037.75466 \tabularnewline
40 & 4443.91 & 3306.69934 & 1137.21066 \tabularnewline
41 & 4502.64 & 3964.03598 & 538.60402 \tabularnewline
42 & 4356.98 & 3945.37398 & 411.60602 \tabularnewline
43 & 4591.27 & 4039.83798 & 551.432020000001 \tabularnewline
44 & 4696.96 & 4006.12198 & 690.83802 \tabularnewline
45 & 4621.4 & 3902.09798 & 719.30202 \tabularnewline
46 & 4562.84 & 3833.89198 & 728.94802 \tabularnewline
47 & 4202.52 & 3825.89798 & 376.62202 \tabularnewline
48 & 4296.49 & 3882.84998 & 413.640019999999 \tabularnewline
49 & 4435.23 & 3660.2372 & 774.992799999999 \tabularnewline
50 & 4105.18 & 3941.92864 & 163.251360000000 \tabularnewline
51 & 4116.68 & 4007.35864 & 109.321360000001 \tabularnewline
52 & 3844.49 & 4060.92264 & -216.432639999999 \tabularnewline
53 & 3720.98 & 3964.03598 & -243.05598 \tabularnewline
54 & 3674.4 & 3945.37398 & -270.973979999999 \tabularnewline
55 & 3857.62 & 4039.83798 & -182.217980000000 \tabularnewline
56 & 3801.06 & 4006.12198 & -205.061980000000 \tabularnewline
57 & 3504.37 & 3902.09798 & -397.72798 \tabularnewline
58 & 3032.6 & 3833.89198 & -801.29198 \tabularnewline
59 & 3047.03 & 3825.89798 & -778.86798 \tabularnewline
60 & 2962.34 & 3882.84998 & -920.50998 \tabularnewline
61 & 2197.82 & 3660.2372 & -1462.41720000000 \tabularnewline
\hline
\end{tabular}
%Source: https://freestatistics.org/blog/index.php?pk=25942&T=4

[TABLE]
[ROW][C]Multiple Linear Regression - Actuals, Interpolation, and Residuals[/C][/ROW]
[ROW][C]Time or Index[/C][C]Actuals[/C][C]InterpolationForecast[/C][C]ResidualsPrediction Error[/C][/ROW]
[ROW][C]1[/C][C]2120.88[/C][C]2906.01389999999[/C][C]-785.133899999994[/C][/ROW]
[ROW][C]2[/C][C]2174.56[/C][C]3187.70534[/C][C]-1013.14534[/C][/ROW]
[ROW][C]3[/C][C]2196.72[/C][C]3253.13534[/C][C]-1056.41534[/C][/ROW]
[ROW][C]4[/C][C]2350.44[/C][C]3306.69934[/C][C]-956.25934[/C][/ROW]
[ROW][C]5[/C][C]2440.25[/C][C]3209.81268[/C][C]-769.56268[/C][/ROW]
[ROW][C]6[/C][C]2408.64[/C][C]3191.15068[/C][C]-782.51068[/C][/ROW]
[ROW][C]7[/C][C]2472.81[/C][C]3285.61468[/C][C]-812.80468[/C][/ROW]
[ROW][C]8[/C][C]2407.6[/C][C]3251.89868[/C][C]-844.29868[/C][/ROW]
[ROW][C]9[/C][C]2454.62[/C][C]3147.87468[/C][C]-693.25468[/C][/ROW]
[ROW][C]10[/C][C]2448.05[/C][C]3079.66868[/C][C]-631.61868[/C][/ROW]
[ROW][C]11[/C][C]2497.84[/C][C]3071.67468[/C][C]-573.83468[/C][/ROW]
[ROW][C]12[/C][C]2645.64[/C][C]3128.62668[/C][C]-482.986680000001[/C][/ROW]
[ROW][C]13[/C][C]2756.76[/C][C]2906.0139[/C][C]-149.253900000001[/C][/ROW]
[ROW][C]14[/C][C]2849.27[/C][C]3187.70534[/C][C]-338.43534[/C][/ROW]
[ROW][C]15[/C][C]2921.44[/C][C]3253.13534[/C][C]-331.695340000000[/C][/ROW]
[ROW][C]16[/C][C]2981.85[/C][C]3306.69934[/C][C]-324.849339999999[/C][/ROW]
[ROW][C]17[/C][C]3080.58[/C][C]3209.81268[/C][C]-129.232680000000[/C][/ROW]
[ROW][C]18[/C][C]3106.22[/C][C]3191.15068[/C][C]-84.9306799999997[/C][/ROW]
[ROW][C]19[/C][C]3119.31[/C][C]3285.61468[/C][C]-166.30468[/C][/ROW]
[ROW][C]20[/C][C]3061.26[/C][C]3251.89868[/C][C]-190.638680000000[/C][/ROW]
[ROW][C]21[/C][C]3097.31[/C][C]3147.87468[/C][C]-50.56468[/C][/ROW]
[ROW][C]22[/C][C]3161.69[/C][C]3079.66868[/C][C]82.02132[/C][/ROW]
[ROW][C]23[/C][C]3257.16[/C][C]3071.67468[/C][C]185.485320000000[/C][/ROW]
[ROW][C]24[/C][C]3277.01[/C][C]3128.62668[/C][C]148.383319999999[/C][/ROW]
[ROW][C]25[/C][C]3295.32[/C][C]2906.0139[/C][C]389.306099999999[/C][/ROW]
[ROW][C]26[/C][C]3363.99[/C][C]3187.70534[/C][C]176.284660000000[/C][/ROW]
[ROW][C]27[/C][C]3494.17[/C][C]3253.13534[/C][C]241.034660000001[/C][/ROW]
[ROW][C]28[/C][C]3667.03[/C][C]3306.69934[/C][C]360.330660000001[/C][/ROW]
[ROW][C]29[/C][C]3813.06[/C][C]3209.81268[/C][C]603.24732[/C][/ROW]
[ROW][C]30[/C][C]3917.96[/C][C]3191.15068[/C][C]726.80932[/C][/ROW]
[ROW][C]31[/C][C]3895.51[/C][C]3285.61468[/C][C]609.89532[/C][/ROW]
[ROW][C]32[/C][C]3801.06[/C][C]3251.89868[/C][C]549.16132[/C][/ROW]
[ROW][C]33[/C][C]3570.12[/C][C]3147.87468[/C][C]422.24532[/C][/ROW]
[ROW][C]34[/C][C]3701.61[/C][C]3079.66868[/C][C]621.94132[/C][/ROW]
[ROW][C]35[/C][C]3862.27[/C][C]3071.67468[/C][C]790.59532[/C][/ROW]
[ROW][C]36[/C][C]3970.1[/C][C]3128.62668[/C][C]841.47332[/C][/ROW]
[ROW][C]37[/C][C]4138.52[/C][C]2906.0139[/C][C]1232.5061[/C][/ROW]
[ROW][C]38[/C][C]4199.75[/C][C]3187.70534[/C][C]1012.04466[/C][/ROW]
[ROW][C]39[/C][C]4290.89[/C][C]3253.13534[/C][C]1037.75466[/C][/ROW]
[ROW][C]40[/C][C]4443.91[/C][C]3306.69934[/C][C]1137.21066[/C][/ROW]
[ROW][C]41[/C][C]4502.64[/C][C]3964.03598[/C][C]538.60402[/C][/ROW]
[ROW][C]42[/C][C]4356.98[/C][C]3945.37398[/C][C]411.60602[/C][/ROW]
[ROW][C]43[/C][C]4591.27[/C][C]4039.83798[/C][C]551.432020000001[/C][/ROW]
[ROW][C]44[/C][C]4696.96[/C][C]4006.12198[/C][C]690.83802[/C][/ROW]
[ROW][C]45[/C][C]4621.4[/C][C]3902.09798[/C][C]719.30202[/C][/ROW]
[ROW][C]46[/C][C]4562.84[/C][C]3833.89198[/C][C]728.94802[/C][/ROW]
[ROW][C]47[/C][C]4202.52[/C][C]3825.89798[/C][C]376.62202[/C][/ROW]
[ROW][C]48[/C][C]4296.49[/C][C]3882.84998[/C][C]413.640019999999[/C][/ROW]
[ROW][C]49[/C][C]4435.23[/C][C]3660.2372[/C][C]774.992799999999[/C][/ROW]
[ROW][C]50[/C][C]4105.18[/C][C]3941.92864[/C][C]163.251360000000[/C][/ROW]
[ROW][C]51[/C][C]4116.68[/C][C]4007.35864[/C][C]109.321360000001[/C][/ROW]
[ROW][C]52[/C][C]3844.49[/C][C]4060.92264[/C][C]-216.432639999999[/C][/ROW]
[ROW][C]53[/C][C]3720.98[/C][C]3964.03598[/C][C]-243.05598[/C][/ROW]
[ROW][C]54[/C][C]3674.4[/C][C]3945.37398[/C][C]-270.973979999999[/C][/ROW]
[ROW][C]55[/C][C]3857.62[/C][C]4039.83798[/C][C]-182.217980000000[/C][/ROW]
[ROW][C]56[/C][C]3801.06[/C][C]4006.12198[/C][C]-205.061980000000[/C][/ROW]
[ROW][C]57[/C][C]3504.37[/C][C]3902.09798[/C][C]-397.72798[/C][/ROW]
[ROW][C]58[/C][C]3032.6[/C][C]3833.89198[/C][C]-801.29198[/C][/ROW]
[ROW][C]59[/C][C]3047.03[/C][C]3825.89798[/C][C]-778.86798[/C][/ROW]
[ROW][C]60[/C][C]2962.34[/C][C]3882.84998[/C][C]-920.50998[/C][/ROW]
[ROW][C]61[/C][C]2197.82[/C][C]3660.2372[/C][C]-1462.41720000000[/C][/ROW]
[/TABLE]
Source: https://freestatistics.org/blog/index.php?pk=25942&T=4

Globally Unique Identifier (entire table): ba.freestatistics.org/blog/index.php?pk=25942&T=4

As an alternative you can also use a QR Code:  

The GUIDs for individual cells are displayed in the table below:

Multiple Linear Regression - Actuals, Interpolation, and Residuals
Time or IndexActualsInterpolationForecastResidualsPrediction Error
12120.882906.01389999999-785.133899999994
22174.563187.70534-1013.14534
32196.723253.13534-1056.41534
42350.443306.69934-956.25934
52440.253209.81268-769.56268
62408.643191.15068-782.51068
72472.813285.61468-812.80468
82407.63251.89868-844.29868
92454.623147.87468-693.25468
102448.053079.66868-631.61868
112497.843071.67468-573.83468
122645.643128.62668-482.986680000001
132756.762906.0139-149.253900000001
142849.273187.70534-338.43534
152921.443253.13534-331.695340000000
162981.853306.69934-324.849339999999
173080.583209.81268-129.232680000000
183106.223191.15068-84.9306799999997
193119.313285.61468-166.30468
203061.263251.89868-190.638680000000
213097.313147.87468-50.56468
223161.693079.6686882.02132
233257.163071.67468185.485320000000
243277.013128.62668148.383319999999
253295.322906.0139389.306099999999
263363.993187.70534176.284660000000
273494.173253.13534241.034660000001
283667.033306.69934360.330660000001
293813.063209.81268603.24732
303917.963191.15068726.80932
313895.513285.61468609.89532
323801.063251.89868549.16132
333570.123147.87468422.24532
343701.613079.66868621.94132
353862.273071.67468790.59532
363970.13128.62668841.47332
374138.522906.01391232.5061
384199.753187.705341012.04466
394290.893253.135341037.75466
404443.913306.699341137.21066
414502.643964.03598538.60402
424356.983945.37398411.60602
434591.274039.83798551.432020000001
444696.964006.12198690.83802
454621.43902.09798719.30202
464562.843833.89198728.94802
474202.523825.89798376.62202
484296.493882.84998413.640019999999
494435.233660.2372774.992799999999
504105.183941.92864163.251360000000
514116.684007.35864109.321360000001
523844.494060.92264-216.432639999999
533720.983964.03598-243.05598
543674.43945.37398-270.973979999999
553857.624039.83798-182.217980000000
563801.064006.12198-205.061980000000
573504.373902.09798-397.72798
583032.63833.89198-801.29198
593047.033825.89798-778.86798
602962.343882.84998-920.50998
612197.823660.2372-1462.41720000000


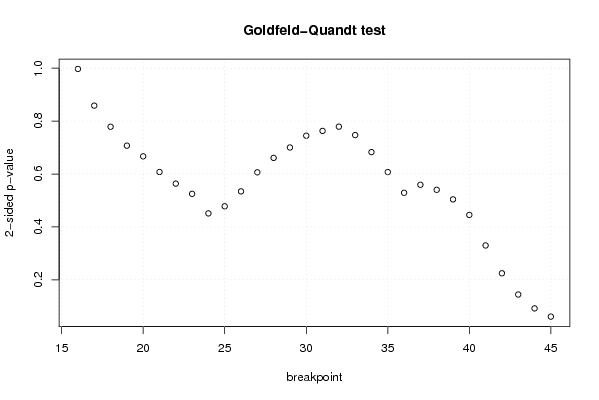
Goldfeld-Quandt test for Heteroskedasticity
p-valuesAlternative Hypothesis
breakpoint indexgreater2-sidedless
160.4986234771718160.9972469543436320.501376522828184
170.4293037837110530.8586075674221050.570696216288947
180.3893738381185440.7787476762370880.610626161881456
190.353607705851940.707215411703880.64639229414806
200.3334147942980330.6668295885960660.666585205701967
210.3038764605428540.6077529210857070.696123539457146
220.2817988711278020.5635977422556040.718201128872198
230.2624736349692140.5249472699384280.737526365030786
240.2255600896372070.4511201792744130.774439910362793
250.23896600903840.47793201807680.7610339909616
260.267194702290050.53438940458010.73280529770995
270.3032048361989050.6064096723978110.696795163801095
280.3304550673333630.6609101346667260.669544932666637
290.3501615181481520.7003230362963030.649838481851848
300.372382414377590.744764828755180.62761758562241
310.3814854640474360.7629709280948720.618514535952564
320.3894998536565410.7789997073130830.610500146343459
330.3736206075151390.7472412150302780.626379392484861
340.3413669913243810.6827339826487610.65863300867562
350.3036872707639740.6073745415279490.696312729236026
360.2644786467406430.5289572934812850.735521353259357
370.279648321268070.559296642536140.72035167873193
380.2701471029779110.5402942059558220.729852897022089
390.2520875972127050.5041751944254090.747912402787295
400.2226699668260220.4453399336520440.777330033173978
410.1649662001361400.3299324002722810.83503379986386
420.1123340432955460.2246680865910920.887665956704454
430.07219927029989720.1443985405997940.927800729700103
440.04598191434695970.09196382869391940.95401808565304
450.03033970714280980.06067941428561970.96966029285719

\begin{tabular}{lllllllll}
\hline
Goldfeld-Quandt test for Heteroskedasticity \tabularnewline
p-values & Alternative Hypothesis \tabularnewline
breakpoint index & greater & 2-sided & less \tabularnewline
16 & 0.498623477171816 & 0.997246954343632 & 0.501376522828184 \tabularnewline
17 & 0.429303783711053 & 0.858607567422105 & 0.570696216288947 \tabularnewline
18 & 0.389373838118544 & 0.778747676237088 & 0.610626161881456 \tabularnewline
19 & 0.35360770585194 & 0.70721541170388 & 0.64639229414806 \tabularnewline
20 & 0.333414794298033 & 0.666829588596066 & 0.666585205701967 \tabularnewline
21 & 0.303876460542854 & 0.607752921085707 & 0.696123539457146 \tabularnewline
22 & 0.281798871127802 & 0.563597742255604 & 0.718201128872198 \tabularnewline
23 & 0.262473634969214 & 0.524947269938428 & 0.737526365030786 \tabularnewline
24 & 0.225560089637207 & 0.451120179274413 & 0.774439910362793 \tabularnewline
25 & 0.2389660090384 & 0.4779320180768 & 0.7610339909616 \tabularnewline
26 & 0.26719470229005 & 0.5343894045801 & 0.73280529770995 \tabularnewline
27 & 0.303204836198905 & 0.606409672397811 & 0.696795163801095 \tabularnewline
28 & 0.330455067333363 & 0.660910134666726 & 0.669544932666637 \tabularnewline
29 & 0.350161518148152 & 0.700323036296303 & 0.649838481851848 \tabularnewline
30 & 0.37238241437759 & 0.74476482875518 & 0.62761758562241 \tabularnewline
31 & 0.381485464047436 & 0.762970928094872 & 0.618514535952564 \tabularnewline
32 & 0.389499853656541 & 0.778999707313083 & 0.610500146343459 \tabularnewline
33 & 0.373620607515139 & 0.747241215030278 & 0.626379392484861 \tabularnewline
34 & 0.341366991324381 & 0.682733982648761 & 0.65863300867562 \tabularnewline
35 & 0.303687270763974 & 0.607374541527949 & 0.696312729236026 \tabularnewline
36 & 0.264478646740643 & 0.528957293481285 & 0.735521353259357 \tabularnewline
37 & 0.27964832126807 & 0.55929664253614 & 0.72035167873193 \tabularnewline
38 & 0.270147102977911 & 0.540294205955822 & 0.729852897022089 \tabularnewline
39 & 0.252087597212705 & 0.504175194425409 & 0.747912402787295 \tabularnewline
40 & 0.222669966826022 & 0.445339933652044 & 0.777330033173978 \tabularnewline
41 & 0.164966200136140 & 0.329932400272281 & 0.83503379986386 \tabularnewline
42 & 0.112334043295546 & 0.224668086591092 & 0.887665956704454 \tabularnewline
43 & 0.0721992702998972 & 0.144398540599794 & 0.927800729700103 \tabularnewline
44 & 0.0459819143469597 & 0.0919638286939194 & 0.95401808565304 \tabularnewline
45 & 0.0303397071428098 & 0.0606794142856197 & 0.96966029285719 \tabularnewline
\hline
\end{tabular}
%Source: https://freestatistics.org/blog/index.php?pk=25942&T=5

[TABLE]
[ROW][C]Goldfeld-Quandt test for Heteroskedasticity[/C][/ROW]
[ROW][C]p-values[/C][C]Alternative Hypothesis[/C][/ROW]
[ROW][C]breakpoint index[/C][C]greater[/C][C]2-sided[/C][C]less[/C][/ROW]
[ROW][C]16[/C][C]0.498623477171816[/C][C]0.997246954343632[/C][C]0.501376522828184[/C][/ROW]
[ROW][C]17[/C][C]0.429303783711053[/C][C]0.858607567422105[/C][C]0.570696216288947[/C][/ROW]
[ROW][C]18[/C][C]0.389373838118544[/C][C]0.778747676237088[/C][C]0.610626161881456[/C][/ROW]
[ROW][C]19[/C][C]0.35360770585194[/C][C]0.70721541170388[/C][C]0.64639229414806[/C][/ROW]
[ROW][C]20[/C][C]0.333414794298033[/C][C]0.666829588596066[/C][C]0.666585205701967[/C][/ROW]
[ROW][C]21[/C][C]0.303876460542854[/C][C]0.607752921085707[/C][C]0.696123539457146[/C][/ROW]
[ROW][C]22[/C][C]0.281798871127802[/C][C]0.563597742255604[/C][C]0.718201128872198[/C][/ROW]
[ROW][C]23[/C][C]0.262473634969214[/C][C]0.524947269938428[/C][C]0.737526365030786[/C][/ROW]
[ROW][C]24[/C][C]0.225560089637207[/C][C]0.451120179274413[/C][C]0.774439910362793[/C][/ROW]
[ROW][C]25[/C][C]0.2389660090384[/C][C]0.4779320180768[/C][C]0.7610339909616[/C][/ROW]
[ROW][C]26[/C][C]0.26719470229005[/C][C]0.5343894045801[/C][C]0.73280529770995[/C][/ROW]
[ROW][C]27[/C][C]0.303204836198905[/C][C]0.606409672397811[/C][C]0.696795163801095[/C][/ROW]
[ROW][C]28[/C][C]0.330455067333363[/C][C]0.660910134666726[/C][C]0.669544932666637[/C][/ROW]
[ROW][C]29[/C][C]0.350161518148152[/C][C]0.700323036296303[/C][C]0.649838481851848[/C][/ROW]
[ROW][C]30[/C][C]0.37238241437759[/C][C]0.74476482875518[/C][C]0.62761758562241[/C][/ROW]
[ROW][C]31[/C][C]0.381485464047436[/C][C]0.762970928094872[/C][C]0.618514535952564[/C][/ROW]
[ROW][C]32[/C][C]0.389499853656541[/C][C]0.778999707313083[/C][C]0.610500146343459[/C][/ROW]
[ROW][C]33[/C][C]0.373620607515139[/C][C]0.747241215030278[/C][C]0.626379392484861[/C][/ROW]
[ROW][C]34[/C][C]0.341366991324381[/C][C]0.682733982648761[/C][C]0.65863300867562[/C][/ROW]
[ROW][C]35[/C][C]0.303687270763974[/C][C]0.607374541527949[/C][C]0.696312729236026[/C][/ROW]
[ROW][C]36[/C][C]0.264478646740643[/C][C]0.528957293481285[/C][C]0.735521353259357[/C][/ROW]
[ROW][C]37[/C][C]0.27964832126807[/C][C]0.55929664253614[/C][C]0.72035167873193[/C][/ROW]
[ROW][C]38[/C][C]0.270147102977911[/C][C]0.540294205955822[/C][C]0.729852897022089[/C][/ROW]
[ROW][C]39[/C][C]0.252087597212705[/C][C]0.504175194425409[/C][C]0.747912402787295[/C][/ROW]
[ROW][C]40[/C][C]0.222669966826022[/C][C]0.445339933652044[/C][C]0.777330033173978[/C][/ROW]
[ROW][C]41[/C][C]0.164966200136140[/C][C]0.329932400272281[/C][C]0.83503379986386[/C][/ROW]
[ROW][C]42[/C][C]0.112334043295546[/C][C]0.224668086591092[/C][C]0.887665956704454[/C][/ROW]
[ROW][C]43[/C][C]0.0721992702998972[/C][C]0.144398540599794[/C][C]0.927800729700103[/C][/ROW]
[ROW][C]44[/C][C]0.0459819143469597[/C][C]0.0919638286939194[/C][C]0.95401808565304[/C][/ROW]
[ROW][C]45[/C][C]0.0303397071428098[/C][C]0.0606794142856197[/C][C]0.96966029285719[/C][/ROW]
[/TABLE]
Source: https://freestatistics.org/blog/index.php?pk=25942&T=5

Globally Unique Identifier (entire table): ba.freestatistics.org/blog/index.php?pk=25942&T=5

As an alternative you can also use a QR Code:  

The GUIDs for individual cells are displayed in the table below:

Goldfeld-Quandt test for Heteroskedasticity
p-valuesAlternative Hypothesis
breakpoint indexgreater2-sidedless
160.4986234771718160.9972469543436320.501376522828184
170.4293037837110530.8586075674221050.570696216288947
180.3893738381185440.7787476762370880.610626161881456
190.353607705851940.707215411703880.64639229414806
200.3334147942980330.6668295885960660.666585205701967
210.3038764605428540.6077529210857070.696123539457146
220.2817988711278020.5635977422556040.718201128872198
230.2624736349692140.5249472699384280.737526365030786
240.2255600896372070.4511201792744130.774439910362793
250.23896600903840.47793201807680.7610339909616
260.267194702290050.53438940458010.73280529770995
270.3032048361989050.6064096723978110.696795163801095
280.3304550673333630.6609101346667260.669544932666637
290.3501615181481520.7003230362963030.649838481851848
300.372382414377590.744764828755180.62761758562241
310.3814854640474360.7629709280948720.618514535952564
320.3894998536565410.7789997073130830.610500146343459
330.3736206075151390.7472412150302780.626379392484861
340.3413669913243810.6827339826487610.65863300867562
350.3036872707639740.6073745415279490.696312729236026
360.2644786467406430.5289572934812850.735521353259357
370.279648321268070.559296642536140.72035167873193
380.2701471029779110.5402942059558220.729852897022089
390.2520875972127050.5041751944254090.747912402787295
400.2226699668260220.4453399336520440.777330033173978
410.1649662001361400.3299324002722810.83503379986386
420.1123340432955460.2246680865910920.887665956704454
430.07219927029989720.1443985405997940.927800729700103
440.04598191434695970.09196382869391940.95401808565304
450.03033970714280980.06067941428561970.96966029285719


Meta Analysis of Goldfeld-Quandt test for Heteroskedasticity
Description# significant tests% significant testsOK/NOK
1% type I error level00OK
5% type I error level00OK
10% type I error level20.0666666666666667OK

\begin{tabular}{lllllllll}
\hline
Meta Analysis of Goldfeld-Quandt test for Heteroskedasticity \tabularnewline
Description & # significant tests & % significant tests & OK/NOK \tabularnewline
1% type I error level & 0 & 0 & OK \tabularnewline
5% type I error level & 0 & 0 & OK \tabularnewline
10% type I error level & 2 & 0.0666666666666667 & OK \tabularnewline
\hline
\end{tabular}
%Source: https://freestatistics.org/blog/index.php?pk=25942&T=6

[TABLE]
[ROW][C]Meta Analysis of Goldfeld-Quandt test for Heteroskedasticity[/C][/ROW]
[ROW][C]Description[/C][C]# significant tests[/C][C]% significant tests[/C][C]OK/NOK[/C][/ROW]
[ROW][C]1% type I error level[/C][C]0[/C][C]0[/C][C]OK[/C][/ROW]
[ROW][C]5% type I error level[/C][C]0[/C][C]0[/C][C]OK[/C][/ROW]
[ROW][C]10% type I error level[/C][C]2[/C][C]0.0666666666666667[/C][C]OK[/C][/ROW]
[/TABLE]
Source: https://freestatistics.org/blog/index.php?pk=25942&T=6

Globally Unique Identifier (entire table): ba.freestatistics.org/blog/index.php?pk=25942&T=6

As an alternative you can also use a QR Code:  

The GUIDs for individual cells are displayed in the table below:

Meta Analysis of Goldfeld-Quandt test for Heteroskedasticity
Description# significant tests% significant testsOK/NOK
1% type I error level00OK
5% type I error level00OK
10% type I error level20.0666666666666667OK


Parameters (Session):
par1 = 1 ; par2 = Include Monthly Dummies ; par3 = No Linear Trend ;
Parameters (R input):
par1 = 1 ; par2 = Include Monthly Dummies ; par3 = No Linear Trend ;
R code (references can be found in the software module):
library(lattice)
library(lmtest)
n25 <- 25 #minimum number of obs. for Goldfeld-Quandt test
par1 <- as.numeric(par1)
x <- t(y)
k <- length(x[1,])
n <- length(x[,1])
x1 <- cbind(x[,par1], x[,1:k!=par1])
mycolnames <- c(colnames(x)[par1], colnames(x)[1:k!=par1])
colnames(x1) <- mycolnames #colnames(x)[par1]
x <- x1
if (par3 == 'First Differences'){
x2 <- array(0, dim=c(n-1,k), dimnames=list(1:(n-1), paste('(1-B)',colnames(x),sep='')))
for (i in 1:n-1) {
for (j in 1:k) {
x2[i,j] <- x[i+1,j] - x[i,j]
}
}
x <- x2
}
if (par2 == 'Include Monthly Dummies'){
x2 <- array(0, dim=c(n,11), dimnames=list(1:n, paste('M', seq(1:11), sep ='')))
for (i in 1:11){
x2[seq(i,n,12),i] <- 1
}
x <- cbind(x, x2)
}
if (par2 == 'Include Quarterly Dummies'){
x2 <- array(0, dim=c(n,3), dimnames=list(1:n, paste('Q', seq(1:3), sep ='')))
for (i in 1:3){
x2[seq(i,n,4),i] <- 1
}
x <- cbind(x, x2)
}
k <- length(x[1,])
if (par3 == 'Linear Trend'){
x <- cbind(x, c(1:n))
colnames(x)[k+1] <- 't'
}
x
k <- length(x[1,])
df <- as.data.frame(x)
(mylm <- lm(df))
(mysum <- summary(mylm))
if (n > n25) {
kp3 <- k + 3
nmkm3 <- n - k - 3
gqarr <- array(NA, dim=c(nmkm3-kp3+1,3))
numgqtests <- 0
numsignificant1 <- 0
numsignificant5 <- 0
numsignificant10 <- 0
for (mypoint in kp3:nmkm3) {
j <- 0
numgqtests <- numgqtests + 1
for (myalt in c('greater', 'two.sided', 'less')) {
j <- j + 1
gqarr[mypoint-kp3+1,j] <- gqtest(mylm, point=mypoint, alternative=myalt)$p.value
}
if (gqarr[mypoint-kp3+1,2] < 0.01) numsignificant1 <- numsignificant1 + 1
if (gqarr[mypoint-kp3+1,2] < 0.05) numsignificant5 <- numsignificant5 + 1
if (gqarr[mypoint-kp3+1,2] < 0.10) numsignificant10 <- numsignificant10 + 1
}
gqarr
}
bitmap(file='test0.png')
plot(x[,1], type='l', main='Actuals and Interpolation', ylab='value of Actuals and Interpolation (dots)', xlab='time or index')
points(x[,1]-mysum$resid)
grid()
dev.off()
bitmap(file='test1.png')
plot(mysum$resid, type='b', pch=19, main='Residuals', ylab='value of Residuals', xlab='time or index')
grid()
dev.off()
bitmap(file='test2.png')
hist(mysum$resid, main='Residual Histogram', xlab='values of Residuals')
grid()
dev.off()
bitmap(file='test3.png')
densityplot(~mysum$resid,col='black',main='Residual Density Plot', xlab='values of Residuals')
dev.off()
bitmap(file='test4.png')
qqnorm(mysum$resid, main='Residual Normal Q-Q Plot')
qqline(mysum$resid)
grid()
dev.off()
(myerror <- as.ts(mysum$resid))
bitmap(file='test5.png')
dum <- cbind(lag(myerror,k=1),myerror)
dum
dum1 <- dum[2:length(myerror),]
dum1
z <- as.data.frame(dum1)
z
plot(z,main=paste('Residual Lag plot, lowess, and regression line'), ylab='values of Residuals', xlab='lagged values of Residuals')
lines(lowess(z))
abline(lm(z))
grid()
dev.off()
bitmap(file='test6.png')
acf(mysum$resid, lag.max=length(mysum$resid)/2, main='Residual Autocorrelation Function')
grid()
dev.off()
bitmap(file='test7.png')
pacf(mysum$resid, lag.max=length(mysum$resid)/2, main='Residual Partial Autocorrelation Function')
grid()
dev.off()
bitmap(file='test8.png')
opar <- par(mfrow = c(2,2), oma = c(0, 0, 1.1, 0))
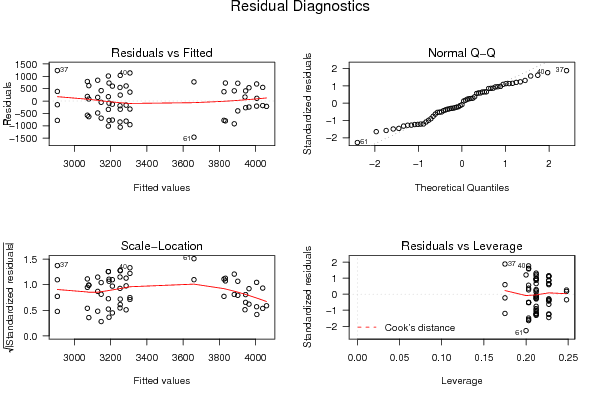
plot(mylm, las = 1, sub='Residual Diagnostics')
par(opar)
dev.off()
if (n > n25) {
bitmap(file='test9.png')
plot(kp3:nmkm3,gqarr[,2], main='Goldfeld-Quandt test',ylab='2-sided p-value',xlab='breakpoint')
grid()
dev.off()
}
load(file='createtable')
a<-table.start()
a<-table.row.start(a)
a<-table.element(a, 'Multiple Linear Regression - Estimated Regression Equation', 1, TRUE)
a<-table.row.end(a)
myeq <- colnames(x)[1]
myeq <- paste(myeq, '[t] = ', sep='')
for (i in 1:k){
if (mysum$coefficients[i,1] > 0) myeq <- paste(myeq, '+', '')
myeq <- paste(myeq, mysum$coefficients[i,1], sep=' ')
if (rownames(mysum$coefficients)[i] != '(Intercept)') {
myeq <- paste(myeq, rownames(mysum$coefficients)[i], sep='')
if (rownames(mysum$coefficients)[i] != 't') myeq <- paste(myeq, '[t]', sep='')
}
}
myeq <- paste(myeq, ' + e[t]')
a<-table.row.start(a)
a<-table.element(a, myeq)
a<-table.row.end(a)
a<-table.end(a)
table.save(a,file='mytable1.tab')
a<-table.start()
a<-table.row.start(a)
a<-table.element(a,hyperlink('ols1.htm','Multiple Linear Regression - Ordinary Least Squares',''), 6, TRUE)
a<-table.row.end(a)
a<-table.row.start(a)
a<-table.element(a,'Variable',header=TRUE)
a<-table.element(a,'Parameter',header=TRUE)
a<-table.element(a,'S.D.',header=TRUE)
a<-table.element(a,'T-STAT
H0: parameter = 0',header=TRUE)
a<-table.element(a,'2-tail p-value',header=TRUE)
a<-table.element(a,'1-tail p-value',header=TRUE)
a<-table.row.end(a)
for (i in 1:k){
a<-table.row.start(a)
a<-table.element(a,rownames(mysum$coefficients)[i],header=TRUE)
a<-table.element(a,mysum$coefficients[i,1])
a<-table.element(a, round(mysum$coefficients[i,2],6))
a<-table.element(a, round(mysum$coefficients[i,3],4))
a<-table.element(a, round(mysum$coefficients[i,4],6))
a<-table.element(a, round(mysum$coefficients[i,4]/2,6))
a<-table.row.end(a)
}
a<-table.end(a)
table.save(a,file='mytable2.tab')
a<-table.start()
a<-table.row.start(a)
a<-table.element(a, 'Multiple Linear Regression - Regression Statistics', 2, TRUE)
a<-table.row.end(a)
a<-table.row.start(a)
a<-table.element(a, 'Multiple R',1,TRUE)
a<-table.element(a, sqrt(mysum$r.squared))
a<-table.row.end(a)
a<-table.row.start(a)
a<-table.element(a, 'R-squared',1,TRUE)
a<-table.element(a, mysum$r.squared)
a<-table.row.end(a)
a<-table.row.start(a)
a<-table.element(a, 'Adjusted R-squared',1,TRUE)
a<-table.element(a, mysum$adj.r.squared)
a<-table.row.end(a)
a<-table.row.start(a)
a<-table.element(a, 'F-TEST (value)',1,TRUE)
a<-table.element(a, mysum$fstatistic[1])
a<-table.row.end(a)
a<-table.row.start(a)
a<-table.element(a, 'F-TEST (DF numerator)',1,TRUE)
a<-table.element(a, mysum$fstatistic[2])
a<-table.row.end(a)
a<-table.row.start(a)
a<-table.element(a, 'F-TEST (DF denominator)',1,TRUE)
a<-table.element(a, mysum$fstatistic[3])
a<-table.row.end(a)
a<-table.row.start(a)
a<-table.element(a, 'p-value',1,TRUE)
a<-table.element(a, 1-pf(mysum$fstatistic[1],mysum$fstatistic[2],mysum$fstatistic[3]))
a<-table.row.end(a)
a<-table.row.start(a)
a<-table.element(a, 'Multiple Linear Regression - Residual Statistics', 2, TRUE)
a<-table.row.end(a)
a<-table.row.start(a)
a<-table.element(a, 'Residual Standard Deviation',1,TRUE)
a<-table.element(a, mysum$sigma)
a<-table.row.end(a)
a<-table.row.start(a)
a<-table.element(a, 'Sum Squared Residuals',1,TRUE)
a<-table.element(a, sum(myerror*myerror))
a<-table.row.end(a)
a<-table.end(a)
table.save(a,file='mytable3.tab')
a<-table.start()
a<-table.row.start(a)
a<-table.element(a, 'Multiple Linear Regression - Actuals, Interpolation, and Residuals', 4, TRUE)
a<-table.row.end(a)
a<-table.row.start(a)
a<-table.element(a, 'Time or Index', 1, TRUE)
a<-table.element(a, 'Actuals', 1, TRUE)
a<-table.element(a, 'Interpolation
Forecast', 1, TRUE)
a<-table.element(a, 'Residuals
Prediction Error', 1, TRUE)
a<-table.row.end(a)
for (i in 1:n) {
a<-table.row.start(a)
a<-table.element(a,i, 1, TRUE)
a<-table.element(a,x[i])
a<-table.element(a,x[i]-mysum$resid[i])
a<-table.element(a,mysum$resid[i])
a<-table.row.end(a)
}
a<-table.end(a)
table.save(a,file='mytable4.tab')
if (n > n25) {
a<-table.start()
a<-table.row.start(a)
a<-table.element(a,'Goldfeld-Quandt test for Heteroskedasticity',4,TRUE)
a<-table.row.end(a)
a<-table.row.start(a)
a<-table.element(a,'p-values',header=TRUE)
a<-table.element(a,'Alternative Hypothesis',3,header=TRUE)
a<-table.row.end(a)
a<-table.row.start(a)
a<-table.element(a,'breakpoint index',header=TRUE)
a<-table.element(a,'greater',header=TRUE)
a<-table.element(a,'2-sided',header=TRUE)
a<-table.element(a,'less',header=TRUE)
a<-table.row.end(a)
for (mypoint in kp3:nmkm3) {
a<-table.row.start(a)
a<-table.element(a,mypoint,header=TRUE)
a<-table.element(a,gqarr[mypoint-kp3+1,1])
a<-table.element(a,gqarr[mypoint-kp3+1,2])
a<-table.element(a,gqarr[mypoint-kp3+1,3])
a<-table.row.end(a)
}
a<-table.end(a)
table.save(a,file='mytable5.tab')
a<-table.start()
a<-table.row.start(a)
a<-table.element(a,'Meta Analysis of Goldfeld-Quandt test for Heteroskedasticity',4,TRUE)
a<-table.row.end(a)
a<-table.row.start(a)
a<-table.element(a,'Description',header=TRUE)
a<-table.element(a,'# significant tests',header=TRUE)
a<-table.element(a,'% significant tests',header=TRUE)
a<-table.element(a,'OK/NOK',header=TRUE)
a<-table.row.end(a)
a<-table.row.start(a)
a<-table.element(a,'1% type I error level',header=TRUE)
a<-table.element(a,numsignificant1)
a<-table.element(a,numsignificant1/numgqtests)
if (numsignificant1/numgqtests < 0.01) dum <- 'OK' else dum <- 'NOK'
a<-table.element(a,dum)
a<-table.row.end(a)
a<-table.row.start(a)
a<-table.element(a,'5% type I error level',header=TRUE)
a<-table.element(a,numsignificant5)
a<-table.element(a,numsignificant5/numgqtests)
if (numsignificant5/numgqtests < 0.05) dum <- 'OK' else dum <- 'NOK'
a<-table.element(a,dum)
a<-table.row.end(a)
a<-table.row.start(a)
a<-table.element(a,'10% type I error level',header=TRUE)
a<-table.element(a,numsignificant10)
a<-table.element(a,numsignificant10/numgqtests)
if (numsignificant10/numgqtests < 0.1) dum <- 'OK' else dum <- 'NOK'
a<-table.element(a,dum)
a<-table.row.end(a)
a<-table.end(a)
table.save(a,file='mytable6.tab')
}