Free Statistics

of Irreproducible Research!

Author's title

Author*Unverified author*
R Software Modulerwasp_multipleregression.wasp
Title produced by softwareMultiple Regression
Date of computationThu, 27 Nov 2008 15:49:37 -0700
Cite this page as followsStatistical Computations at FreeStatistics.org, Office for Research Development and Education, URL https://freestatistics.org/blog/index.php?v=date/2008/Nov/27/t1227826235eaqccslfxy7qey4.htm/, Retrieved Sun, 19 May 2024 06:25:38 +0000
Statistical Computations at FreeStatistics.org, Office for Research Development and Education, URL https://freestatistics.org/blog/index.php?pk=25946, Retrieved Sun, 19 May 2024 06:25:38 +0000
QR Codes:

Original text written by user:
IsPrivate?No (this computation is public)
User-defined keywords
Estimated Impact133
Family? (F = Feedback message, R = changed R code, M = changed R Module, P = changed Parameters, D = changed Data)
F       [Multiple Regression] [] [2008-11-27 22:49:37] [707275eb4030c85d1414565d3cd5b4f2] [Current]
Feedback Forum
2008-12-01 14:30:00 [Glenn Maras] [reply
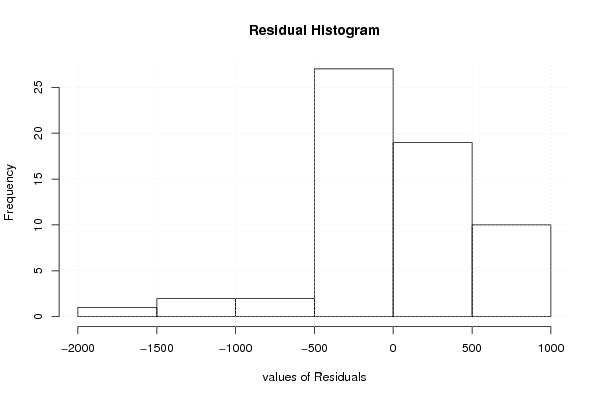
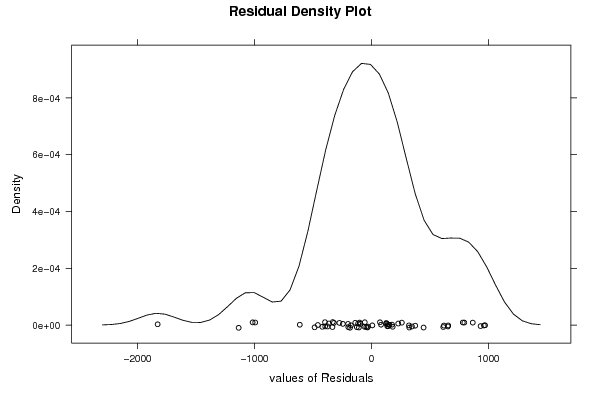
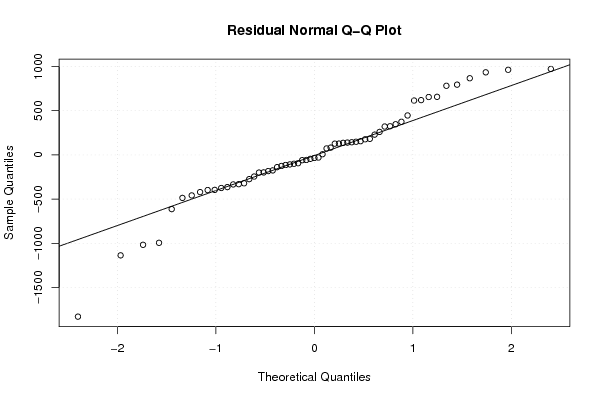
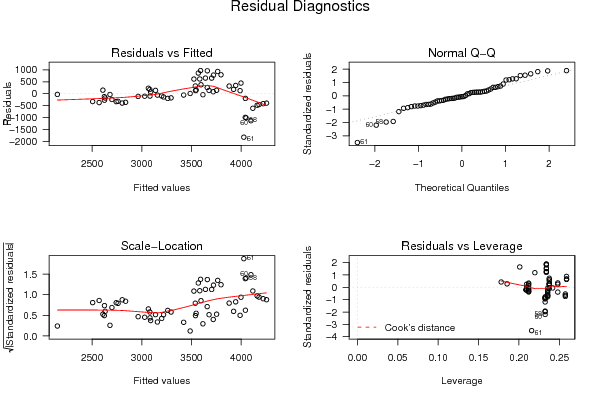
Ik vind dat de student een goed model heeft gekozen. Ook de bespreking is wel vrij goed. Alleen is er weer niets gezegd over de T-STAT. deze is van de dummievariabele kleiner dan 2. Dat wil toch zeggen dat er 5% kans is bij het verwerpen van de 0hypothese. De p-waarde bespreekt hij wel correct. Die liggen inderdaad bij verschillende maanden boven de 5% en is daarom minder betrouwbaar. Om het model helemaal te beoordelen moest de student naar de verschillende grafieken kijken. Hij heeft alleen histogram en density plot besproken. Dus de assumpties zijn ni besproken.
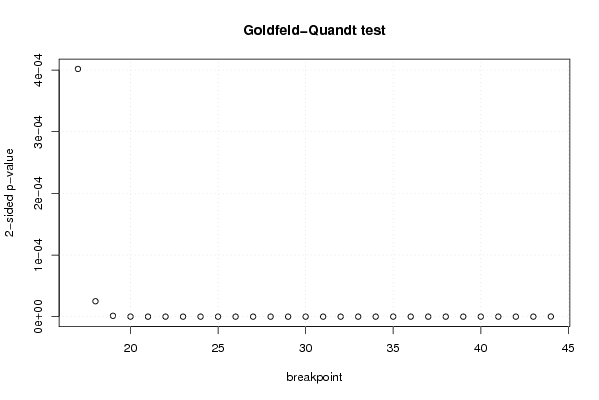
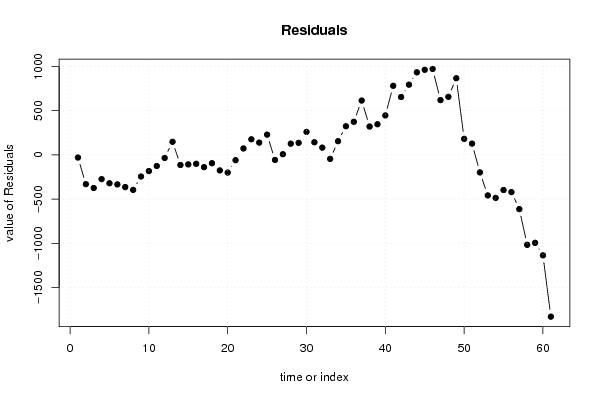
Als ik naar de output kijk kan ik zeggen dat het gemiddelde niet constant is en niet 0 dus aan deze assumptie is niet voldaan.
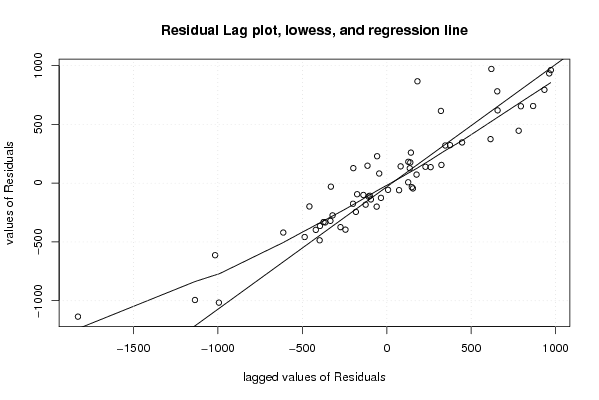
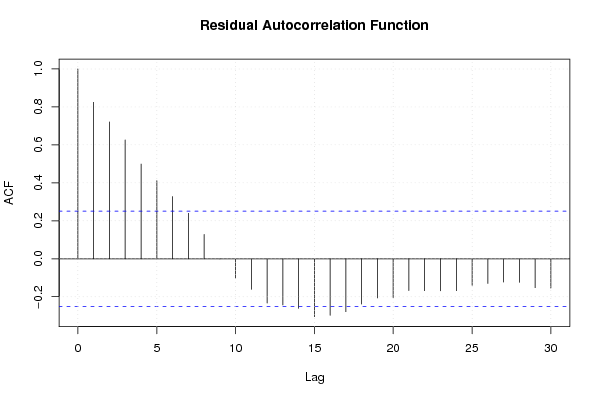
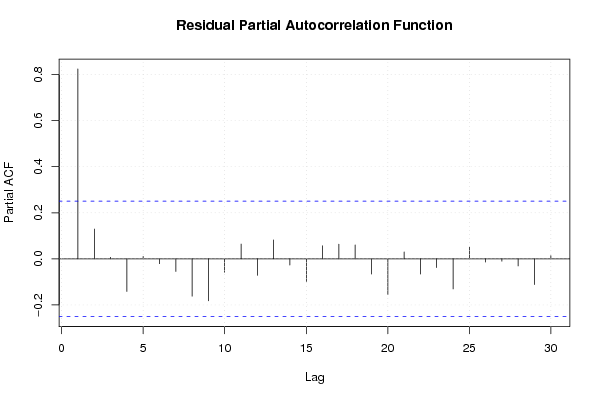
Ook is er een bepaald patroon en auutocorrelatie terug te vinden dus aan deze assumptie is ook niet voldaan. Er is dus nog werk aan dit model.

Post a new message
Dataseries X:
2120.88	0
2174.56	0
2196.72	0
2350.44	0
2440.25	0
2408.64	0
2472.81	0
2407.6	0
2454.62	0
2448.05	0
2497.84	0
2645.64	0
2756.76	0
2849.27	0
2921.44	0
2981.85	0
3080.58	0
3106.22	0
3119.31	0
3061.26	0
3097.31	0
3161.69	0
3257.16	0
3277.01	0
3295.32	0
3363.99	0
3494.17	0
3667.03	0
3813.06	0
3917.96	0
3895.51	0
3801.06	0
3570.12	0
3701.61	0
3862.27	0
3970.1	0
4138.52	0
4199.75	0
4290.89	0
4443.91	0
4502.64	1
4356.98	1
4591.27	1
4696.96	1
4621.4	1
4562.84	1
4202.52	1
4296.49	1
4435.23	1
4105.18	1
4116.68	1
3844.49	1
3720.98	1
3674.4	1
3857.62	1
3801.06	1
3504.37	1
3032.6	1
3047.03	1
2962.34	1
2197.82	1


Summary of computational transaction
Raw Inputview raw input (R code)
Raw Outputview raw output of R engine
Computing time3 seconds
R Server'Gwilym Jenkins' @ 72.249.127.135

\begin{tabular}{lllllllll}
\hline
Summary of computational transaction \tabularnewline
Raw Input & view raw input (R code)  \tabularnewline
Raw Output & view raw output of R engine  \tabularnewline
Computing time & 3 seconds \tabularnewline
R Server & 'Gwilym Jenkins' @ 72.249.127.135 \tabularnewline
\hline
\end{tabular}
%Source: https://freestatistics.org/blog/index.php?pk=25946&T=0

[TABLE]
[ROW][C]Summary of computational transaction[/C][/ROW]
[ROW][C]Raw Input[/C][C]view raw input (R code) [/C][/ROW]
[ROW][C]Raw Output[/C][C]view raw output of R engine [/C][/ROW]
[ROW][C]Computing time[/C][C]3 seconds[/C][/ROW]
[ROW][C]R Server[/C][C]'Gwilym Jenkins' @ 72.249.127.135[/C][/ROW]
[/TABLE]
Source: https://freestatistics.org/blog/index.php?pk=25946&T=0

Globally Unique Identifier (entire table): ba.freestatistics.org/blog/index.php?pk=25946&T=0

As an alternative you can also use a QR Code:  

The GUIDs for individual cells are displayed in the table below:

Summary of computational transaction
Raw Inputview raw input (R code)
Raw Outputview raw output of R engine
Computing time3 seconds
R Server'Gwilym Jenkins' @ 72.249.127.135


Multiple Linear Regression - Estimated Regression Equation
Bel20[t] = + 2222.10829411765 -413.262499999999dummy[t] -109.679513071894M1[t] + 207.112807189542M2[t] + 234.389676470587M3[t] + 249.800545751634M4[t] + 348.25791503268M5[t] + 291.442784313725M6[t] + 347.753653594771M7[t] + 275.884522875816M8[t] + 133.707392156862M9[t] + 27.3482614379082M10[t] -18.7988692810459M11[t] + 38.1531307189542t + e[t]

\begin{tabular}{lllllllll}
\hline
Multiple Linear Regression - Estimated Regression Equation \tabularnewline
Bel20[t] =  +  2222.10829411765 -413.262499999999dummy[t] -109.679513071894M1[t] +  207.112807189542M2[t] +  234.389676470587M3[t] +  249.800545751634M4[t] +  348.25791503268M5[t] +  291.442784313725M6[t] +  347.753653594771M7[t] +  275.884522875816M8[t] +  133.707392156862M9[t] +  27.3482614379082M10[t] -18.7988692810459M11[t] +  38.1531307189542t  + e[t] \tabularnewline
\hline
\end{tabular}
%Source: https://freestatistics.org/blog/index.php?pk=25946&T=1

[TABLE]
[ROW][C]Multiple Linear Regression - Estimated Regression Equation[/C][/ROW]
[ROW][C]Bel20[t] =  +  2222.10829411765 -413.262499999999dummy[t] -109.679513071894M1[t] +  207.112807189542M2[t] +  234.389676470587M3[t] +  249.800545751634M4[t] +  348.25791503268M5[t] +  291.442784313725M6[t] +  347.753653594771M7[t] +  275.884522875816M8[t] +  133.707392156862M9[t] +  27.3482614379082M10[t] -18.7988692810459M11[t] +  38.1531307189542t  + e[t][/C][/ROW]
[/TABLE]
Source: https://freestatistics.org/blog/index.php?pk=25946&T=1

Globally Unique Identifier (entire table): ba.freestatistics.org/blog/index.php?pk=25946&T=1

As an alternative you can also use a QR Code:  

The GUIDs for individual cells are displayed in the table below:

Multiple Linear Regression - Estimated Regression Equation
Bel20[t] = + 2222.10829411765 -413.262499999999dummy[t] -109.679513071894M1[t] + 207.112807189542M2[t] + 234.389676470587M3[t] + 249.800545751634M4[t] + 348.25791503268M5[t] + 291.442784313725M6[t] + 347.753653594771M7[t] + 275.884522875816M8[t] + 133.707392156862M9[t] + 27.3482614379082M10[t] -18.7988692810459M11[t] + 38.1531307189542t + e[t]


Multiple Linear Regression - Ordinary Least Squares
VariableParameterS.D.T-STATH0: parameter = 02-tail p-value1-tail p-value
(Intercept)2222.10829411765326.719366.801300
dummy-413.262499999999284.96594-1.45020.1536390.07682
M1-109.679513071894357.314733-0.3070.7602340.380117
M2207.112807189542374.8574410.55250.5832170.291608
M3234.389676470587374.3253190.62620.5342360.267118
M4249.800545751634373.9501760.6680.5073980.253699
M5348.25791503268376.1389870.92590.3592410.17962
M6291.442784313725375.1185020.77690.441090.220545
M7347.753653594771374.2528420.92920.3575360.178768
M8275.884522875816373.5430820.73860.4638460.231923
M9133.707392156862372.9901130.35850.7215940.360797
M1027.3482614379082372.5946320.07340.94180.4709
M11-18.7988692810459372.357143-0.05050.9599490.479974
t38.15313071895427.6793774.96839e-065e-06

\begin{tabular}{lllllllll}
\hline
Multiple Linear Regression - Ordinary Least Squares \tabularnewline
Variable & Parameter & S.D. & T-STATH0: parameter = 0 & 2-tail p-value & 1-tail p-value \tabularnewline
(Intercept) & 2222.10829411765 & 326.71936 & 6.8013 & 0 & 0 \tabularnewline
dummy & -413.262499999999 & 284.96594 & -1.4502 & 0.153639 & 0.07682 \tabularnewline
M1 & -109.679513071894 & 357.314733 & -0.307 & 0.760234 & 0.380117 \tabularnewline
M2 & 207.112807189542 & 374.857441 & 0.5525 & 0.583217 & 0.291608 \tabularnewline
M3 & 234.389676470587 & 374.325319 & 0.6262 & 0.534236 & 0.267118 \tabularnewline
M4 & 249.800545751634 & 373.950176 & 0.668 & 0.507398 & 0.253699 \tabularnewline
M5 & 348.25791503268 & 376.138987 & 0.9259 & 0.359241 & 0.17962 \tabularnewline
M6 & 291.442784313725 & 375.118502 & 0.7769 & 0.44109 & 0.220545 \tabularnewline
M7 & 347.753653594771 & 374.252842 & 0.9292 & 0.357536 & 0.178768 \tabularnewline
M8 & 275.884522875816 & 373.543082 & 0.7386 & 0.463846 & 0.231923 \tabularnewline
M9 & 133.707392156862 & 372.990113 & 0.3585 & 0.721594 & 0.360797 \tabularnewline
M10 & 27.3482614379082 & 372.594632 & 0.0734 & 0.9418 & 0.4709 \tabularnewline
M11 & -18.7988692810459 & 372.357143 & -0.0505 & 0.959949 & 0.479974 \tabularnewline
t & 38.1531307189542 & 7.679377 & 4.9683 & 9e-06 & 5e-06 \tabularnewline
\hline
\end{tabular}
%Source: https://freestatistics.org/blog/index.php?pk=25946&T=2

[TABLE]
[ROW][C]Multiple Linear Regression - Ordinary Least Squares[/C][/ROW]
[ROW][C]Variable[/C][C]Parameter[/C][C]S.D.[/C][C]T-STATH0: parameter = 0[/C][C]2-tail p-value[/C][C]1-tail p-value[/C][/ROW]
[ROW][C](Intercept)[/C][C]2222.10829411765[/C][C]326.71936[/C][C]6.8013[/C][C]0[/C][C]0[/C][/ROW]
[ROW][C]dummy[/C][C]-413.262499999999[/C][C]284.96594[/C][C]-1.4502[/C][C]0.153639[/C][C]0.07682[/C][/ROW]
[ROW][C]M1[/C][C]-109.679513071894[/C][C]357.314733[/C][C]-0.307[/C][C]0.760234[/C][C]0.380117[/C][/ROW]
[ROW][C]M2[/C][C]207.112807189542[/C][C]374.857441[/C][C]0.5525[/C][C]0.583217[/C][C]0.291608[/C][/ROW]
[ROW][C]M3[/C][C]234.389676470587[/C][C]374.325319[/C][C]0.6262[/C][C]0.534236[/C][C]0.267118[/C][/ROW]
[ROW][C]M4[/C][C]249.800545751634[/C][C]373.950176[/C][C]0.668[/C][C]0.507398[/C][C]0.253699[/C][/ROW]
[ROW][C]M5[/C][C]348.25791503268[/C][C]376.138987[/C][C]0.9259[/C][C]0.359241[/C][C]0.17962[/C][/ROW]
[ROW][C]M6[/C][C]291.442784313725[/C][C]375.118502[/C][C]0.7769[/C][C]0.44109[/C][C]0.220545[/C][/ROW]
[ROW][C]M7[/C][C]347.753653594771[/C][C]374.252842[/C][C]0.9292[/C][C]0.357536[/C][C]0.178768[/C][/ROW]
[ROW][C]M8[/C][C]275.884522875816[/C][C]373.543082[/C][C]0.7386[/C][C]0.463846[/C][C]0.231923[/C][/ROW]
[ROW][C]M9[/C][C]133.707392156862[/C][C]372.990113[/C][C]0.3585[/C][C]0.721594[/C][C]0.360797[/C][/ROW]
[ROW][C]M10[/C][C]27.3482614379082[/C][C]372.594632[/C][C]0.0734[/C][C]0.9418[/C][C]0.4709[/C][/ROW]
[ROW][C]M11[/C][C]-18.7988692810459[/C][C]372.357143[/C][C]-0.0505[/C][C]0.959949[/C][C]0.479974[/C][/ROW]
[ROW][C]t[/C][C]38.1531307189542[/C][C]7.679377[/C][C]4.9683[/C][C]9e-06[/C][C]5e-06[/C][/ROW]
[/TABLE]
Source: https://freestatistics.org/blog/index.php?pk=25946&T=2

Globally Unique Identifier (entire table): ba.freestatistics.org/blog/index.php?pk=25946&T=2

As an alternative you can also use a QR Code:  

The GUIDs for individual cells are displayed in the table below:

Multiple Linear Regression - Ordinary Least Squares
VariableParameterS.D.T-STATH0: parameter = 02-tail p-value1-tail p-value
(Intercept)2222.10829411765326.719366.801300
dummy-413.262499999999284.96594-1.45020.1536390.07682
M1-109.679513071894357.314733-0.3070.7602340.380117
M2207.112807189542374.8574410.55250.5832170.291608
M3234.389676470587374.3253190.62620.5342360.267118
M4249.800545751634373.9501760.6680.5073980.253699
M5348.25791503268376.1389870.92590.3592410.17962
M6291.442784313725375.1185020.77690.441090.220545
M7347.753653594771374.2528420.92920.3575360.178768
M8275.884522875816373.5430820.73860.4638460.231923
M9133.707392156862372.9901130.35850.7215940.360797
M1027.3482614379082372.5946320.07340.94180.4709
M11-18.7988692810459372.357143-0.05050.9599490.479974
t38.15313071895427.6793774.96839e-065e-06


Multiple Linear Regression - Regression Statistics
Multiple R0.713761263345358
R-squared0.509455141052361
Adjusted R-squared0.373772520492376
F-TEST (value)3.75475605460562
F-TEST (DF numerator)13
F-TEST (DF denominator)47
p-value0.00040428743221943
Multiple Linear Regression - Residual Statistics
Residual Standard Deviation588.623115317028
Sum Squared Residuals16284427.0786196

\begin{tabular}{lllllllll}
\hline
Multiple Linear Regression - Regression Statistics \tabularnewline
Multiple R & 0.713761263345358 \tabularnewline
R-squared & 0.509455141052361 \tabularnewline
Adjusted R-squared & 0.373772520492376 \tabularnewline
F-TEST (value) & 3.75475605460562 \tabularnewline
F-TEST (DF numerator) & 13 \tabularnewline
F-TEST (DF denominator) & 47 \tabularnewline
p-value & 0.00040428743221943 \tabularnewline
Multiple Linear Regression - Residual Statistics \tabularnewline
Residual Standard Deviation & 588.623115317028 \tabularnewline
Sum Squared Residuals & 16284427.0786196 \tabularnewline
\hline
\end{tabular}
%Source: https://freestatistics.org/blog/index.php?pk=25946&T=3

[TABLE]
[ROW][C]Multiple Linear Regression - Regression Statistics[/C][/ROW]
[ROW][C]Multiple R[/C][C]0.713761263345358[/C][/ROW]
[ROW][C]R-squared[/C][C]0.509455141052361[/C][/ROW]
[ROW][C]Adjusted R-squared[/C][C]0.373772520492376[/C][/ROW]
[ROW][C]F-TEST (value)[/C][C]3.75475605460562[/C][/ROW]
[ROW][C]F-TEST (DF numerator)[/C][C]13[/C][/ROW]
[ROW][C]F-TEST (DF denominator)[/C][C]47[/C][/ROW]
[ROW][C]p-value[/C][C]0.00040428743221943[/C][/ROW]
[ROW][C]Multiple Linear Regression - Residual Statistics[/C][/ROW]
[ROW][C]Residual Standard Deviation[/C][C]588.623115317028[/C][/ROW]
[ROW][C]Sum Squared Residuals[/C][C]16284427.0786196[/C][/ROW]
[/TABLE]
Source: https://freestatistics.org/blog/index.php?pk=25946&T=3

Globally Unique Identifier (entire table): ba.freestatistics.org/blog/index.php?pk=25946&T=3

As an alternative you can also use a QR Code:  

The GUIDs for individual cells are displayed in the table below:

Multiple Linear Regression - Regression Statistics
Multiple R0.713761263345358
R-squared0.509455141052361
Adjusted R-squared0.373772520492376
F-TEST (value)3.75475605460562
F-TEST (DF numerator)13
F-TEST (DF denominator)47
p-value0.00040428743221943
Multiple Linear Regression - Residual Statistics
Residual Standard Deviation588.623115317028
Sum Squared Residuals16284427.0786196


Multiple Linear Regression - Actuals, Interpolation, and Residuals
Time or IndexActualsInterpolationForecastResidualsPrediction Error
12120.882150.5819117647-29.7019117647
22174.562505.5273627451-330.967362745099
32196.722570.9573627451-374.2373627451
42350.442624.5213627451-274.081362745098
52440.252761.13186274510-320.881862745098
62408.642742.4698627451-333.829862745099
72472.812836.9338627451-364.123862745099
82407.62803.2178627451-395.617862745099
92454.622699.1938627451-244.573862745099
102448.052630.9878627451-182.937862745098
112497.842622.9938627451-125.153862745098
122645.642679.9458627451-34.3058627450989
132756.762608.41948039216148.340519607842
142849.272963.36493137255-114.094931372548
152921.443028.79493137255-107.354931372549
162981.853082.35893137255-100.508931372549
173080.583218.96943137255-138.389431372549
183106.223200.30743137255-94.087431372549
193119.313294.77143137255-175.461431372549
203061.263261.05543137255-199.795431372549
213097.313157.03143137255-59.7214313725491
223161.693088.8254313725572.8645686274508
233257.163080.83143137255176.328568627450
243277.013137.78343137255139.226568627451
253295.323066.25704901961229.062950980391
263363.993421.2025-57.2125000000004
273494.173486.63257.53750000000039
283667.033540.1965126.833500000000
293813.063676.807136.253
303917.963658.145259.815000000000
313895.513752.609142.901000000000
323801.063718.89382.1670000000003
333570.123614.869-44.7489999999997
343701.613546.663154.947000000000
353862.273538.669323.601
363970.13595.621374.479
374138.523524.09461764706614.425382352941
384199.753879.04006862745320.709931372549
394290.893944.47006862745346.41993137255
404443.913998.03406862745445.875931372550
414502.643721.38206862745781.25793137255
424356.983702.72006862745654.259931372549
434591.273797.18406862745794.08593137255
444696.963763.46806862745933.49193137255
454621.43659.44406862745961.95593137255
464562.843591.23806862745971.601931372549
474202.523583.24406862745619.275931372549
484296.493640.19606862745656.293931372549
494435.233568.66968627451866.560313725489
504105.183923.6151372549181.564862745098
514116.683989.0451372549127.634862745099
523844.494042.6091372549-198.119137254902
533720.984179.2196372549-458.239637254902
543674.44160.5576372549-486.157637254901
553857.624255.0216372549-397.401637254902
563801.064221.3056372549-420.245637254902
573504.374117.2816372549-612.911637254902
583032.64049.0756372549-1016.47563725490
593047.034041.0816372549-994.051637254901
602962.344098.0336372549-1135.69363725490
612197.824026.50725490196-1828.68725490196

\begin{tabular}{lllllllll}
\hline
Multiple Linear Regression - Actuals, Interpolation, and Residuals \tabularnewline
Time or Index & Actuals & InterpolationForecast & ResidualsPrediction Error \tabularnewline
1 & 2120.88 & 2150.5819117647 & -29.7019117647 \tabularnewline
2 & 2174.56 & 2505.5273627451 & -330.967362745099 \tabularnewline
3 & 2196.72 & 2570.9573627451 & -374.2373627451 \tabularnewline
4 & 2350.44 & 2624.5213627451 & -274.081362745098 \tabularnewline
5 & 2440.25 & 2761.13186274510 & -320.881862745098 \tabularnewline
6 & 2408.64 & 2742.4698627451 & -333.829862745099 \tabularnewline
7 & 2472.81 & 2836.9338627451 & -364.123862745099 \tabularnewline
8 & 2407.6 & 2803.2178627451 & -395.617862745099 \tabularnewline
9 & 2454.62 & 2699.1938627451 & -244.573862745099 \tabularnewline
10 & 2448.05 & 2630.9878627451 & -182.937862745098 \tabularnewline
11 & 2497.84 & 2622.9938627451 & -125.153862745098 \tabularnewline
12 & 2645.64 & 2679.9458627451 & -34.3058627450989 \tabularnewline
13 & 2756.76 & 2608.41948039216 & 148.340519607842 \tabularnewline
14 & 2849.27 & 2963.36493137255 & -114.094931372548 \tabularnewline
15 & 2921.44 & 3028.79493137255 & -107.354931372549 \tabularnewline
16 & 2981.85 & 3082.35893137255 & -100.508931372549 \tabularnewline
17 & 3080.58 & 3218.96943137255 & -138.389431372549 \tabularnewline
18 & 3106.22 & 3200.30743137255 & -94.087431372549 \tabularnewline
19 & 3119.31 & 3294.77143137255 & -175.461431372549 \tabularnewline
20 & 3061.26 & 3261.05543137255 & -199.795431372549 \tabularnewline
21 & 3097.31 & 3157.03143137255 & -59.7214313725491 \tabularnewline
22 & 3161.69 & 3088.82543137255 & 72.8645686274508 \tabularnewline
23 & 3257.16 & 3080.83143137255 & 176.328568627450 \tabularnewline
24 & 3277.01 & 3137.78343137255 & 139.226568627451 \tabularnewline
25 & 3295.32 & 3066.25704901961 & 229.062950980391 \tabularnewline
26 & 3363.99 & 3421.2025 & -57.2125000000004 \tabularnewline
27 & 3494.17 & 3486.6325 & 7.53750000000039 \tabularnewline
28 & 3667.03 & 3540.1965 & 126.833500000000 \tabularnewline
29 & 3813.06 & 3676.807 & 136.253 \tabularnewline
30 & 3917.96 & 3658.145 & 259.815000000000 \tabularnewline
31 & 3895.51 & 3752.609 & 142.901000000000 \tabularnewline
32 & 3801.06 & 3718.893 & 82.1670000000003 \tabularnewline
33 & 3570.12 & 3614.869 & -44.7489999999997 \tabularnewline
34 & 3701.61 & 3546.663 & 154.947000000000 \tabularnewline
35 & 3862.27 & 3538.669 & 323.601 \tabularnewline
36 & 3970.1 & 3595.621 & 374.479 \tabularnewline
37 & 4138.52 & 3524.09461764706 & 614.425382352941 \tabularnewline
38 & 4199.75 & 3879.04006862745 & 320.709931372549 \tabularnewline
39 & 4290.89 & 3944.47006862745 & 346.41993137255 \tabularnewline
40 & 4443.91 & 3998.03406862745 & 445.875931372550 \tabularnewline
41 & 4502.64 & 3721.38206862745 & 781.25793137255 \tabularnewline
42 & 4356.98 & 3702.72006862745 & 654.259931372549 \tabularnewline
43 & 4591.27 & 3797.18406862745 & 794.08593137255 \tabularnewline
44 & 4696.96 & 3763.46806862745 & 933.49193137255 \tabularnewline
45 & 4621.4 & 3659.44406862745 & 961.95593137255 \tabularnewline
46 & 4562.84 & 3591.23806862745 & 971.601931372549 \tabularnewline
47 & 4202.52 & 3583.24406862745 & 619.275931372549 \tabularnewline
48 & 4296.49 & 3640.19606862745 & 656.293931372549 \tabularnewline
49 & 4435.23 & 3568.66968627451 & 866.560313725489 \tabularnewline
50 & 4105.18 & 3923.6151372549 & 181.564862745098 \tabularnewline
51 & 4116.68 & 3989.0451372549 & 127.634862745099 \tabularnewline
52 & 3844.49 & 4042.6091372549 & -198.119137254902 \tabularnewline
53 & 3720.98 & 4179.2196372549 & -458.239637254902 \tabularnewline
54 & 3674.4 & 4160.5576372549 & -486.157637254901 \tabularnewline
55 & 3857.62 & 4255.0216372549 & -397.401637254902 \tabularnewline
56 & 3801.06 & 4221.3056372549 & -420.245637254902 \tabularnewline
57 & 3504.37 & 4117.2816372549 & -612.911637254902 \tabularnewline
58 & 3032.6 & 4049.0756372549 & -1016.47563725490 \tabularnewline
59 & 3047.03 & 4041.0816372549 & -994.051637254901 \tabularnewline
60 & 2962.34 & 4098.0336372549 & -1135.69363725490 \tabularnewline
61 & 2197.82 & 4026.50725490196 & -1828.68725490196 \tabularnewline
\hline
\end{tabular}
%Source: https://freestatistics.org/blog/index.php?pk=25946&T=4

[TABLE]
[ROW][C]Multiple Linear Regression - Actuals, Interpolation, and Residuals[/C][/ROW]
[ROW][C]Time or Index[/C][C]Actuals[/C][C]InterpolationForecast[/C][C]ResidualsPrediction Error[/C][/ROW]
[ROW][C]1[/C][C]2120.88[/C][C]2150.5819117647[/C][C]-29.7019117647[/C][/ROW]
[ROW][C]2[/C][C]2174.56[/C][C]2505.5273627451[/C][C]-330.967362745099[/C][/ROW]
[ROW][C]3[/C][C]2196.72[/C][C]2570.9573627451[/C][C]-374.2373627451[/C][/ROW]
[ROW][C]4[/C][C]2350.44[/C][C]2624.5213627451[/C][C]-274.081362745098[/C][/ROW]
[ROW][C]5[/C][C]2440.25[/C][C]2761.13186274510[/C][C]-320.881862745098[/C][/ROW]
[ROW][C]6[/C][C]2408.64[/C][C]2742.4698627451[/C][C]-333.829862745099[/C][/ROW]
[ROW][C]7[/C][C]2472.81[/C][C]2836.9338627451[/C][C]-364.123862745099[/C][/ROW]
[ROW][C]8[/C][C]2407.6[/C][C]2803.2178627451[/C][C]-395.617862745099[/C][/ROW]
[ROW][C]9[/C][C]2454.62[/C][C]2699.1938627451[/C][C]-244.573862745099[/C][/ROW]
[ROW][C]10[/C][C]2448.05[/C][C]2630.9878627451[/C][C]-182.937862745098[/C][/ROW]
[ROW][C]11[/C][C]2497.84[/C][C]2622.9938627451[/C][C]-125.153862745098[/C][/ROW]
[ROW][C]12[/C][C]2645.64[/C][C]2679.9458627451[/C][C]-34.3058627450989[/C][/ROW]
[ROW][C]13[/C][C]2756.76[/C][C]2608.41948039216[/C][C]148.340519607842[/C][/ROW]
[ROW][C]14[/C][C]2849.27[/C][C]2963.36493137255[/C][C]-114.094931372548[/C][/ROW]
[ROW][C]15[/C][C]2921.44[/C][C]3028.79493137255[/C][C]-107.354931372549[/C][/ROW]
[ROW][C]16[/C][C]2981.85[/C][C]3082.35893137255[/C][C]-100.508931372549[/C][/ROW]
[ROW][C]17[/C][C]3080.58[/C][C]3218.96943137255[/C][C]-138.389431372549[/C][/ROW]
[ROW][C]18[/C][C]3106.22[/C][C]3200.30743137255[/C][C]-94.087431372549[/C][/ROW]
[ROW][C]19[/C][C]3119.31[/C][C]3294.77143137255[/C][C]-175.461431372549[/C][/ROW]
[ROW][C]20[/C][C]3061.26[/C][C]3261.05543137255[/C][C]-199.795431372549[/C][/ROW]
[ROW][C]21[/C][C]3097.31[/C][C]3157.03143137255[/C][C]-59.7214313725491[/C][/ROW]
[ROW][C]22[/C][C]3161.69[/C][C]3088.82543137255[/C][C]72.8645686274508[/C][/ROW]
[ROW][C]23[/C][C]3257.16[/C][C]3080.83143137255[/C][C]176.328568627450[/C][/ROW]
[ROW][C]24[/C][C]3277.01[/C][C]3137.78343137255[/C][C]139.226568627451[/C][/ROW]
[ROW][C]25[/C][C]3295.32[/C][C]3066.25704901961[/C][C]229.062950980391[/C][/ROW]
[ROW][C]26[/C][C]3363.99[/C][C]3421.2025[/C][C]-57.2125000000004[/C][/ROW]
[ROW][C]27[/C][C]3494.17[/C][C]3486.6325[/C][C]7.53750000000039[/C][/ROW]
[ROW][C]28[/C][C]3667.03[/C][C]3540.1965[/C][C]126.833500000000[/C][/ROW]
[ROW][C]29[/C][C]3813.06[/C][C]3676.807[/C][C]136.253[/C][/ROW]
[ROW][C]30[/C][C]3917.96[/C][C]3658.145[/C][C]259.815000000000[/C][/ROW]
[ROW][C]31[/C][C]3895.51[/C][C]3752.609[/C][C]142.901000000000[/C][/ROW]
[ROW][C]32[/C][C]3801.06[/C][C]3718.893[/C][C]82.1670000000003[/C][/ROW]
[ROW][C]33[/C][C]3570.12[/C][C]3614.869[/C][C]-44.7489999999997[/C][/ROW]
[ROW][C]34[/C][C]3701.61[/C][C]3546.663[/C][C]154.947000000000[/C][/ROW]
[ROW][C]35[/C][C]3862.27[/C][C]3538.669[/C][C]323.601[/C][/ROW]
[ROW][C]36[/C][C]3970.1[/C][C]3595.621[/C][C]374.479[/C][/ROW]
[ROW][C]37[/C][C]4138.52[/C][C]3524.09461764706[/C][C]614.425382352941[/C][/ROW]
[ROW][C]38[/C][C]4199.75[/C][C]3879.04006862745[/C][C]320.709931372549[/C][/ROW]
[ROW][C]39[/C][C]4290.89[/C][C]3944.47006862745[/C][C]346.41993137255[/C][/ROW]
[ROW][C]40[/C][C]4443.91[/C][C]3998.03406862745[/C][C]445.875931372550[/C][/ROW]
[ROW][C]41[/C][C]4502.64[/C][C]3721.38206862745[/C][C]781.25793137255[/C][/ROW]
[ROW][C]42[/C][C]4356.98[/C][C]3702.72006862745[/C][C]654.259931372549[/C][/ROW]
[ROW][C]43[/C][C]4591.27[/C][C]3797.18406862745[/C][C]794.08593137255[/C][/ROW]
[ROW][C]44[/C][C]4696.96[/C][C]3763.46806862745[/C][C]933.49193137255[/C][/ROW]
[ROW][C]45[/C][C]4621.4[/C][C]3659.44406862745[/C][C]961.95593137255[/C][/ROW]
[ROW][C]46[/C][C]4562.84[/C][C]3591.23806862745[/C][C]971.601931372549[/C][/ROW]
[ROW][C]47[/C][C]4202.52[/C][C]3583.24406862745[/C][C]619.275931372549[/C][/ROW]
[ROW][C]48[/C][C]4296.49[/C][C]3640.19606862745[/C][C]656.293931372549[/C][/ROW]
[ROW][C]49[/C][C]4435.23[/C][C]3568.66968627451[/C][C]866.560313725489[/C][/ROW]
[ROW][C]50[/C][C]4105.18[/C][C]3923.6151372549[/C][C]181.564862745098[/C][/ROW]
[ROW][C]51[/C][C]4116.68[/C][C]3989.0451372549[/C][C]127.634862745099[/C][/ROW]
[ROW][C]52[/C][C]3844.49[/C][C]4042.6091372549[/C][C]-198.119137254902[/C][/ROW]
[ROW][C]53[/C][C]3720.98[/C][C]4179.2196372549[/C][C]-458.239637254902[/C][/ROW]
[ROW][C]54[/C][C]3674.4[/C][C]4160.5576372549[/C][C]-486.157637254901[/C][/ROW]
[ROW][C]55[/C][C]3857.62[/C][C]4255.0216372549[/C][C]-397.401637254902[/C][/ROW]
[ROW][C]56[/C][C]3801.06[/C][C]4221.3056372549[/C][C]-420.245637254902[/C][/ROW]
[ROW][C]57[/C][C]3504.37[/C][C]4117.2816372549[/C][C]-612.911637254902[/C][/ROW]
[ROW][C]58[/C][C]3032.6[/C][C]4049.0756372549[/C][C]-1016.47563725490[/C][/ROW]
[ROW][C]59[/C][C]3047.03[/C][C]4041.0816372549[/C][C]-994.051637254901[/C][/ROW]
[ROW][C]60[/C][C]2962.34[/C][C]4098.0336372549[/C][C]-1135.69363725490[/C][/ROW]
[ROW][C]61[/C][C]2197.82[/C][C]4026.50725490196[/C][C]-1828.68725490196[/C][/ROW]
[/TABLE]
Source: https://freestatistics.org/blog/index.php?pk=25946&T=4

Globally Unique Identifier (entire table): ba.freestatistics.org/blog/index.php?pk=25946&T=4

As an alternative you can also use a QR Code:  

The GUIDs for individual cells are displayed in the table below:

Multiple Linear Regression - Actuals, Interpolation, and Residuals
Time or IndexActualsInterpolationForecastResidualsPrediction Error
12120.882150.5819117647-29.7019117647
22174.562505.5273627451-330.967362745099
32196.722570.9573627451-374.2373627451
42350.442624.5213627451-274.081362745098
52440.252761.13186274510-320.881862745098
62408.642742.4698627451-333.829862745099
72472.812836.9338627451-364.123862745099
82407.62803.2178627451-395.617862745099
92454.622699.1938627451-244.573862745099
102448.052630.9878627451-182.937862745098
112497.842622.9938627451-125.153862745098
122645.642679.9458627451-34.3058627450989
132756.762608.41948039216148.340519607842
142849.272963.36493137255-114.094931372548
152921.443028.79493137255-107.354931372549
162981.853082.35893137255-100.508931372549
173080.583218.96943137255-138.389431372549
183106.223200.30743137255-94.087431372549
193119.313294.77143137255-175.461431372549
203061.263261.05543137255-199.795431372549
213097.313157.03143137255-59.7214313725491
223161.693088.8254313725572.8645686274508
233257.163080.83143137255176.328568627450
243277.013137.78343137255139.226568627451
253295.323066.25704901961229.062950980391
263363.993421.2025-57.2125000000004
273494.173486.63257.53750000000039
283667.033540.1965126.833500000000
293813.063676.807136.253
303917.963658.145259.815000000000
313895.513752.609142.901000000000
323801.063718.89382.1670000000003
333570.123614.869-44.7489999999997
343701.613546.663154.947000000000
353862.273538.669323.601
363970.13595.621374.479
374138.523524.09461764706614.425382352941
384199.753879.04006862745320.709931372549
394290.893944.47006862745346.41993137255
404443.913998.03406862745445.875931372550
414502.643721.38206862745781.25793137255
424356.983702.72006862745654.259931372549
434591.273797.18406862745794.08593137255
444696.963763.46806862745933.49193137255
454621.43659.44406862745961.95593137255
464562.843591.23806862745971.601931372549
474202.523583.24406862745619.275931372549
484296.493640.19606862745656.293931372549
494435.233568.66968627451866.560313725489
504105.183923.6151372549181.564862745098
514116.683989.0451372549127.634862745099
523844.494042.6091372549-198.119137254902
533720.984179.2196372549-458.239637254902
543674.44160.5576372549-486.157637254901
553857.624255.0216372549-397.401637254902
563801.064221.3056372549-420.245637254902
573504.374117.2816372549-612.911637254902
583032.64049.0756372549-1016.47563725490
593047.034041.0816372549-994.051637254901
602962.344098.0336372549-1135.69363725490
612197.824026.50725490196-1828.68725490196


Goldfeld-Quandt test for Heteroskedasticity
p-valuesAlternative Hypothesis
breakpoint indexgreater2-sidedless
170.0002009215930671270.0004018431861342530.999799078406933
181.24964091009565e-052.49928182019130e-050.9999875035909
196.82685884616296e-071.36537176923259e-060.999999317314115
203.66504781981611e-087.33009563963221e-080.999999963349522
212.11995999820485e-094.23991999640970e-090.99999999788004
222.96313817036018e-105.92627634072035e-100.999999999703686
231.87888971992515e-103.75777943985029e-100.99999999981211
242.26405989341293e-114.52811978682585e-110.99999999997736
251.32827164721146e-102.65654329442293e-100.999999999867173
262.27712943167083e-104.55425886334166e-100.999999999772287
271.21469033425794e-102.42938066851589e-100.999999999878531
281.30182219032769e-102.60364438065538e-100.999999999869818
296.05418166185455e-111.21083633237091e-100.999999999939458
302.87274693227912e-105.74549386455825e-100.999999999712725
311.97401546782596e-103.94803093565192e-100.999999999802598
321.64779810115366e-103.29559620230731e-100.99999999983522
336.83303371239628e-091.36660674247926e-080.999999993166966
341.30348255494994e-082.60696510989988e-080.999999986965174
356.9820328504911e-091.39640657009822e-080.999999993017967
364.64674942699897e-099.29349885399794e-090.99999999535325
371.82181860941053e-093.64363721882106e-090.999999998178181
387.00295560742732e-101.40059112148546e-090.999999999299704
393.44159168506871e-106.88318337013743e-100.99999999965584
401.19290275015525e-102.38580550031051e-100.99999999988071
415.32708593829368e-111.06541718765874e-100.99999999994673
422.35223408872868e-104.70446817745735e-100.999999999764777
431.72993934107271e-093.45987868214542e-090.99999999827006
448.16531628363374e-081.63306325672675e-070.999999918346837

\begin{tabular}{lllllllll}
\hline
Goldfeld-Quandt test for Heteroskedasticity \tabularnewline
p-values & Alternative Hypothesis \tabularnewline
breakpoint index & greater & 2-sided & less \tabularnewline
17 & 0.000200921593067127 & 0.000401843186134253 & 0.999799078406933 \tabularnewline
18 & 1.24964091009565e-05 & 2.49928182019130e-05 & 0.9999875035909 \tabularnewline
19 & 6.82685884616296e-07 & 1.36537176923259e-06 & 0.999999317314115 \tabularnewline
20 & 3.66504781981611e-08 & 7.33009563963221e-08 & 0.999999963349522 \tabularnewline
21 & 2.11995999820485e-09 & 4.23991999640970e-09 & 0.99999999788004 \tabularnewline
22 & 2.96313817036018e-10 & 5.92627634072035e-10 & 0.999999999703686 \tabularnewline
23 & 1.87888971992515e-10 & 3.75777943985029e-10 & 0.99999999981211 \tabularnewline
24 & 2.26405989341293e-11 & 4.52811978682585e-11 & 0.99999999997736 \tabularnewline
25 & 1.32827164721146e-10 & 2.65654329442293e-10 & 0.999999999867173 \tabularnewline
26 & 2.27712943167083e-10 & 4.55425886334166e-10 & 0.999999999772287 \tabularnewline
27 & 1.21469033425794e-10 & 2.42938066851589e-10 & 0.999999999878531 \tabularnewline
28 & 1.30182219032769e-10 & 2.60364438065538e-10 & 0.999999999869818 \tabularnewline
29 & 6.05418166185455e-11 & 1.21083633237091e-10 & 0.999999999939458 \tabularnewline
30 & 2.87274693227912e-10 & 5.74549386455825e-10 & 0.999999999712725 \tabularnewline
31 & 1.97401546782596e-10 & 3.94803093565192e-10 & 0.999999999802598 \tabularnewline
32 & 1.64779810115366e-10 & 3.29559620230731e-10 & 0.99999999983522 \tabularnewline
33 & 6.83303371239628e-09 & 1.36660674247926e-08 & 0.999999993166966 \tabularnewline
34 & 1.30348255494994e-08 & 2.60696510989988e-08 & 0.999999986965174 \tabularnewline
35 & 6.9820328504911e-09 & 1.39640657009822e-08 & 0.999999993017967 \tabularnewline
36 & 4.64674942699897e-09 & 9.29349885399794e-09 & 0.99999999535325 \tabularnewline
37 & 1.82181860941053e-09 & 3.64363721882106e-09 & 0.999999998178181 \tabularnewline
38 & 7.00295560742732e-10 & 1.40059112148546e-09 & 0.999999999299704 \tabularnewline
39 & 3.44159168506871e-10 & 6.88318337013743e-10 & 0.99999999965584 \tabularnewline
40 & 1.19290275015525e-10 & 2.38580550031051e-10 & 0.99999999988071 \tabularnewline
41 & 5.32708593829368e-11 & 1.06541718765874e-10 & 0.99999999994673 \tabularnewline
42 & 2.35223408872868e-10 & 4.70446817745735e-10 & 0.999999999764777 \tabularnewline
43 & 1.72993934107271e-09 & 3.45987868214542e-09 & 0.99999999827006 \tabularnewline
44 & 8.16531628363374e-08 & 1.63306325672675e-07 & 0.999999918346837 \tabularnewline
\hline
\end{tabular}
%Source: https://freestatistics.org/blog/index.php?pk=25946&T=5

[TABLE]
[ROW][C]Goldfeld-Quandt test for Heteroskedasticity[/C][/ROW]
[ROW][C]p-values[/C][C]Alternative Hypothesis[/C][/ROW]
[ROW][C]breakpoint index[/C][C]greater[/C][C]2-sided[/C][C]less[/C][/ROW]
[ROW][C]17[/C][C]0.000200921593067127[/C][C]0.000401843186134253[/C][C]0.999799078406933[/C][/ROW]
[ROW][C]18[/C][C]1.24964091009565e-05[/C][C]2.49928182019130e-05[/C][C]0.9999875035909[/C][/ROW]
[ROW][C]19[/C][C]6.82685884616296e-07[/C][C]1.36537176923259e-06[/C][C]0.999999317314115[/C][/ROW]
[ROW][C]20[/C][C]3.66504781981611e-08[/C][C]7.33009563963221e-08[/C][C]0.999999963349522[/C][/ROW]
[ROW][C]21[/C][C]2.11995999820485e-09[/C][C]4.23991999640970e-09[/C][C]0.99999999788004[/C][/ROW]
[ROW][C]22[/C][C]2.96313817036018e-10[/C][C]5.92627634072035e-10[/C][C]0.999999999703686[/C][/ROW]
[ROW][C]23[/C][C]1.87888971992515e-10[/C][C]3.75777943985029e-10[/C][C]0.99999999981211[/C][/ROW]
[ROW][C]24[/C][C]2.26405989341293e-11[/C][C]4.52811978682585e-11[/C][C]0.99999999997736[/C][/ROW]
[ROW][C]25[/C][C]1.32827164721146e-10[/C][C]2.65654329442293e-10[/C][C]0.999999999867173[/C][/ROW]
[ROW][C]26[/C][C]2.27712943167083e-10[/C][C]4.55425886334166e-10[/C][C]0.999999999772287[/C][/ROW]
[ROW][C]27[/C][C]1.21469033425794e-10[/C][C]2.42938066851589e-10[/C][C]0.999999999878531[/C][/ROW]
[ROW][C]28[/C][C]1.30182219032769e-10[/C][C]2.60364438065538e-10[/C][C]0.999999999869818[/C][/ROW]
[ROW][C]29[/C][C]6.05418166185455e-11[/C][C]1.21083633237091e-10[/C][C]0.999999999939458[/C][/ROW]
[ROW][C]30[/C][C]2.87274693227912e-10[/C][C]5.74549386455825e-10[/C][C]0.999999999712725[/C][/ROW]
[ROW][C]31[/C][C]1.97401546782596e-10[/C][C]3.94803093565192e-10[/C][C]0.999999999802598[/C][/ROW]
[ROW][C]32[/C][C]1.64779810115366e-10[/C][C]3.29559620230731e-10[/C][C]0.99999999983522[/C][/ROW]
[ROW][C]33[/C][C]6.83303371239628e-09[/C][C]1.36660674247926e-08[/C][C]0.999999993166966[/C][/ROW]
[ROW][C]34[/C][C]1.30348255494994e-08[/C][C]2.60696510989988e-08[/C][C]0.999999986965174[/C][/ROW]
[ROW][C]35[/C][C]6.9820328504911e-09[/C][C]1.39640657009822e-08[/C][C]0.999999993017967[/C][/ROW]
[ROW][C]36[/C][C]4.64674942699897e-09[/C][C]9.29349885399794e-09[/C][C]0.99999999535325[/C][/ROW]
[ROW][C]37[/C][C]1.82181860941053e-09[/C][C]3.64363721882106e-09[/C][C]0.999999998178181[/C][/ROW]
[ROW][C]38[/C][C]7.00295560742732e-10[/C][C]1.40059112148546e-09[/C][C]0.999999999299704[/C][/ROW]
[ROW][C]39[/C][C]3.44159168506871e-10[/C][C]6.88318337013743e-10[/C][C]0.99999999965584[/C][/ROW]
[ROW][C]40[/C][C]1.19290275015525e-10[/C][C]2.38580550031051e-10[/C][C]0.99999999988071[/C][/ROW]
[ROW][C]41[/C][C]5.32708593829368e-11[/C][C]1.06541718765874e-10[/C][C]0.99999999994673[/C][/ROW]
[ROW][C]42[/C][C]2.35223408872868e-10[/C][C]4.70446817745735e-10[/C][C]0.999999999764777[/C][/ROW]
[ROW][C]43[/C][C]1.72993934107271e-09[/C][C]3.45987868214542e-09[/C][C]0.99999999827006[/C][/ROW]
[ROW][C]44[/C][C]8.16531628363374e-08[/C][C]1.63306325672675e-07[/C][C]0.999999918346837[/C][/ROW]
[/TABLE]
Source: https://freestatistics.org/blog/index.php?pk=25946&T=5

Globally Unique Identifier (entire table): ba.freestatistics.org/blog/index.php?pk=25946&T=5

As an alternative you can also use a QR Code:  

The GUIDs for individual cells are displayed in the table below:

Goldfeld-Quandt test for Heteroskedasticity
p-valuesAlternative Hypothesis
breakpoint indexgreater2-sidedless
170.0002009215930671270.0004018431861342530.999799078406933
181.24964091009565e-052.49928182019130e-050.9999875035909
196.82685884616296e-071.36537176923259e-060.999999317314115
203.66504781981611e-087.33009563963221e-080.999999963349522
212.11995999820485e-094.23991999640970e-090.99999999788004
222.96313817036018e-105.92627634072035e-100.999999999703686
231.87888971992515e-103.75777943985029e-100.99999999981211
242.26405989341293e-114.52811978682585e-110.99999999997736
251.32827164721146e-102.65654329442293e-100.999999999867173
262.27712943167083e-104.55425886334166e-100.999999999772287
271.21469033425794e-102.42938066851589e-100.999999999878531
281.30182219032769e-102.60364438065538e-100.999999999869818
296.05418166185455e-111.21083633237091e-100.999999999939458
302.87274693227912e-105.74549386455825e-100.999999999712725
311.97401546782596e-103.94803093565192e-100.999999999802598
321.64779810115366e-103.29559620230731e-100.99999999983522
336.83303371239628e-091.36660674247926e-080.999999993166966
341.30348255494994e-082.60696510989988e-080.999999986965174
356.9820328504911e-091.39640657009822e-080.999999993017967
364.64674942699897e-099.29349885399794e-090.99999999535325
371.82181860941053e-093.64363721882106e-090.999999998178181
387.00295560742732e-101.40059112148546e-090.999999999299704
393.44159168506871e-106.88318337013743e-100.99999999965584
401.19290275015525e-102.38580550031051e-100.99999999988071
415.32708593829368e-111.06541718765874e-100.99999999994673
422.35223408872868e-104.70446817745735e-100.999999999764777
431.72993934107271e-093.45987868214542e-090.99999999827006
448.16531628363374e-081.63306325672675e-070.999999918346837


Meta Analysis of Goldfeld-Quandt test for Heteroskedasticity
Description# significant tests% significant testsOK/NOK
1% type I error level281NOK
5% type I error level281NOK
10% type I error level281NOK

\begin{tabular}{lllllllll}
\hline
Meta Analysis of Goldfeld-Quandt test for Heteroskedasticity \tabularnewline
Description & # significant tests & % significant tests & OK/NOK \tabularnewline
1% type I error level & 28 & 1 & NOK \tabularnewline
5% type I error level & 28 & 1 & NOK \tabularnewline
10% type I error level & 28 & 1 & NOK \tabularnewline
\hline
\end{tabular}
%Source: https://freestatistics.org/blog/index.php?pk=25946&T=6

[TABLE]
[ROW][C]Meta Analysis of Goldfeld-Quandt test for Heteroskedasticity[/C][/ROW]
[ROW][C]Description[/C][C]# significant tests[/C][C]% significant tests[/C][C]OK/NOK[/C][/ROW]
[ROW][C]1% type I error level[/C][C]28[/C][C]1[/C][C]NOK[/C][/ROW]
[ROW][C]5% type I error level[/C][C]28[/C][C]1[/C][C]NOK[/C][/ROW]
[ROW][C]10% type I error level[/C][C]28[/C][C]1[/C][C]NOK[/C][/ROW]
[/TABLE]
Source: https://freestatistics.org/blog/index.php?pk=25946&T=6

Globally Unique Identifier (entire table): ba.freestatistics.org/blog/index.php?pk=25946&T=6

As an alternative you can also use a QR Code:  

The GUIDs for individual cells are displayed in the table below:

Meta Analysis of Goldfeld-Quandt test for Heteroskedasticity
Description# significant tests% significant testsOK/NOK
1% type I error level281NOK
5% type I error level281NOK
10% type I error level281NOK


Parameters (Session):
par1 = 1 ; par2 = Include Monthly Dummies ; par3 = Linear Trend ;
Parameters (R input):
par1 = 1 ; par2 = Include Monthly Dummies ; par3 = Linear Trend ;
R code (references can be found in the software module):
library(lattice)
library(lmtest)
n25 <- 25 #minimum number of obs. for Goldfeld-Quandt test
par1 <- as.numeric(par1)
x <- t(y)
k <- length(x[1,])
n <- length(x[,1])
x1 <- cbind(x[,par1], x[,1:k!=par1])
mycolnames <- c(colnames(x)[par1], colnames(x)[1:k!=par1])
colnames(x1) <- mycolnames #colnames(x)[par1]
x <- x1
if (par3 == 'First Differences'){
x2 <- array(0, dim=c(n-1,k), dimnames=list(1:(n-1), paste('(1-B)',colnames(x),sep='')))
for (i in 1:n-1) {
for (j in 1:k) {
x2[i,j] <- x[i+1,j] - x[i,j]
}
}
x <- x2
}
if (par2 == 'Include Monthly Dummies'){
x2 <- array(0, dim=c(n,11), dimnames=list(1:n, paste('M', seq(1:11), sep ='')))
for (i in 1:11){
x2[seq(i,n,12),i] <- 1
}
x <- cbind(x, x2)
}
if (par2 == 'Include Quarterly Dummies'){
x2 <- array(0, dim=c(n,3), dimnames=list(1:n, paste('Q', seq(1:3), sep ='')))
for (i in 1:3){
x2[seq(i,n,4),i] <- 1
}
x <- cbind(x, x2)
}
k <- length(x[1,])
if (par3 == 'Linear Trend'){
x <- cbind(x, c(1:n))
colnames(x)[k+1] <- 't'
}
x
k <- length(x[1,])
df <- as.data.frame(x)
(mylm <- lm(df))
(mysum <- summary(mylm))
if (n > n25) {
kp3 <- k + 3
nmkm3 <- n - k - 3
gqarr <- array(NA, dim=c(nmkm3-kp3+1,3))
numgqtests <- 0
numsignificant1 <- 0
numsignificant5 <- 0
numsignificant10 <- 0
for (mypoint in kp3:nmkm3) {
j <- 0
numgqtests <- numgqtests + 1
for (myalt in c('greater', 'two.sided', 'less')) {
j <- j + 1
gqarr[mypoint-kp3+1,j] <- gqtest(mylm, point=mypoint, alternative=myalt)$p.value
}
if (gqarr[mypoint-kp3+1,2] < 0.01) numsignificant1 <- numsignificant1 + 1
if (gqarr[mypoint-kp3+1,2] < 0.05) numsignificant5 <- numsignificant5 + 1
if (gqarr[mypoint-kp3+1,2] < 0.10) numsignificant10 <- numsignificant10 + 1
}
gqarr
}
bitmap(file='test0.png')
plot(x[,1], type='l', main='Actuals and Interpolation', ylab='value of Actuals and Interpolation (dots)', xlab='time or index')
points(x[,1]-mysum$resid)
grid()
dev.off()
bitmap(file='test1.png')
plot(mysum$resid, type='b', pch=19, main='Residuals', ylab='value of Residuals', xlab='time or index')
grid()
dev.off()
bitmap(file='test2.png')
hist(mysum$resid, main='Residual Histogram', xlab='values of Residuals')
grid()
dev.off()
bitmap(file='test3.png')
densityplot(~mysum$resid,col='black',main='Residual Density Plot', xlab='values of Residuals')
dev.off()
bitmap(file='test4.png')
qqnorm(mysum$resid, main='Residual Normal Q-Q Plot')
qqline(mysum$resid)
grid()
dev.off()
(myerror <- as.ts(mysum$resid))
bitmap(file='test5.png')
dum <- cbind(lag(myerror,k=1),myerror)
dum
dum1 <- dum[2:length(myerror),]
dum1
z <- as.data.frame(dum1)
z
plot(z,main=paste('Residual Lag plot, lowess, and regression line'), ylab='values of Residuals', xlab='lagged values of Residuals')
lines(lowess(z))
abline(lm(z))
grid()
dev.off()
bitmap(file='test6.png')
acf(mysum$resid, lag.max=length(mysum$resid)/2, main='Residual Autocorrelation Function')
grid()
dev.off()
bitmap(file='test7.png')
pacf(mysum$resid, lag.max=length(mysum$resid)/2, main='Residual Partial Autocorrelation Function')
grid()
dev.off()
bitmap(file='test8.png')
opar <- par(mfrow = c(2,2), oma = c(0, 0, 1.1, 0))
plot(mylm, las = 1, sub='Residual Diagnostics')
par(opar)
dev.off()
if (n > n25) {
bitmap(file='test9.png')
plot(kp3:nmkm3,gqarr[,2], main='Goldfeld-Quandt test',ylab='2-sided p-value',xlab='breakpoint')
grid()
dev.off()
}
load(file='createtable')
a<-table.start()
a<-table.row.start(a)
a<-table.element(a, 'Multiple Linear Regression - Estimated Regression Equation', 1, TRUE)
a<-table.row.end(a)
myeq <- colnames(x)[1]
myeq <- paste(myeq, '[t] = ', sep='')
for (i in 1:k){
if (mysum$coefficients[i,1] > 0) myeq <- paste(myeq, '+', '')
myeq <- paste(myeq, mysum$coefficients[i,1], sep=' ')
if (rownames(mysum$coefficients)[i] != '(Intercept)') {
myeq <- paste(myeq, rownames(mysum$coefficients)[i], sep='')
if (rownames(mysum$coefficients)[i] != 't') myeq <- paste(myeq, '[t]', sep='')
}
}
myeq <- paste(myeq, ' + e[t]')
a<-table.row.start(a)
a<-table.element(a, myeq)
a<-table.row.end(a)
a<-table.end(a)
table.save(a,file='mytable1.tab')
a<-table.start()
a<-table.row.start(a)
a<-table.element(a,hyperlink('ols1.htm','Multiple Linear Regression - Ordinary Least Squares',''), 6, TRUE)
a<-table.row.end(a)
a<-table.row.start(a)
a<-table.element(a,'Variable',header=TRUE)
a<-table.element(a,'Parameter',header=TRUE)
a<-table.element(a,'S.D.',header=TRUE)
a<-table.element(a,'T-STAT
H0: parameter = 0',header=TRUE)
a<-table.element(a,'2-tail p-value',header=TRUE)
a<-table.element(a,'1-tail p-value',header=TRUE)
a<-table.row.end(a)
for (i in 1:k){
a<-table.row.start(a)
a<-table.element(a,rownames(mysum$coefficients)[i],header=TRUE)
a<-table.element(a,mysum$coefficients[i,1])
a<-table.element(a, round(mysum$coefficients[i,2],6))
a<-table.element(a, round(mysum$coefficients[i,3],4))
a<-table.element(a, round(mysum$coefficients[i,4],6))
a<-table.element(a, round(mysum$coefficients[i,4]/2,6))
a<-table.row.end(a)
}
a<-table.end(a)
table.save(a,file='mytable2.tab')
a<-table.start()
a<-table.row.start(a)
a<-table.element(a, 'Multiple Linear Regression - Regression Statistics', 2, TRUE)
a<-table.row.end(a)
a<-table.row.start(a)
a<-table.element(a, 'Multiple R',1,TRUE)
a<-table.element(a, sqrt(mysum$r.squared))
a<-table.row.end(a)
a<-table.row.start(a)
a<-table.element(a, 'R-squared',1,TRUE)
a<-table.element(a, mysum$r.squared)
a<-table.row.end(a)
a<-table.row.start(a)
a<-table.element(a, 'Adjusted R-squared',1,TRUE)
a<-table.element(a, mysum$adj.r.squared)
a<-table.row.end(a)
a<-table.row.start(a)
a<-table.element(a, 'F-TEST (value)',1,TRUE)
a<-table.element(a, mysum$fstatistic[1])
a<-table.row.end(a)
a<-table.row.start(a)
a<-table.element(a, 'F-TEST (DF numerator)',1,TRUE)
a<-table.element(a, mysum$fstatistic[2])
a<-table.row.end(a)
a<-table.row.start(a)
a<-table.element(a, 'F-TEST (DF denominator)',1,TRUE)
a<-table.element(a, mysum$fstatistic[3])
a<-table.row.end(a)
a<-table.row.start(a)
a<-table.element(a, 'p-value',1,TRUE)
a<-table.element(a, 1-pf(mysum$fstatistic[1],mysum$fstatistic[2],mysum$fstatistic[3]))
a<-table.row.end(a)
a<-table.row.start(a)
a<-table.element(a, 'Multiple Linear Regression - Residual Statistics', 2, TRUE)
a<-table.row.end(a)
a<-table.row.start(a)
a<-table.element(a, 'Residual Standard Deviation',1,TRUE)
a<-table.element(a, mysum$sigma)
a<-table.row.end(a)
a<-table.row.start(a)
a<-table.element(a, 'Sum Squared Residuals',1,TRUE)
a<-table.element(a, sum(myerror*myerror))
a<-table.row.end(a)
a<-table.end(a)
table.save(a,file='mytable3.tab')
a<-table.start()
a<-table.row.start(a)
a<-table.element(a, 'Multiple Linear Regression - Actuals, Interpolation, and Residuals', 4, TRUE)
a<-table.row.end(a)
a<-table.row.start(a)
a<-table.element(a, 'Time or Index', 1, TRUE)
a<-table.element(a, 'Actuals', 1, TRUE)
a<-table.element(a, 'Interpolation
Forecast', 1, TRUE)
a<-table.element(a, 'Residuals
Prediction Error', 1, TRUE)
a<-table.row.end(a)
for (i in 1:n) {
a<-table.row.start(a)
a<-table.element(a,i, 1, TRUE)
a<-table.element(a,x[i])
a<-table.element(a,x[i]-mysum$resid[i])
a<-table.element(a,mysum$resid[i])
a<-table.row.end(a)
}
a<-table.end(a)
table.save(a,file='mytable4.tab')
if (n > n25) {
a<-table.start()
a<-table.row.start(a)
a<-table.element(a,'Goldfeld-Quandt test for Heteroskedasticity',4,TRUE)
a<-table.row.end(a)
a<-table.row.start(a)
a<-table.element(a,'p-values',header=TRUE)
a<-table.element(a,'Alternative Hypothesis',3,header=TRUE)
a<-table.row.end(a)
a<-table.row.start(a)
a<-table.element(a,'breakpoint index',header=TRUE)
a<-table.element(a,'greater',header=TRUE)
a<-table.element(a,'2-sided',header=TRUE)
a<-table.element(a,'less',header=TRUE)
a<-table.row.end(a)
for (mypoint in kp3:nmkm3) {
a<-table.row.start(a)
a<-table.element(a,mypoint,header=TRUE)
a<-table.element(a,gqarr[mypoint-kp3+1,1])
a<-table.element(a,gqarr[mypoint-kp3+1,2])
a<-table.element(a,gqarr[mypoint-kp3+1,3])
a<-table.row.end(a)
}
a<-table.end(a)
table.save(a,file='mytable5.tab')
a<-table.start()
a<-table.row.start(a)
a<-table.element(a,'Meta Analysis of Goldfeld-Quandt test for Heteroskedasticity',4,TRUE)
a<-table.row.end(a)
a<-table.row.start(a)
a<-table.element(a,'Description',header=TRUE)
a<-table.element(a,'# significant tests',header=TRUE)
a<-table.element(a,'% significant tests',header=TRUE)
a<-table.element(a,'OK/NOK',header=TRUE)
a<-table.row.end(a)
a<-table.row.start(a)
a<-table.element(a,'1% type I error level',header=TRUE)
a<-table.element(a,numsignificant1)
a<-table.element(a,numsignificant1/numgqtests)
if (numsignificant1/numgqtests < 0.01) dum <- 'OK' else dum <- 'NOK'
a<-table.element(a,dum)
a<-table.row.end(a)
a<-table.row.start(a)
a<-table.element(a,'5% type I error level',header=TRUE)
a<-table.element(a,numsignificant5)
a<-table.element(a,numsignificant5/numgqtests)
if (numsignificant5/numgqtests < 0.05) dum <- 'OK' else dum <- 'NOK'
a<-table.element(a,dum)
a<-table.row.end(a)
a<-table.row.start(a)
a<-table.element(a,'10% type I error level',header=TRUE)
a<-table.element(a,numsignificant10)
a<-table.element(a,numsignificant10/numgqtests)
if (numsignificant10/numgqtests < 0.1) dum <- 'OK' else dum <- 'NOK'
a<-table.element(a,dum)
a<-table.row.end(a)
a<-table.end(a)
table.save(a,file='mytable6.tab')
}