Free Statistics

of Irreproducible Research!

Author's title

Author*The author of this computation has been verified*
R Software Modulerwasp_cross.wasp
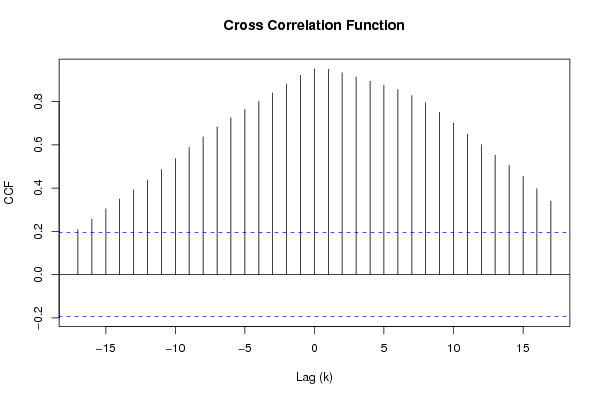
Title produced by softwareCross Correlation Function
Date of computationFri, 28 Nov 2008 06:38:36 -0700
Cite this page as followsStatistical Computations at FreeStatistics.org, Office for Research Development and Education, URL https://freestatistics.org/blog/index.php?v=date/2008/Nov/28/t1227879550fi7fyl9970ipnk1.htm/, Retrieved Sat, 18 May 2024 19:32:00 +0000
Statistical Computations at FreeStatistics.org, Office for Research Development and Education, URL https://freestatistics.org/blog/index.php?pk=26104, Retrieved Sat, 18 May 2024 19:32:00 +0000
QR Codes:

Original text written by user:
IsPrivate?No (this computation is public)
User-defined keywords
Estimated Impact161
Family? (F = Feedback message, R = changed R code, M = changed R Module, P = changed Parameters, D = changed Data)
F     [Univariate Data Series] [tijdreeks verkoop...] [2008-10-13 20:55:30] [d2d412c7f4d35ffbf5ee5ee89db327d4]
-   PD  [Univariate Data Series] [totale werkloosheid] [2008-10-19 15:02:07] [d2d412c7f4d35ffbf5ee5ee89db327d4]
- RMPD    [Cross Correlation Function] [] [2008-11-28 11:47:25] [d2d412c7f4d35ffbf5ee5ee89db327d4]
F   P         [Cross Correlation Function] [Q7] [2008-11-28 13:38:36] [6fc58909ffe15c247a4f6748c8841ab4] [Current]
Feedback Forum
2008-12-04 17:12:14 [Stijn Van de Velde] [reply
De cross correlatie functie word gebruikt om het een voorspelling te maken voor tijdreeks Y aan de hand van het verleden van tijdreeks X.

Je ziet hier dat er een heel hoge correlatie is tussen de 2 reeksen. Ze lijken simultaan op elkaar.
2008-12-08 01:01:24 [Kenny Simons] [reply
De cross correlation function kan niet vergeleken worden met de autocorrelation function. Autocorrelatie meet in welke mate een variabele kan voorspeld worden door het verleden van diezelfde variabele. De crosscorrelatie daarentegen meet in welke mate een variabele voorspeld kan worden door het verleden van een andere variabele.

In de tabel zien we:

k=0 => dit is gewoon de correlatie tussen Yt en Xt. Dit resultaat is wat je dus ook zou krijgen als je gewoon de correlatie zou berekenen.

k=-1 => de correlatie tussen Yt en Xt-1 (verleden)

K=+1 => de correlatie tussen yt en Xt+1 (toekomst)

De grafiek (grafiek zonder transformatie) zou willen zeggen dat het verleden van de variabele gecorreleerd is met het heden van de andere variabele (en omgekeerd).

Post a new message
Dataseries X:
7.4
7.2
7.1
6.9
6.8
6.8
6.8
6.9
6.7
6.6
6.5
6.4
6.3
6.3
6.3
6.5
6.6
6.5
6.4
6.5
6.7
7.1
7.1
7.2
7.2
7.3
7.3
7.3
7.3
7.4
7.6
7.6
7.6
7.7
7.8
7.9
8.1
8.1
8.1
8.2
8.2
8.2
8.2
8.2
8.2
8.3
8.3
8.4
8.4
8.4
8.3
8
8
8.2
8.6
8.7
8.7
8.5
8.4
8.4
8.4
8.5
8.5
8.5
8.5
8.5
8.4
8.4
8.4
8.5
8.6
8.6
8.6
8.6
8.5
8.4
8.4
8.3
8.2
8.1
8.2
8.1
8
7.9
7.8
7.7
7.7
7.9
7.8
7.6
7.4
7.3
7.1
7.1
7
7
7
6.9
6.8
6.7
6.6
6.6
Dataseries Y:
6.2
6.1
5.9
5.6
5.5
5.5
5.6
5.7
5.6
5.4
5.3
5.3
5.4
5.5
5.6
5.7
5.8
5.8
5.7
5.9
6.1
6.4
6.4
6.3
6.2
6.2
6.3
6.5
6.6
6.6
6.7
6.6
6.7
7
7.2
7.3
7.5
7.6
7.7
7.8
7.8
7.7
7.6
7.6
7.7
7.8
7.8
7.8
7.7
7.6
7.4
7.1
7.1
7.3
7.6
7.8
7.7
7.6
7.5
7.5
7.5
7.6
7.6
7.7
7.8
7.7
7.6
7.6
7.6
7.7
7.8
7.8
7.9
7.9
7.8
7.8
7.7
7.5
7.1
6.9
7.1
7.1
7.1
7
6.9
6.8
6.7
6.8
6.8
6.7
6.8
6.7
6.6
6.4
6.4
6.4
6.5
6.5
6.4
6.3
6.2
6.3


Summary of computational transaction
Raw Inputview raw input (R code)
Raw Outputview raw output of R engine
Computing time0 seconds
R Server'George Udny Yule' @ 72.249.76.132

\begin{tabular}{lllllllll}
\hline
Summary of computational transaction \tabularnewline
Raw Input & view raw input (R code)  \tabularnewline
Raw Output & view raw output of R engine  \tabularnewline
Computing time & 0 seconds \tabularnewline
R Server & 'George Udny Yule' @ 72.249.76.132 \tabularnewline
\hline
\end{tabular}
%Source: https://freestatistics.org/blog/index.php?pk=26104&T=0

[TABLE]
[ROW][C]Summary of computational transaction[/C][/ROW]
[ROW][C]Raw Input[/C][C]view raw input (R code) [/C][/ROW]
[ROW][C]Raw Output[/C][C]view raw output of R engine [/C][/ROW]
[ROW][C]Computing time[/C][C]0 seconds[/C][/ROW]
[ROW][C]R Server[/C][C]'George Udny Yule' @ 72.249.76.132[/C][/ROW]
[/TABLE]
Source: https://freestatistics.org/blog/index.php?pk=26104&T=0

Globally Unique Identifier (entire table): ba.freestatistics.org/blog/index.php?pk=26104&T=0

As an alternative you can also use a QR Code:  

The GUIDs for individual cells are displayed in the table below:

Summary of computational transaction
Raw Inputview raw input (R code)
Raw Outputview raw output of R engine
Computing time0 seconds
R Server'George Udny Yule' @ 72.249.76.132


Cross Correlation Function
ParameterValue
Box-Cox transformation parameter (lambda) of X series0
Degree of non-seasonal differencing (d) of X series0
Degree of seasonal differencing (D) of X series0
Seasonal Period (s)12
Box-Cox transformation parameter (lambda) of Y series0
Degree of non-seasonal differencing (d) of Y series0
Degree of seasonal differencing (D) of Y series0
krho(Y[t],X[t+k])
-170.208515164474691
-160.256092682284763
-150.304286756643164
-140.349274346455832
-130.391828305373637
-120.436992898046869
-110.485369642954471
-100.536289711157529
-90.58800957040198
-80.637173111205765
-70.683507717743525
-60.72529044490639
-50.763532221166208
-40.800605991500126
-30.839909525852516
-20.880980627189652
-10.921139378910961
00.950601027904571
10.949615646379965
20.93321739387595
30.913810605880565
40.894198889189577
50.87569591996691
60.855429454504603
70.827682390819173
80.794119632979032
90.750396583373535
100.701386767826247
110.65032130233717
120.600440399490617
130.551460330073883
140.50484175943363
150.453919023838793
160.39740184575746
170.340169735493151

\begin{tabular}{lllllllll}
\hline
Cross Correlation Function \tabularnewline
Parameter & Value \tabularnewline
Box-Cox transformation parameter (lambda) of X series & 0 \tabularnewline
Degree of non-seasonal differencing (d) of X series & 0 \tabularnewline
Degree of seasonal differencing (D) of X series & 0 \tabularnewline
Seasonal Period (s) & 12 \tabularnewline
Box-Cox transformation parameter (lambda) of Y series & 0 \tabularnewline
Degree of non-seasonal differencing (d) of Y series & 0 \tabularnewline
Degree of seasonal differencing (D) of Y series & 0 \tabularnewline
k & rho(Y[t],X[t+k]) \tabularnewline
-17 & 0.208515164474691 \tabularnewline
-16 & 0.256092682284763 \tabularnewline
-15 & 0.304286756643164 \tabularnewline
-14 & 0.349274346455832 \tabularnewline
-13 & 0.391828305373637 \tabularnewline
-12 & 0.436992898046869 \tabularnewline
-11 & 0.485369642954471 \tabularnewline
-10 & 0.536289711157529 \tabularnewline
-9 & 0.58800957040198 \tabularnewline
-8 & 0.637173111205765 \tabularnewline
-7 & 0.683507717743525 \tabularnewline
-6 & 0.72529044490639 \tabularnewline
-5 & 0.763532221166208 \tabularnewline
-4 & 0.800605991500126 \tabularnewline
-3 & 0.839909525852516 \tabularnewline
-2 & 0.880980627189652 \tabularnewline
-1 & 0.921139378910961 \tabularnewline
0 & 0.950601027904571 \tabularnewline
1 & 0.949615646379965 \tabularnewline
2 & 0.93321739387595 \tabularnewline
3 & 0.913810605880565 \tabularnewline
4 & 0.894198889189577 \tabularnewline
5 & 0.87569591996691 \tabularnewline
6 & 0.855429454504603 \tabularnewline
7 & 0.827682390819173 \tabularnewline
8 & 0.794119632979032 \tabularnewline
9 & 0.750396583373535 \tabularnewline
10 & 0.701386767826247 \tabularnewline
11 & 0.65032130233717 \tabularnewline
12 & 0.600440399490617 \tabularnewline
13 & 0.551460330073883 \tabularnewline
14 & 0.50484175943363 \tabularnewline
15 & 0.453919023838793 \tabularnewline
16 & 0.39740184575746 \tabularnewline
17 & 0.340169735493151 \tabularnewline
\hline
\end{tabular}
%Source: https://freestatistics.org/blog/index.php?pk=26104&T=1

[TABLE]
[ROW][C]Cross Correlation Function[/C][/ROW]
[ROW][C]Parameter[/C][C]Value[/C][/ROW]
[ROW][C]Box-Cox transformation parameter (lambda) of X series[/C][C]0[/C][/ROW]
[ROW][C]Degree of non-seasonal differencing (d) of X series[/C][C]0[/C][/ROW]
[ROW][C]Degree of seasonal differencing (D) of X series[/C][C]0[/C][/ROW]
[ROW][C]Seasonal Period (s)[/C][C]12[/C][/ROW]
[ROW][C]Box-Cox transformation parameter (lambda) of Y series[/C][C]0[/C][/ROW]
[ROW][C]Degree of non-seasonal differencing (d) of Y series[/C][C]0[/C][/ROW]
[ROW][C]Degree of seasonal differencing (D) of Y series[/C][C]0[/C][/ROW]
[ROW][C]k[/C][C]rho(Y[t],X[t+k])[/C][/ROW]
[ROW][C]-17[/C][C]0.208515164474691[/C][/ROW]
[ROW][C]-16[/C][C]0.256092682284763[/C][/ROW]
[ROW][C]-15[/C][C]0.304286756643164[/C][/ROW]
[ROW][C]-14[/C][C]0.349274346455832[/C][/ROW]
[ROW][C]-13[/C][C]0.391828305373637[/C][/ROW]
[ROW][C]-12[/C][C]0.436992898046869[/C][/ROW]
[ROW][C]-11[/C][C]0.485369642954471[/C][/ROW]
[ROW][C]-10[/C][C]0.536289711157529[/C][/ROW]
[ROW][C]-9[/C][C]0.58800957040198[/C][/ROW]
[ROW][C]-8[/C][C]0.637173111205765[/C][/ROW]
[ROW][C]-7[/C][C]0.683507717743525[/C][/ROW]
[ROW][C]-6[/C][C]0.72529044490639[/C][/ROW]
[ROW][C]-5[/C][C]0.763532221166208[/C][/ROW]
[ROW][C]-4[/C][C]0.800605991500126[/C][/ROW]
[ROW][C]-3[/C][C]0.839909525852516[/C][/ROW]
[ROW][C]-2[/C][C]0.880980627189652[/C][/ROW]
[ROW][C]-1[/C][C]0.921139378910961[/C][/ROW]
[ROW][C]0[/C][C]0.950601027904571[/C][/ROW]
[ROW][C]1[/C][C]0.949615646379965[/C][/ROW]
[ROW][C]2[/C][C]0.93321739387595[/C][/ROW]
[ROW][C]3[/C][C]0.913810605880565[/C][/ROW]
[ROW][C]4[/C][C]0.894198889189577[/C][/ROW]
[ROW][C]5[/C][C]0.87569591996691[/C][/ROW]
[ROW][C]6[/C][C]0.855429454504603[/C][/ROW]
[ROW][C]7[/C][C]0.827682390819173[/C][/ROW]
[ROW][C]8[/C][C]0.794119632979032[/C][/ROW]
[ROW][C]9[/C][C]0.750396583373535[/C][/ROW]
[ROW][C]10[/C][C]0.701386767826247[/C][/ROW]
[ROW][C]11[/C][C]0.65032130233717[/C][/ROW]
[ROW][C]12[/C][C]0.600440399490617[/C][/ROW]
[ROW][C]13[/C][C]0.551460330073883[/C][/ROW]
[ROW][C]14[/C][C]0.50484175943363[/C][/ROW]
[ROW][C]15[/C][C]0.453919023838793[/C][/ROW]
[ROW][C]16[/C][C]0.39740184575746[/C][/ROW]
[ROW][C]17[/C][C]0.340169735493151[/C][/ROW]
[/TABLE]
Source: https://freestatistics.org/blog/index.php?pk=26104&T=1

Globally Unique Identifier (entire table): ba.freestatistics.org/blog/index.php?pk=26104&T=1

As an alternative you can also use a QR Code:  

The GUIDs for individual cells are displayed in the table below:

Cross Correlation Function
ParameterValue
Box-Cox transformation parameter (lambda) of X series0
Degree of non-seasonal differencing (d) of X series0
Degree of seasonal differencing (D) of X series0
Seasonal Period (s)12
Box-Cox transformation parameter (lambda) of Y series0
Degree of non-seasonal differencing (d) of Y series0
Degree of seasonal differencing (D) of Y series0
krho(Y[t],X[t+k])
-170.208515164474691
-160.256092682284763
-150.304286756643164
-140.349274346455832
-130.391828305373637
-120.436992898046869
-110.485369642954471
-100.536289711157529
-90.58800957040198
-80.637173111205765
-70.683507717743525
-60.72529044490639
-50.763532221166208
-40.800605991500126
-30.839909525852516
-20.880980627189652
-10.921139378910961
00.950601027904571
10.949615646379965
20.93321739387595
30.913810605880565
40.894198889189577
50.87569591996691
60.855429454504603
70.827682390819173
80.794119632979032
90.750396583373535
100.701386767826247
110.65032130233717
120.600440399490617
130.551460330073883
140.50484175943363
150.453919023838793
160.39740184575746
170.340169735493151


Parameters (Session):
par1 = 500 ; par2 = 0.5 ;
Parameters (R input):
par1 = 0.0 ; par2 = 0 ; par3 = 0 ; par4 = 12 ; par5 = 0.0 ; par6 = 0 ; par7 = 0 ;
R code (references can be found in the software module):
par1 <- as.numeric(par1)
par2 <- as.numeric(par2)
par3 <- as.numeric(par3)
par4 <- as.numeric(par4)
par5 <- as.numeric(par5)
par6 <- as.numeric(par6)
par7 <- as.numeric(par7)
if (par1 == 0) {
x <- log(x)
} else {
x <- (x ^ par1 - 1) / par1
}
if (par5 == 0) {
y <- log(y)
} else {
y <- (y ^ par5 - 1) / par5
}
if (par2 > 0) x <- diff(x,lag=1,difference=par2)
if (par6 > 0) y <- diff(y,lag=1,difference=par6)
if (par3 > 0) x <- diff(x,lag=par4,difference=par3)
if (par7 > 0) y <- diff(y,lag=par4,difference=par7)
x
y
bitmap(file='test1.png')
(r <- ccf(x,y,main='Cross Correlation Function',ylab='CCF',xlab='Lag (k)'))
dev.off()
load(file='createtable')
a<-table.start()
a<-table.row.start(a)
a<-table.element(a,'Cross Correlation Function',2,TRUE)
a<-table.row.end(a)
a<-table.row.start(a)
a<-table.element(a,'Parameter',header=TRUE)
a<-table.element(a,'Value',header=TRUE)
a<-table.row.end(a)
a<-table.row.start(a)
a<-table.element(a,'Box-Cox transformation parameter (lambda) of X series',header=TRUE)
a<-table.element(a,par1)
a<-table.row.end(a)
a<-table.row.start(a)
a<-table.element(a,'Degree of non-seasonal differencing (d) of X series',header=TRUE)
a<-table.element(a,par2)
a<-table.row.end(a)
a<-table.row.start(a)
a<-table.element(a,'Degree of seasonal differencing (D) of X series',header=TRUE)
a<-table.element(a,par3)
a<-table.row.end(a)
a<-table.row.start(a)
a<-table.element(a,'Seasonal Period (s)',header=TRUE)
a<-table.element(a,par4)
a<-table.row.end(a)
a<-table.row.start(a)
a<-table.element(a,'Box-Cox transformation parameter (lambda) of Y series',header=TRUE)
a<-table.element(a,par5)
a<-table.row.end(a)
a<-table.row.start(a)
a<-table.element(a,'Degree of non-seasonal differencing (d) of Y series',header=TRUE)
a<-table.element(a,par6)
a<-table.row.end(a)
a<-table.row.start(a)
a<-table.element(a,'Degree of seasonal differencing (D) of Y series',header=TRUE)
a<-table.element(a,par7)
a<-table.row.end(a)
a<-table.row.start(a)
a<-table.element(a,'k',header=TRUE)
a<-table.element(a,'rho(Y[t],X[t+k])',header=TRUE)
a<-table.row.end(a)
mylength <- length(r$acf)
myhalf <- floor((mylength-1)/2)
for (i in 1:mylength) {
a<-table.row.start(a)
a<-table.element(a,i-myhalf-1,header=TRUE)
a<-table.element(a,r$acf[i])
a<-table.row.end(a)
}
a<-table.end(a)
table.save(a,file='mytable.tab')