Free Statistics

of Irreproducible Research!

Author's title

Author*The author of this computation has been verified*
R Software Modulerwasp_rwalk.wasp
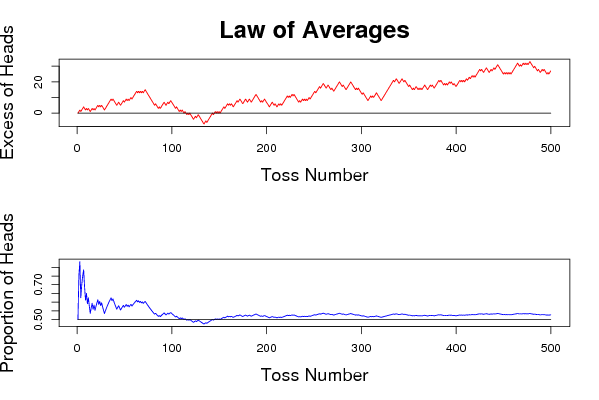
Title produced by softwareLaw of Averages
Date of computationFri, 28 Nov 2008 10:58:49 -0700
Cite this page as followsStatistical Computations at FreeStatistics.org, Office for Research Development and Education, URL https://freestatistics.org/blog/index.php?v=date/2008/Nov/28/t1227895238yj908pqpxex2145.htm/, Retrieved Sat, 18 May 2024 22:05:46 +0000
Statistical Computations at FreeStatistics.org, Office for Research Development and Education, URL https://freestatistics.org/blog/index.php?pk=26149, Retrieved Sat, 18 May 2024 22:05:46 +0000
QR Codes:

Original text written by user:
IsPrivate?No (this computation is public)
User-defined keywords
Estimated Impact147
Family? (F = Feedback message, R = changed R code, M = changed R Module, P = changed Parameters, D = changed Data)
F     [Law of Averages] [Random Walk Simul...] [2008-11-25 17:50:19] [b98453cac15ba1066b407e146608df68]
F         [Law of Averages] [17.1] [2008-11-28 17:58:49] [0458bd763b171003ec052ce63099d477] [Current]
Feedback Forum
2008-12-04 12:07:11 [Steven Vercammen] [reply
Dit is correct. Ik zou de nog wat theorie toevoegen en de link met de beurs leggen:
“The classic textbook by Freedman, Pisani and Purves called this version of the convergence of means the 'law of averages'. It was to dispel the myth that, for example, a large number of tosses of a fair coin would result in an equal number of heads and tails. It also shows that the symmetric random walk creates apparent trends much like stock market prices, even though using these trends for prediction would be folly since the expectation over the future is just the most recent value. “
Dit is wat over de random walk verteld wordt boven de calculator. We kunnen dit ook terugvinden in de grafiek. Excess of heads lijkt een stijgende trend te vertonen. Dit zou er op wijzen dat er sprake is voorspelbaarheid op basis van het verleden (=autocorrelatie). Dit is echter niet het geval: een muntstuk kan niet weten welke de uitkomst van de vorige worp was en daar naar handelen. De schijnbaar dalende trend is volledig aan het toeval te wijten. Er is dus geen sprake van een lange termijn trend. Een analoge redenering kan men toepassen om aan te tonen dat er geen seizoenaliteit is. Dit verhaal is analoog aan wat er op de beurs gebeurt. De beurskoers wordt volgens deze redenering bepaald door volgende formule Beurskoers t = beurskoers t-1 + et waarbij et een term is die bepaald wordt door het toeval, dit kan vanalles zijn bv. de winstverwachting, slecht nieuws,… de kans dat dit geval positief is, is 50% en dus even groot als de kans dat dit getal positief is.

2008-12-08 16:03:16 [Katrien Smolders] [reply
2008-12-08 17:54:22 [5faab2fc6fb120339944528a32d48a04] [reply
Het is inderdaad correct dat we uit deze reeks kunnen concluderen dat er schijnbaar een trendmatig verloop is dat schijnbaar voorspelbaar is maar er zijn geen patronen van deze reeks die ons in staat stellen er een voorspelling over te doen. Algemeen kunnen we nog zeggen dat er geen seizonaliteit is. De student heeft dit juist geanalyseerd.

Post a new message


Summary of computational transaction
Raw Inputview raw input (R code)
Raw Outputview raw output of R engine
Computing time2 seconds
R Server'Herman Ole Andreas Wold' @ 193.190.124.10:1001

\begin{tabular}{lllllllll}
\hline
Summary of computational transaction \tabularnewline
Raw Input & view raw input (R code)  \tabularnewline
Raw Output & view raw output of R engine  \tabularnewline
Computing time & 2 seconds \tabularnewline
R Server & 'Herman Ole Andreas Wold' @ 193.190.124.10:1001 \tabularnewline
\hline
\end{tabular}
%Source: https://freestatistics.org/blog/index.php?pk=26149&T=0

[TABLE]
[ROW][C]Summary of computational transaction[/C][/ROW]
[ROW][C]Raw Input[/C][C]view raw input (R code) [/C][/ROW]
[ROW][C]Raw Output[/C][C]view raw output of R engine [/C][/ROW]
[ROW][C]Computing time[/C][C]2 seconds[/C][/ROW]
[ROW][C]R Server[/C][C]'Herman Ole Andreas Wold' @ 193.190.124.10:1001[/C][/ROW]
[/TABLE]
Source: https://freestatistics.org/blog/index.php?pk=26149&T=0

Globally Unique Identifier (entire table): ba.freestatistics.org/blog/index.php?pk=26149&T=0

As an alternative you can also use a QR Code:  

The GUIDs for individual cells are displayed in the table below:

Summary of computational transaction
Raw Inputview raw input (R code)
Raw Outputview raw output of R engine
Computing time2 seconds
R Server'Herman Ole Andreas Wold' @ 193.190.124.10:1001


Parameters (Session):
par1 = 500 ; par2 = 0.5 ;
Parameters (R input):
par1 = 500 ; par2 = 0.5 ;
R code (references can be found in the software module):
n <- as.numeric(par1)
p <- as.numeric(par2)
heads=rbinom(n-1,1,p)
a=2*(heads)-1
b=diffinv(a,xi=0)
c=1:n
pheads=(diffinv(heads,xi=.5))/c
bitmap(file='test1.png')
op=par(mfrow=c(2,1))
plot(c,b,type='n',main='Law of Averages',xlab='Toss Number',ylab='Excess of Heads',lwd=2,cex.lab=1.5,cex.main=2)
lines(c,b,col='red')
lines(c,rep(0,n),col='black')
plot(c,pheads,type='n',xlab='Toss Number',ylab='Proportion of Heads',lwd=2,cex.lab=1.5)
lines(c,pheads,col='blue')
lines(c,rep(.5,n),col='black')
par(op)
dev.off()