Free Statistics

of Irreproducible Research!

Author's title

Author*The author of this computation has been verified*
R Software Modulerwasp_multipleregression.wasp
Title produced by softwareMultiple Regression
Date of computationSun, 30 Nov 2008 10:13:28 -0700
Cite this page as followsStatistical Computations at FreeStatistics.org, Office for Research Development and Education, URL https://freestatistics.org/blog/index.php?v=date/2008/Nov/30/t122806583256494evwcf2jzfl.htm/, Retrieved Sat, 18 May 2024 23:29:52 +0000
Statistical Computations at FreeStatistics.org, Office for Research Development and Education, URL https://freestatistics.org/blog/index.php?pk=26631, Retrieved Sat, 18 May 2024 23:29:52 +0000
QR Codes:

Original text written by user:
IsPrivate?No (this computation is public)
User-defined keywords
Estimated Impact188
Family? (F = Feedback message, R = changed R code, M = changed R Module, P = changed Parameters, D = changed Data)
-       [Multiple Regression] [Q3 Multiple Regre...] [2008-11-30 17:13:28] [35348cd8592af0baf5f138bd59921307] [Current]
Feedback Forum

Post a new message
Dataseries X:
512927	0
502831	0
470984	0
471067	0
476049	0
474605	0
470439	0
461251	0
454724	0
455626	0
516847	0
525192	0
522975	0
518585	0
509239	0
512238	0
519164	0
517009	0
509933	0
509127	0
500857	0
506971	0
569323	0
579714	0
577992	0
565464	0
547344	0
554788	0
562325	0
560854	0
555332	0
543599	0
536662	0
542722	0
593530	0
610763	1
612613	1
611324	1
594167	1
595454	1
590865	1
589379	1
584428	1
573100	1
567456	1
569028	1
620735	1
628884	1
628232	1
612117	1
595404	1
597141	1
593408	1
590072	1
579799	1
574205	1
572775	1
572942	1
619567	1
625809	1
619916	1


Summary of computational transaction
Raw Inputview raw input (R code)
Raw Outputview raw output of R engine
Computing time5 seconds
R Server'George Udny Yule' @ 72.249.76.132

\begin{tabular}{lllllllll}
\hline
Summary of computational transaction \tabularnewline
Raw Input & view raw input (R code)  \tabularnewline
Raw Output & view raw output of R engine  \tabularnewline
Computing time & 5 seconds \tabularnewline
R Server & 'George Udny Yule' @ 72.249.76.132 \tabularnewline
\hline
\end{tabular}
%Source: https://freestatistics.org/blog/index.php?pk=26631&T=0

[TABLE]
[ROW][C]Summary of computational transaction[/C][/ROW]
[ROW][C]Raw Input[/C][C]view raw input (R code) [/C][/ROW]
[ROW][C]Raw Output[/C][C]view raw output of R engine [/C][/ROW]
[ROW][C]Computing time[/C][C]5 seconds[/C][/ROW]
[ROW][C]R Server[/C][C]'George Udny Yule' @ 72.249.76.132[/C][/ROW]
[/TABLE]
Source: https://freestatistics.org/blog/index.php?pk=26631&T=0

Globally Unique Identifier (entire table): ba.freestatistics.org/blog/index.php?pk=26631&T=0

As an alternative you can also use a QR Code:  

The GUIDs for individual cells are displayed in the table below:

Summary of computational transaction
Raw Inputview raw input (R code)
Raw Outputview raw output of R engine
Computing time5 seconds
R Server'George Udny Yule' @ 72.249.76.132


Multiple Linear Regression - Estimated Regression Equation
X[t] = + 506330.123076923 -539.189102564112Y[t] -2785.79246794871M1[t] -7653.31826923078M2[t] -28736.190224359M3[t] -28472.4621794872M4[t] -28694.1341346154M5[t] -33118.8060897435M6[t] -41962.6780448717M7[t] -52138.75M8[t] -60346.6219551282M9[t] -59829.8939102564M10[t] -7733.5658653846M11[t] + 2446.27195512821t + e[t]

\begin{tabular}{lllllllll}
\hline
Multiple Linear Regression - Estimated Regression Equation \tabularnewline
X[t] =  +  506330.123076923 -539.189102564112Y[t] -2785.79246794871M1[t] -7653.31826923078M2[t] -28736.190224359M3[t] -28472.4621794872M4[t] -28694.1341346154M5[t] -33118.8060897435M6[t] -41962.6780448717M7[t] -52138.75M8[t] -60346.6219551282M9[t] -59829.8939102564M10[t] -7733.5658653846M11[t] +  2446.27195512821t  + e[t] \tabularnewline
\hline
\end{tabular}
%Source: https://freestatistics.org/blog/index.php?pk=26631&T=1

[TABLE]
[ROW][C]Multiple Linear Regression - Estimated Regression Equation[/C][/ROW]
[ROW][C]X[t] =  +  506330.123076923 -539.189102564112Y[t] -2785.79246794871M1[t] -7653.31826923078M2[t] -28736.190224359M3[t] -28472.4621794872M4[t] -28694.1341346154M5[t] -33118.8060897435M6[t] -41962.6780448717M7[t] -52138.75M8[t] -60346.6219551282M9[t] -59829.8939102564M10[t] -7733.5658653846M11[t] +  2446.27195512821t  + e[t][/C][/ROW]
[/TABLE]
Source: https://freestatistics.org/blog/index.php?pk=26631&T=1

Globally Unique Identifier (entire table): ba.freestatistics.org/blog/index.php?pk=26631&T=1

As an alternative you can also use a QR Code:  

The GUIDs for individual cells are displayed in the table below:

Multiple Linear Regression - Estimated Regression Equation
X[t] = + 506330.123076923 -539.189102564112Y[t] -2785.79246794871M1[t] -7653.31826923078M2[t] -28736.190224359M3[t] -28472.4621794872M4[t] -28694.1341346154M5[t] -33118.8060897435M6[t] -41962.6780448717M7[t] -52138.75M8[t] -60346.6219551282M9[t] -59829.8939102564M10[t] -7733.5658653846M11[t] + 2446.27195512821t + e[t]


Multiple Linear Regression - Ordinary Least Squares
VariableParameterS.D.T-STATH0: parameter = 02-tail p-value1-tail p-value
(Intercept)506330.1230769238252.81622561.352400
Y-539.1891025641127967.355909-0.06770.9463320.473166
M1-2785.792467948719261.991751-0.30080.7649110.382456
M2-7653.318269230789726.250482-0.78690.4353060.217653
M3-28736.1902243599708.585055-2.95990.004810.002405
M4-28472.46217948729696.130573-2.93650.0051260.002563
M5-28694.13413461549688.907132-2.96150.0047880.002394
M6-33118.80608974359686.926434-3.41890.0013080.000654
M7-41962.67804487179690.191693-4.33047.8e-053.9e-05
M8-52138.759698.697611-5.37592e-061e-06
M9-60346.62195512829712.43042-6.213300
M10-59829.89391025649731.36799-6.148100
M11-7733.56586538469755.480011-0.79270.4319120.215956
t2446.27195512821225.44289210.85100

\begin{tabular}{lllllllll}
\hline
Multiple Linear Regression - Ordinary Least Squares \tabularnewline
Variable & Parameter & S.D. & T-STATH0: parameter = 0 & 2-tail p-value & 1-tail p-value \tabularnewline
(Intercept) & 506330.123076923 & 8252.816225 & 61.3524 & 0 & 0 \tabularnewline
Y & -539.189102564112 & 7967.355909 & -0.0677 & 0.946332 & 0.473166 \tabularnewline
M1 & -2785.79246794871 & 9261.991751 & -0.3008 & 0.764911 & 0.382456 \tabularnewline
M2 & -7653.31826923078 & 9726.250482 & -0.7869 & 0.435306 & 0.217653 \tabularnewline
M3 & -28736.190224359 & 9708.585055 & -2.9599 & 0.00481 & 0.002405 \tabularnewline
M4 & -28472.4621794872 & 9696.130573 & -2.9365 & 0.005126 & 0.002563 \tabularnewline
M5 & -28694.1341346154 & 9688.907132 & -2.9615 & 0.004788 & 0.002394 \tabularnewline
M6 & -33118.8060897435 & 9686.926434 & -3.4189 & 0.001308 & 0.000654 \tabularnewline
M7 & -41962.6780448717 & 9690.191693 & -4.3304 & 7.8e-05 & 3.9e-05 \tabularnewline
M8 & -52138.75 & 9698.697611 & -5.3759 & 2e-06 & 1e-06 \tabularnewline
M9 & -60346.6219551282 & 9712.43042 & -6.2133 & 0 & 0 \tabularnewline
M10 & -59829.8939102564 & 9731.36799 & -6.1481 & 0 & 0 \tabularnewline
M11 & -7733.5658653846 & 9755.480011 & -0.7927 & 0.431912 & 0.215956 \tabularnewline
t & 2446.27195512821 & 225.442892 & 10.851 & 0 & 0 \tabularnewline
\hline
\end{tabular}
%Source: https://freestatistics.org/blog/index.php?pk=26631&T=2

[TABLE]
[ROW][C]Multiple Linear Regression - Ordinary Least Squares[/C][/ROW]
[ROW][C]Variable[/C][C]Parameter[/C][C]S.D.[/C][C]T-STATH0: parameter = 0[/C][C]2-tail p-value[/C][C]1-tail p-value[/C][/ROW]
[ROW][C](Intercept)[/C][C]506330.123076923[/C][C]8252.816225[/C][C]61.3524[/C][C]0[/C][C]0[/C][/ROW]
[ROW][C]Y[/C][C]-539.189102564112[/C][C]7967.355909[/C][C]-0.0677[/C][C]0.946332[/C][C]0.473166[/C][/ROW]
[ROW][C]M1[/C][C]-2785.79246794871[/C][C]9261.991751[/C][C]-0.3008[/C][C]0.764911[/C][C]0.382456[/C][/ROW]
[ROW][C]M2[/C][C]-7653.31826923078[/C][C]9726.250482[/C][C]-0.7869[/C][C]0.435306[/C][C]0.217653[/C][/ROW]
[ROW][C]M3[/C][C]-28736.190224359[/C][C]9708.585055[/C][C]-2.9599[/C][C]0.00481[/C][C]0.002405[/C][/ROW]
[ROW][C]M4[/C][C]-28472.4621794872[/C][C]9696.130573[/C][C]-2.9365[/C][C]0.005126[/C][C]0.002563[/C][/ROW]
[ROW][C]M5[/C][C]-28694.1341346154[/C][C]9688.907132[/C][C]-2.9615[/C][C]0.004788[/C][C]0.002394[/C][/ROW]
[ROW][C]M6[/C][C]-33118.8060897435[/C][C]9686.926434[/C][C]-3.4189[/C][C]0.001308[/C][C]0.000654[/C][/ROW]
[ROW][C]M7[/C][C]-41962.6780448717[/C][C]9690.191693[/C][C]-4.3304[/C][C]7.8e-05[/C][C]3.9e-05[/C][/ROW]
[ROW][C]M8[/C][C]-52138.75[/C][C]9698.697611[/C][C]-5.3759[/C][C]2e-06[/C][C]1e-06[/C][/ROW]
[ROW][C]M9[/C][C]-60346.6219551282[/C][C]9712.43042[/C][C]-6.2133[/C][C]0[/C][C]0[/C][/ROW]
[ROW][C]M10[/C][C]-59829.8939102564[/C][C]9731.36799[/C][C]-6.1481[/C][C]0[/C][C]0[/C][/ROW]
[ROW][C]M11[/C][C]-7733.5658653846[/C][C]9755.480011[/C][C]-0.7927[/C][C]0.431912[/C][C]0.215956[/C][/ROW]
[ROW][C]t[/C][C]2446.27195512821[/C][C]225.442892[/C][C]10.851[/C][C]0[/C][C]0[/C][/ROW]
[/TABLE]
Source: https://freestatistics.org/blog/index.php?pk=26631&T=2

Globally Unique Identifier (entire table): ba.freestatistics.org/blog/index.php?pk=26631&T=2

As an alternative you can also use a QR Code:  

The GUIDs for individual cells are displayed in the table below:

Multiple Linear Regression - Ordinary Least Squares
VariableParameterS.D.T-STATH0: parameter = 02-tail p-value1-tail p-value
(Intercept)506330.1230769238252.81622561.352400
Y-539.1891025641127967.355909-0.06770.9463320.473166
M1-2785.792467948719261.991751-0.30080.7649110.382456
M2-7653.318269230789726.250482-0.78690.4353060.217653
M3-28736.1902243599708.585055-2.95990.004810.002405
M4-28472.46217948729696.130573-2.93650.0051260.002563
M5-28694.13413461549688.907132-2.96150.0047880.002394
M6-33118.80608974359686.926434-3.41890.0013080.000654
M7-41962.67804487179690.191693-4.33047.8e-053.9e-05
M8-52138.759698.697611-5.37592e-061e-06
M9-60346.62195512829712.43042-6.213300
M10-59829.89391025649731.36799-6.148100
M11-7733.56586538469755.480011-0.79270.4319120.215956
t2446.27195512821225.44289210.85100


Multiple Linear Regression - Regression Statistics
Multiple R0.96220883818894
R-squared0.92584584828891
Adjusted R-squared0.905335125475204
F-TEST (value)45.1396012075322
F-TEST (DF numerator)13
F-TEST (DF denominator)47
p-value0
Multiple Linear Regression - Residual Statistics
Residual Standard Deviation15264.4813318957
Sum Squared Residuals10951206345.5942

\begin{tabular}{lllllllll}
\hline
Multiple Linear Regression - Regression Statistics \tabularnewline
Multiple R & 0.96220883818894 \tabularnewline
R-squared & 0.92584584828891 \tabularnewline
Adjusted R-squared & 0.905335125475204 \tabularnewline
F-TEST (value) & 45.1396012075322 \tabularnewline
F-TEST (DF numerator) & 13 \tabularnewline
F-TEST (DF denominator) & 47 \tabularnewline
p-value & 0 \tabularnewline
Multiple Linear Regression - Residual Statistics \tabularnewline
Residual Standard Deviation & 15264.4813318957 \tabularnewline
Sum Squared Residuals & 10951206345.5942 \tabularnewline
\hline
\end{tabular}
%Source: https://freestatistics.org/blog/index.php?pk=26631&T=3

[TABLE]
[ROW][C]Multiple Linear Regression - Regression Statistics[/C][/ROW]
[ROW][C]Multiple R[/C][C]0.96220883818894[/C][/ROW]
[ROW][C]R-squared[/C][C]0.92584584828891[/C][/ROW]
[ROW][C]Adjusted R-squared[/C][C]0.905335125475204[/C][/ROW]
[ROW][C]F-TEST (value)[/C][C]45.1396012075322[/C][/ROW]
[ROW][C]F-TEST (DF numerator)[/C][C]13[/C][/ROW]
[ROW][C]F-TEST (DF denominator)[/C][C]47[/C][/ROW]
[ROW][C]p-value[/C][C]0[/C][/ROW]
[ROW][C]Multiple Linear Regression - Residual Statistics[/C][/ROW]
[ROW][C]Residual Standard Deviation[/C][C]15264.4813318957[/C][/ROW]
[ROW][C]Sum Squared Residuals[/C][C]10951206345.5942[/C][/ROW]
[/TABLE]
Source: https://freestatistics.org/blog/index.php?pk=26631&T=3

Globally Unique Identifier (entire table): ba.freestatistics.org/blog/index.php?pk=26631&T=3

As an alternative you can also use a QR Code:  

The GUIDs for individual cells are displayed in the table below:

Multiple Linear Regression - Regression Statistics
Multiple R0.96220883818894
R-squared0.92584584828891
Adjusted R-squared0.905335125475204
F-TEST (value)45.1396012075322
F-TEST (DF numerator)13
F-TEST (DF denominator)47
p-value0
Multiple Linear Regression - Residual Statistics
Residual Standard Deviation15264.4813318957
Sum Squared Residuals10951206345.5942


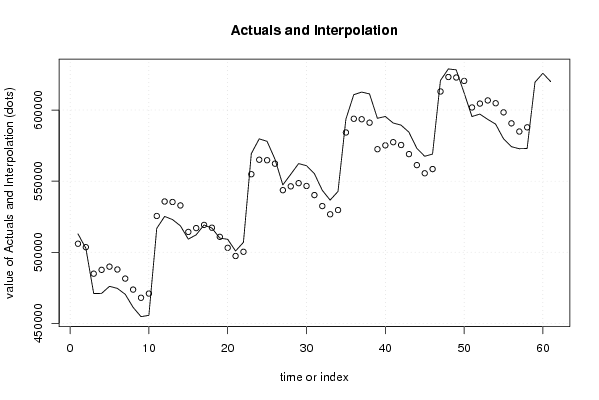
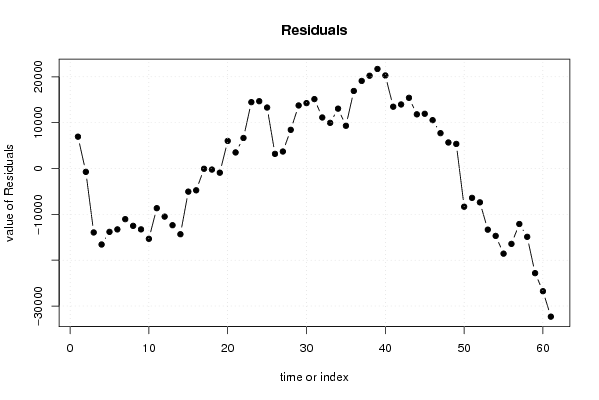
Multiple Linear Regression - Actuals, Interpolation, and Residuals
Time or IndexActualsInterpolationForecastResidualsPrediction Error
1512927505990.6025641036936.39743589748
2502831503569.348717949-738.348717948746
3470984484932.748717949-13948.7487179486
4471067487642.748717949-16575.7487179487
5476049489867.348717949-13818.3487179487
6474605487888.948717949-13283.9487179487
7470439481491.348717949-11052.3487179487
8461251473761.548717949-12510.5487179489
9454724467999.948717949-13275.9487179488
10455626470962.948717949-15336.9487179488
11516847525505.548717949-8658.5487179487
12525192535685.386538462-10493.3865384615
13522975535345.866025641-12370.8660256411
14518585532924.612179487-14339.6121794872
15509239514288.012179487-5049.01217948718
16512238516998.012179487-4760.01217948718
17519164519222.612179487-58.612179487193
18517009517244.212179487-235.212179487179
19509933510846.612179487-913.612179487188
20509127503116.8121794876010.18782051285
21500857497355.2121794873501.78782051284
22506971500318.2121794876652.78782051283
23569323554860.81217948714462.1878205128
24579714565040.6514673.35
25577992564701.1294871813290.8705128205
26565464562279.8756410263184.12435897437
27547344543643.2756410263700.72435897435
28554788546353.2756410268434.72435897435
29562325548577.87564102613747.1243589743
30560854546599.47564102614254.5243589744
31555332540201.87564102615130.1243589744
32543599532472.07564102611126.9243589744
33536662526710.4756410269951.52435897438
34542722529673.47564102613048.5243589744
35593530584216.0756410269313.92435897436
36610763593856.72435897416906.2756410256
37612613593517.20384615419095.7961538461
38611324591095.9520228.05
39594167572459.3521707.65
40595454575169.3520284.65
41590865577393.9513471.0500000000
42589379575415.5513963.45
43584428569017.9515410.05
44573100561288.1511811.8500000000
45567456555526.5511929.45
46569028558489.5510538.45
47620735613032.157702.85
48628884623211.9878205135672.01217948718
49628232622872.4673076925359.53269230767
50612117620451.213461538-8334.21346153846
51595404601814.613461538-6410.61346153846
52597141604524.613461538-7383.61346153847
53593408606749.213461538-13341.2134615385
54590072604770.813461539-14698.8134615385
55579799598373.213461538-18574.2134615385
56574205590643.413461538-16438.4134615384
57572775584881.813461539-12106.8134615385
58572942587844.813461538-14902.8134615385
59619567642387.413461538-22820.4134615385
60625809652567.251282051-26758.2512820513
61619916652227.730769231-32311.7307692308

\begin{tabular}{lllllllll}
\hline
Multiple Linear Regression - Actuals, Interpolation, and Residuals \tabularnewline
Time or Index & Actuals & InterpolationForecast & ResidualsPrediction Error \tabularnewline
1 & 512927 & 505990.602564103 & 6936.39743589748 \tabularnewline
2 & 502831 & 503569.348717949 & -738.348717948746 \tabularnewline
3 & 470984 & 484932.748717949 & -13948.7487179486 \tabularnewline
4 & 471067 & 487642.748717949 & -16575.7487179487 \tabularnewline
5 & 476049 & 489867.348717949 & -13818.3487179487 \tabularnewline
6 & 474605 & 487888.948717949 & -13283.9487179487 \tabularnewline
7 & 470439 & 481491.348717949 & -11052.3487179487 \tabularnewline
8 & 461251 & 473761.548717949 & -12510.5487179489 \tabularnewline
9 & 454724 & 467999.948717949 & -13275.9487179488 \tabularnewline
10 & 455626 & 470962.948717949 & -15336.9487179488 \tabularnewline
11 & 516847 & 525505.548717949 & -8658.5487179487 \tabularnewline
12 & 525192 & 535685.386538462 & -10493.3865384615 \tabularnewline
13 & 522975 & 535345.866025641 & -12370.8660256411 \tabularnewline
14 & 518585 & 532924.612179487 & -14339.6121794872 \tabularnewline
15 & 509239 & 514288.012179487 & -5049.01217948718 \tabularnewline
16 & 512238 & 516998.012179487 & -4760.01217948718 \tabularnewline
17 & 519164 & 519222.612179487 & -58.612179487193 \tabularnewline
18 & 517009 & 517244.212179487 & -235.212179487179 \tabularnewline
19 & 509933 & 510846.612179487 & -913.612179487188 \tabularnewline
20 & 509127 & 503116.812179487 & 6010.18782051285 \tabularnewline
21 & 500857 & 497355.212179487 & 3501.78782051284 \tabularnewline
22 & 506971 & 500318.212179487 & 6652.78782051283 \tabularnewline
23 & 569323 & 554860.812179487 & 14462.1878205128 \tabularnewline
24 & 579714 & 565040.65 & 14673.35 \tabularnewline
25 & 577992 & 564701.12948718 & 13290.8705128205 \tabularnewline
26 & 565464 & 562279.875641026 & 3184.12435897437 \tabularnewline
27 & 547344 & 543643.275641026 & 3700.72435897435 \tabularnewline
28 & 554788 & 546353.275641026 & 8434.72435897435 \tabularnewline
29 & 562325 & 548577.875641026 & 13747.1243589743 \tabularnewline
30 & 560854 & 546599.475641026 & 14254.5243589744 \tabularnewline
31 & 555332 & 540201.875641026 & 15130.1243589744 \tabularnewline
32 & 543599 & 532472.075641026 & 11126.9243589744 \tabularnewline
33 & 536662 & 526710.475641026 & 9951.52435897438 \tabularnewline
34 & 542722 & 529673.475641026 & 13048.5243589744 \tabularnewline
35 & 593530 & 584216.075641026 & 9313.92435897436 \tabularnewline
36 & 610763 & 593856.724358974 & 16906.2756410256 \tabularnewline
37 & 612613 & 593517.203846154 & 19095.7961538461 \tabularnewline
38 & 611324 & 591095.95 & 20228.05 \tabularnewline
39 & 594167 & 572459.35 & 21707.65 \tabularnewline
40 & 595454 & 575169.35 & 20284.65 \tabularnewline
41 & 590865 & 577393.95 & 13471.0500000000 \tabularnewline
42 & 589379 & 575415.55 & 13963.45 \tabularnewline
43 & 584428 & 569017.95 & 15410.05 \tabularnewline
44 & 573100 & 561288.15 & 11811.8500000000 \tabularnewline
45 & 567456 & 555526.55 & 11929.45 \tabularnewline
46 & 569028 & 558489.55 & 10538.45 \tabularnewline
47 & 620735 & 613032.15 & 7702.85 \tabularnewline
48 & 628884 & 623211.987820513 & 5672.01217948718 \tabularnewline
49 & 628232 & 622872.467307692 & 5359.53269230767 \tabularnewline
50 & 612117 & 620451.213461538 & -8334.21346153846 \tabularnewline
51 & 595404 & 601814.613461538 & -6410.61346153846 \tabularnewline
52 & 597141 & 604524.613461538 & -7383.61346153847 \tabularnewline
53 & 593408 & 606749.213461538 & -13341.2134615385 \tabularnewline
54 & 590072 & 604770.813461539 & -14698.8134615385 \tabularnewline
55 & 579799 & 598373.213461538 & -18574.2134615385 \tabularnewline
56 & 574205 & 590643.413461538 & -16438.4134615384 \tabularnewline
57 & 572775 & 584881.813461539 & -12106.8134615385 \tabularnewline
58 & 572942 & 587844.813461538 & -14902.8134615385 \tabularnewline
59 & 619567 & 642387.413461538 & -22820.4134615385 \tabularnewline
60 & 625809 & 652567.251282051 & -26758.2512820513 \tabularnewline
61 & 619916 & 652227.730769231 & -32311.7307692308 \tabularnewline
\hline
\end{tabular}
%Source: https://freestatistics.org/blog/index.php?pk=26631&T=4

[TABLE]
[ROW][C]Multiple Linear Regression - Actuals, Interpolation, and Residuals[/C][/ROW]
[ROW][C]Time or Index[/C][C]Actuals[/C][C]InterpolationForecast[/C][C]ResidualsPrediction Error[/C][/ROW]
[ROW][C]1[/C][C]512927[/C][C]505990.602564103[/C][C]6936.39743589748[/C][/ROW]
[ROW][C]2[/C][C]502831[/C][C]503569.348717949[/C][C]-738.348717948746[/C][/ROW]
[ROW][C]3[/C][C]470984[/C][C]484932.748717949[/C][C]-13948.7487179486[/C][/ROW]
[ROW][C]4[/C][C]471067[/C][C]487642.748717949[/C][C]-16575.7487179487[/C][/ROW]
[ROW][C]5[/C][C]476049[/C][C]489867.348717949[/C][C]-13818.3487179487[/C][/ROW]
[ROW][C]6[/C][C]474605[/C][C]487888.948717949[/C][C]-13283.9487179487[/C][/ROW]
[ROW][C]7[/C][C]470439[/C][C]481491.348717949[/C][C]-11052.3487179487[/C][/ROW]
[ROW][C]8[/C][C]461251[/C][C]473761.548717949[/C][C]-12510.5487179489[/C][/ROW]
[ROW][C]9[/C][C]454724[/C][C]467999.948717949[/C][C]-13275.9487179488[/C][/ROW]
[ROW][C]10[/C][C]455626[/C][C]470962.948717949[/C][C]-15336.9487179488[/C][/ROW]
[ROW][C]11[/C][C]516847[/C][C]525505.548717949[/C][C]-8658.5487179487[/C][/ROW]
[ROW][C]12[/C][C]525192[/C][C]535685.386538462[/C][C]-10493.3865384615[/C][/ROW]
[ROW][C]13[/C][C]522975[/C][C]535345.866025641[/C][C]-12370.8660256411[/C][/ROW]
[ROW][C]14[/C][C]518585[/C][C]532924.612179487[/C][C]-14339.6121794872[/C][/ROW]
[ROW][C]15[/C][C]509239[/C][C]514288.012179487[/C][C]-5049.01217948718[/C][/ROW]
[ROW][C]16[/C][C]512238[/C][C]516998.012179487[/C][C]-4760.01217948718[/C][/ROW]
[ROW][C]17[/C][C]519164[/C][C]519222.612179487[/C][C]-58.612179487193[/C][/ROW]
[ROW][C]18[/C][C]517009[/C][C]517244.212179487[/C][C]-235.212179487179[/C][/ROW]
[ROW][C]19[/C][C]509933[/C][C]510846.612179487[/C][C]-913.612179487188[/C][/ROW]
[ROW][C]20[/C][C]509127[/C][C]503116.812179487[/C][C]6010.18782051285[/C][/ROW]
[ROW][C]21[/C][C]500857[/C][C]497355.212179487[/C][C]3501.78782051284[/C][/ROW]
[ROW][C]22[/C][C]506971[/C][C]500318.212179487[/C][C]6652.78782051283[/C][/ROW]
[ROW][C]23[/C][C]569323[/C][C]554860.812179487[/C][C]14462.1878205128[/C][/ROW]
[ROW][C]24[/C][C]579714[/C][C]565040.65[/C][C]14673.35[/C][/ROW]
[ROW][C]25[/C][C]577992[/C][C]564701.12948718[/C][C]13290.8705128205[/C][/ROW]
[ROW][C]26[/C][C]565464[/C][C]562279.875641026[/C][C]3184.12435897437[/C][/ROW]
[ROW][C]27[/C][C]547344[/C][C]543643.275641026[/C][C]3700.72435897435[/C][/ROW]
[ROW][C]28[/C][C]554788[/C][C]546353.275641026[/C][C]8434.72435897435[/C][/ROW]
[ROW][C]29[/C][C]562325[/C][C]548577.875641026[/C][C]13747.1243589743[/C][/ROW]
[ROW][C]30[/C][C]560854[/C][C]546599.475641026[/C][C]14254.5243589744[/C][/ROW]
[ROW][C]31[/C][C]555332[/C][C]540201.875641026[/C][C]15130.1243589744[/C][/ROW]
[ROW][C]32[/C][C]543599[/C][C]532472.075641026[/C][C]11126.9243589744[/C][/ROW]
[ROW][C]33[/C][C]536662[/C][C]526710.475641026[/C][C]9951.52435897438[/C][/ROW]
[ROW][C]34[/C][C]542722[/C][C]529673.475641026[/C][C]13048.5243589744[/C][/ROW]
[ROW][C]35[/C][C]593530[/C][C]584216.075641026[/C][C]9313.92435897436[/C][/ROW]
[ROW][C]36[/C][C]610763[/C][C]593856.724358974[/C][C]16906.2756410256[/C][/ROW]
[ROW][C]37[/C][C]612613[/C][C]593517.203846154[/C][C]19095.7961538461[/C][/ROW]
[ROW][C]38[/C][C]611324[/C][C]591095.95[/C][C]20228.05[/C][/ROW]
[ROW][C]39[/C][C]594167[/C][C]572459.35[/C][C]21707.65[/C][/ROW]
[ROW][C]40[/C][C]595454[/C][C]575169.35[/C][C]20284.65[/C][/ROW]
[ROW][C]41[/C][C]590865[/C][C]577393.95[/C][C]13471.0500000000[/C][/ROW]
[ROW][C]42[/C][C]589379[/C][C]575415.55[/C][C]13963.45[/C][/ROW]
[ROW][C]43[/C][C]584428[/C][C]569017.95[/C][C]15410.05[/C][/ROW]
[ROW][C]44[/C][C]573100[/C][C]561288.15[/C][C]11811.8500000000[/C][/ROW]
[ROW][C]45[/C][C]567456[/C][C]555526.55[/C][C]11929.45[/C][/ROW]
[ROW][C]46[/C][C]569028[/C][C]558489.55[/C][C]10538.45[/C][/ROW]
[ROW][C]47[/C][C]620735[/C][C]613032.15[/C][C]7702.85[/C][/ROW]
[ROW][C]48[/C][C]628884[/C][C]623211.987820513[/C][C]5672.01217948718[/C][/ROW]
[ROW][C]49[/C][C]628232[/C][C]622872.467307692[/C][C]5359.53269230767[/C][/ROW]
[ROW][C]50[/C][C]612117[/C][C]620451.213461538[/C][C]-8334.21346153846[/C][/ROW]
[ROW][C]51[/C][C]595404[/C][C]601814.613461538[/C][C]-6410.61346153846[/C][/ROW]
[ROW][C]52[/C][C]597141[/C][C]604524.613461538[/C][C]-7383.61346153847[/C][/ROW]
[ROW][C]53[/C][C]593408[/C][C]606749.213461538[/C][C]-13341.2134615385[/C][/ROW]
[ROW][C]54[/C][C]590072[/C][C]604770.813461539[/C][C]-14698.8134615385[/C][/ROW]
[ROW][C]55[/C][C]579799[/C][C]598373.213461538[/C][C]-18574.2134615385[/C][/ROW]
[ROW][C]56[/C][C]574205[/C][C]590643.413461538[/C][C]-16438.4134615384[/C][/ROW]
[ROW][C]57[/C][C]572775[/C][C]584881.813461539[/C][C]-12106.8134615385[/C][/ROW]
[ROW][C]58[/C][C]572942[/C][C]587844.813461538[/C][C]-14902.8134615385[/C][/ROW]
[ROW][C]59[/C][C]619567[/C][C]642387.413461538[/C][C]-22820.4134615385[/C][/ROW]
[ROW][C]60[/C][C]625809[/C][C]652567.251282051[/C][C]-26758.2512820513[/C][/ROW]
[ROW][C]61[/C][C]619916[/C][C]652227.730769231[/C][C]-32311.7307692308[/C][/ROW]
[/TABLE]
Source: https://freestatistics.org/blog/index.php?pk=26631&T=4

Globally Unique Identifier (entire table): ba.freestatistics.org/blog/index.php?pk=26631&T=4

As an alternative you can also use a QR Code:  

The GUIDs for individual cells are displayed in the table below:

Multiple Linear Regression - Actuals, Interpolation, and Residuals
Time or IndexActualsInterpolationForecastResidualsPrediction Error
1512927505990.6025641036936.39743589748
2502831503569.348717949-738.348717948746
3470984484932.748717949-13948.7487179486
4471067487642.748717949-16575.7487179487
5476049489867.348717949-13818.3487179487
6474605487888.948717949-13283.9487179487
7470439481491.348717949-11052.3487179487
8461251473761.548717949-12510.5487179489
9454724467999.948717949-13275.9487179488
10455626470962.948717949-15336.9487179488
11516847525505.548717949-8658.5487179487
12525192535685.386538462-10493.3865384615
13522975535345.866025641-12370.8660256411
14518585532924.612179487-14339.6121794872
15509239514288.012179487-5049.01217948718
16512238516998.012179487-4760.01217948718
17519164519222.612179487-58.612179487193
18517009517244.212179487-235.212179487179
19509933510846.612179487-913.612179487188
20509127503116.8121794876010.18782051285
21500857497355.2121794873501.78782051284
22506971500318.2121794876652.78782051283
23569323554860.81217948714462.1878205128
24579714565040.6514673.35
25577992564701.1294871813290.8705128205
26565464562279.8756410263184.12435897437
27547344543643.2756410263700.72435897435
28554788546353.2756410268434.72435897435
29562325548577.87564102613747.1243589743
30560854546599.47564102614254.5243589744
31555332540201.87564102615130.1243589744
32543599532472.07564102611126.9243589744
33536662526710.4756410269951.52435897438
34542722529673.47564102613048.5243589744
35593530584216.0756410269313.92435897436
36610763593856.72435897416906.2756410256
37612613593517.20384615419095.7961538461
38611324591095.9520228.05
39594167572459.3521707.65
40595454575169.3520284.65
41590865577393.9513471.0500000000
42589379575415.5513963.45
43584428569017.9515410.05
44573100561288.1511811.8500000000
45567456555526.5511929.45
46569028558489.5510538.45
47620735613032.157702.85
48628884623211.9878205135672.01217948718
49628232622872.4673076925359.53269230767
50612117620451.213461538-8334.21346153846
51595404601814.613461538-6410.61346153846
52597141604524.613461538-7383.61346153847
53593408606749.213461538-13341.2134615385
54590072604770.813461539-14698.8134615385
55579799598373.213461538-18574.2134615385
56574205590643.413461538-16438.4134615384
57572775584881.813461539-12106.8134615385
58572942587844.813461538-14902.8134615385
59619567642387.413461538-22820.4134615385
60625809652567.251282051-26758.2512820513
61619916652227.730769231-32311.7307692308


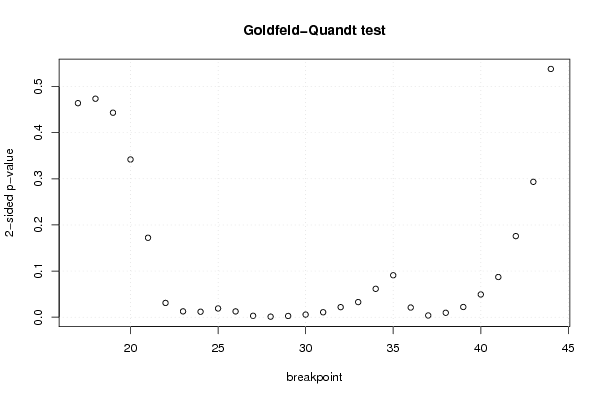
Goldfeld-Quandt test for Heteroskedasticity
p-valuesAlternative Hypothesis
breakpoint indexgreater2-sidedless
170.7680481627363690.4639036745272620.231951837263631
180.7632230601975840.4735538796048330.236776939802416
190.7783829972785350.4432340054429290.221617002721465
200.8290809613122270.3418380773755450.170919038687773
210.9139108215265960.1721783569468090.0860891784734045
220.9845011736812070.03099765263758540.0154988263187927
230.9936379097551950.01272418048960970.00636209024480483
240.994042032121730.01191593575653960.00595796787826979
250.990491029297530.01901794140494140.00950897070247071
260.9936851775199320.01262964496013530.00631482248006764
270.9984468074208260.003106385158347070.00155319257917354
280.9993806280379830.001238743924033990.000619371962016994
290.9986500334233670.002699933153265030.00134996657663251
300.997145734291810.005708531416382140.00285426570819107
310.9946058117756620.01078837644867600.00539418822433801
320.9890859251588890.02182814968222270.0109140748411113
330.9835841937234560.03283161255308840.0164158062765442
340.9692224204653780.0615551590692440.030777579534622
350.9545238982042040.09095220359159160.0454761017957958
360.9895025664503540.02099486709929220.0104974335496461
370.998099676672630.003800646654738080.00190032332736904
380.995199255514480.009601488971040150.00480074448552007
390.988919412888080.02216117422383840.0110805871119192
400.975333808252750.04933238349449940.0246661917472497
410.9564397016806840.08712059663863120.0435602983193156
420.9121223968647750.1757552062704500.0878776031352249
430.8532901879661840.2934196240676320.146709812033816
440.7309749825100170.5380500349799660.269025017489983

\begin{tabular}{lllllllll}
\hline
Goldfeld-Quandt test for Heteroskedasticity \tabularnewline
p-values & Alternative Hypothesis \tabularnewline
breakpoint index & greater & 2-sided & less \tabularnewline
17 & 0.768048162736369 & 0.463903674527262 & 0.231951837263631 \tabularnewline
18 & 0.763223060197584 & 0.473553879604833 & 0.236776939802416 \tabularnewline
19 & 0.778382997278535 & 0.443234005442929 & 0.221617002721465 \tabularnewline
20 & 0.829080961312227 & 0.341838077375545 & 0.170919038687773 \tabularnewline
21 & 0.913910821526596 & 0.172178356946809 & 0.0860891784734045 \tabularnewline
22 & 0.984501173681207 & 0.0309976526375854 & 0.0154988263187927 \tabularnewline
23 & 0.993637909755195 & 0.0127241804896097 & 0.00636209024480483 \tabularnewline
24 & 0.99404203212173 & 0.0119159357565396 & 0.00595796787826979 \tabularnewline
25 & 0.99049102929753 & 0.0190179414049414 & 0.00950897070247071 \tabularnewline
26 & 0.993685177519932 & 0.0126296449601353 & 0.00631482248006764 \tabularnewline
27 & 0.998446807420826 & 0.00310638515834707 & 0.00155319257917354 \tabularnewline
28 & 0.999380628037983 & 0.00123874392403399 & 0.000619371962016994 \tabularnewline
29 & 0.998650033423367 & 0.00269993315326503 & 0.00134996657663251 \tabularnewline
30 & 0.99714573429181 & 0.00570853141638214 & 0.00285426570819107 \tabularnewline
31 & 0.994605811775662 & 0.0107883764486760 & 0.00539418822433801 \tabularnewline
32 & 0.989085925158889 & 0.0218281496822227 & 0.0109140748411113 \tabularnewline
33 & 0.983584193723456 & 0.0328316125530884 & 0.0164158062765442 \tabularnewline
34 & 0.969222420465378 & 0.061555159069244 & 0.030777579534622 \tabularnewline
35 & 0.954523898204204 & 0.0909522035915916 & 0.0454761017957958 \tabularnewline
36 & 0.989502566450354 & 0.0209948670992922 & 0.0104974335496461 \tabularnewline
37 & 0.99809967667263 & 0.00380064665473808 & 0.00190032332736904 \tabularnewline
38 & 0.99519925551448 & 0.00960148897104015 & 0.00480074448552007 \tabularnewline
39 & 0.98891941288808 & 0.0221611742238384 & 0.0110805871119192 \tabularnewline
40 & 0.97533380825275 & 0.0493323834944994 & 0.0246661917472497 \tabularnewline
41 & 0.956439701680684 & 0.0871205966386312 & 0.0435602983193156 \tabularnewline
42 & 0.912122396864775 & 0.175755206270450 & 0.0878776031352249 \tabularnewline
43 & 0.853290187966184 & 0.293419624067632 & 0.146709812033816 \tabularnewline
44 & 0.730974982510017 & 0.538050034979966 & 0.269025017489983 \tabularnewline
\hline
\end{tabular}
%Source: https://freestatistics.org/blog/index.php?pk=26631&T=5

[TABLE]
[ROW][C]Goldfeld-Quandt test for Heteroskedasticity[/C][/ROW]
[ROW][C]p-values[/C][C]Alternative Hypothesis[/C][/ROW]
[ROW][C]breakpoint index[/C][C]greater[/C][C]2-sided[/C][C]less[/C][/ROW]
[ROW][C]17[/C][C]0.768048162736369[/C][C]0.463903674527262[/C][C]0.231951837263631[/C][/ROW]
[ROW][C]18[/C][C]0.763223060197584[/C][C]0.473553879604833[/C][C]0.236776939802416[/C][/ROW]
[ROW][C]19[/C][C]0.778382997278535[/C][C]0.443234005442929[/C][C]0.221617002721465[/C][/ROW]
[ROW][C]20[/C][C]0.829080961312227[/C][C]0.341838077375545[/C][C]0.170919038687773[/C][/ROW]
[ROW][C]21[/C][C]0.913910821526596[/C][C]0.172178356946809[/C][C]0.0860891784734045[/C][/ROW]
[ROW][C]22[/C][C]0.984501173681207[/C][C]0.0309976526375854[/C][C]0.0154988263187927[/C][/ROW]
[ROW][C]23[/C][C]0.993637909755195[/C][C]0.0127241804896097[/C][C]0.00636209024480483[/C][/ROW]
[ROW][C]24[/C][C]0.99404203212173[/C][C]0.0119159357565396[/C][C]0.00595796787826979[/C][/ROW]
[ROW][C]25[/C][C]0.99049102929753[/C][C]0.0190179414049414[/C][C]0.00950897070247071[/C][/ROW]
[ROW][C]26[/C][C]0.993685177519932[/C][C]0.0126296449601353[/C][C]0.00631482248006764[/C][/ROW]
[ROW][C]27[/C][C]0.998446807420826[/C][C]0.00310638515834707[/C][C]0.00155319257917354[/C][/ROW]
[ROW][C]28[/C][C]0.999380628037983[/C][C]0.00123874392403399[/C][C]0.000619371962016994[/C][/ROW]
[ROW][C]29[/C][C]0.998650033423367[/C][C]0.00269993315326503[/C][C]0.00134996657663251[/C][/ROW]
[ROW][C]30[/C][C]0.99714573429181[/C][C]0.00570853141638214[/C][C]0.00285426570819107[/C][/ROW]
[ROW][C]31[/C][C]0.994605811775662[/C][C]0.0107883764486760[/C][C]0.00539418822433801[/C][/ROW]
[ROW][C]32[/C][C]0.989085925158889[/C][C]0.0218281496822227[/C][C]0.0109140748411113[/C][/ROW]
[ROW][C]33[/C][C]0.983584193723456[/C][C]0.0328316125530884[/C][C]0.0164158062765442[/C][/ROW]
[ROW][C]34[/C][C]0.969222420465378[/C][C]0.061555159069244[/C][C]0.030777579534622[/C][/ROW]
[ROW][C]35[/C][C]0.954523898204204[/C][C]0.0909522035915916[/C][C]0.0454761017957958[/C][/ROW]
[ROW][C]36[/C][C]0.989502566450354[/C][C]0.0209948670992922[/C][C]0.0104974335496461[/C][/ROW]
[ROW][C]37[/C][C]0.99809967667263[/C][C]0.00380064665473808[/C][C]0.00190032332736904[/C][/ROW]
[ROW][C]38[/C][C]0.99519925551448[/C][C]0.00960148897104015[/C][C]0.00480074448552007[/C][/ROW]
[ROW][C]39[/C][C]0.98891941288808[/C][C]0.0221611742238384[/C][C]0.0110805871119192[/C][/ROW]
[ROW][C]40[/C][C]0.97533380825275[/C][C]0.0493323834944994[/C][C]0.0246661917472497[/C][/ROW]
[ROW][C]41[/C][C]0.956439701680684[/C][C]0.0871205966386312[/C][C]0.0435602983193156[/C][/ROW]
[ROW][C]42[/C][C]0.912122396864775[/C][C]0.175755206270450[/C][C]0.0878776031352249[/C][/ROW]
[ROW][C]43[/C][C]0.853290187966184[/C][C]0.293419624067632[/C][C]0.146709812033816[/C][/ROW]
[ROW][C]44[/C][C]0.730974982510017[/C][C]0.538050034979966[/C][C]0.269025017489983[/C][/ROW]
[/TABLE]
Source: https://freestatistics.org/blog/index.php?pk=26631&T=5

Globally Unique Identifier (entire table): ba.freestatistics.org/blog/index.php?pk=26631&T=5

As an alternative you can also use a QR Code:  

The GUIDs for individual cells are displayed in the table below:

Goldfeld-Quandt test for Heteroskedasticity
p-valuesAlternative Hypothesis
breakpoint indexgreater2-sidedless
170.7680481627363690.4639036745272620.231951837263631
180.7632230601975840.4735538796048330.236776939802416
190.7783829972785350.4432340054429290.221617002721465
200.8290809613122270.3418380773755450.170919038687773
210.9139108215265960.1721783569468090.0860891784734045
220.9845011736812070.03099765263758540.0154988263187927
230.9936379097551950.01272418048960970.00636209024480483
240.994042032121730.01191593575653960.00595796787826979
250.990491029297530.01901794140494140.00950897070247071
260.9936851775199320.01262964496013530.00631482248006764
270.9984468074208260.003106385158347070.00155319257917354
280.9993806280379830.001238743924033990.000619371962016994
290.9986500334233670.002699933153265030.00134996657663251
300.997145734291810.005708531416382140.00285426570819107
310.9946058117756620.01078837644867600.00539418822433801
320.9890859251588890.02182814968222270.0109140748411113
330.9835841937234560.03283161255308840.0164158062765442
340.9692224204653780.0615551590692440.030777579534622
350.9545238982042040.09095220359159160.0454761017957958
360.9895025664503540.02099486709929220.0104974335496461
370.998099676672630.003800646654738080.00190032332736904
380.995199255514480.009601488971040150.00480074448552007
390.988919412888080.02216117422383840.0110805871119192
400.975333808252750.04933238349449940.0246661917472497
410.9564397016806840.08712059663863120.0435602983193156
420.9121223968647750.1757552062704500.0878776031352249
430.8532901879661840.2934196240676320.146709812033816
440.7309749825100170.5380500349799660.269025017489983


Meta Analysis of Goldfeld-Quandt test for Heteroskedasticity
Description# significant tests% significant testsOK/NOK
1% type I error level60.214285714285714NOK
5% type I error level170.607142857142857NOK
10% type I error level200.714285714285714NOK

\begin{tabular}{lllllllll}
\hline
Meta Analysis of Goldfeld-Quandt test for Heteroskedasticity \tabularnewline
Description & # significant tests & % significant tests & OK/NOK \tabularnewline
1% type I error level & 6 & 0.214285714285714 & NOK \tabularnewline
5% type I error level & 17 & 0.607142857142857 & NOK \tabularnewline
10% type I error level & 20 & 0.714285714285714 & NOK \tabularnewline
\hline
\end{tabular}
%Source: https://freestatistics.org/blog/index.php?pk=26631&T=6

[TABLE]
[ROW][C]Meta Analysis of Goldfeld-Quandt test for Heteroskedasticity[/C][/ROW]
[ROW][C]Description[/C][C]# significant tests[/C][C]% significant tests[/C][C]OK/NOK[/C][/ROW]
[ROW][C]1% type I error level[/C][C]6[/C][C]0.214285714285714[/C][C]NOK[/C][/ROW]
[ROW][C]5% type I error level[/C][C]17[/C][C]0.607142857142857[/C][C]NOK[/C][/ROW]
[ROW][C]10% type I error level[/C][C]20[/C][C]0.714285714285714[/C][C]NOK[/C][/ROW]
[/TABLE]
Source: https://freestatistics.org/blog/index.php?pk=26631&T=6

Globally Unique Identifier (entire table): ba.freestatistics.org/blog/index.php?pk=26631&T=6

As an alternative you can also use a QR Code:  

The GUIDs for individual cells are displayed in the table below:

Meta Analysis of Goldfeld-Quandt test for Heteroskedasticity
Description# significant tests% significant testsOK/NOK
1% type I error level60.214285714285714NOK
5% type I error level170.607142857142857NOK
10% type I error level200.714285714285714NOK


Parameters (Session):
par1 = 1 ; par2 = Include Monthly Dummies ; par3 = Linear Trend ;
Parameters (R input):
par1 = 1 ; par2 = Include Monthly Dummies ; par3 = Linear Trend ;
R code (references can be found in the software module):
library(lattice)
library(lmtest)
n25 <- 25 #minimum number of obs. for Goldfeld-Quandt test
par1 <- as.numeric(par1)
x <- t(y)
k <- length(x[1,])
n <- length(x[,1])
x1 <- cbind(x[,par1], x[,1:k!=par1])
mycolnames <- c(colnames(x)[par1], colnames(x)[1:k!=par1])
colnames(x1) <- mycolnames #colnames(x)[par1]
x <- x1
if (par3 == 'First Differences'){
x2 <- array(0, dim=c(n-1,k), dimnames=list(1:(n-1), paste('(1-B)',colnames(x),sep='')))
for (i in 1:n-1) {
for (j in 1:k) {
x2[i,j] <- x[i+1,j] - x[i,j]
}
}
x <- x2
}
if (par2 == 'Include Monthly Dummies'){
x2 <- array(0, dim=c(n,11), dimnames=list(1:n, paste('M', seq(1:11), sep ='')))
for (i in 1:11){
x2[seq(i,n,12),i] <- 1
}
x <- cbind(x, x2)
}
if (par2 == 'Include Quarterly Dummies'){
x2 <- array(0, dim=c(n,3), dimnames=list(1:n, paste('Q', seq(1:3), sep ='')))
for (i in 1:3){
x2[seq(i,n,4),i] <- 1
}
x <- cbind(x, x2)
}
k <- length(x[1,])
if (par3 == 'Linear Trend'){
x <- cbind(x, c(1:n))
colnames(x)[k+1] <- 't'
}
x
k <- length(x[1,])
df <- as.data.frame(x)
(mylm <- lm(df))
(mysum <- summary(mylm))
if (n > n25) {
kp3 <- k + 3
nmkm3 <- n - k - 3
gqarr <- array(NA, dim=c(nmkm3-kp3+1,3))
numgqtests <- 0
numsignificant1 <- 0
numsignificant5 <- 0
numsignificant10 <- 0
for (mypoint in kp3:nmkm3) {
j <- 0
numgqtests <- numgqtests + 1
for (myalt in c('greater', 'two.sided', 'less')) {
j <- j + 1
gqarr[mypoint-kp3+1,j] <- gqtest(mylm, point=mypoint, alternative=myalt)$p.value
}
if (gqarr[mypoint-kp3+1,2] < 0.01) numsignificant1 <- numsignificant1 + 1
if (gqarr[mypoint-kp3+1,2] < 0.05) numsignificant5 <- numsignificant5 + 1
if (gqarr[mypoint-kp3+1,2] < 0.10) numsignificant10 <- numsignificant10 + 1
}
gqarr
}
bitmap(file='test0.png')
plot(x[,1], type='l', main='Actuals and Interpolation', ylab='value of Actuals and Interpolation (dots)', xlab='time or index')
points(x[,1]-mysum$resid)
grid()
dev.off()
bitmap(file='test1.png')
plot(mysum$resid, type='b', pch=19, main='Residuals', ylab='value of Residuals', xlab='time or index')
grid()
dev.off()
bitmap(file='test2.png')
hist(mysum$resid, main='Residual Histogram', xlab='values of Residuals')
grid()
dev.off()
bitmap(file='test3.png')
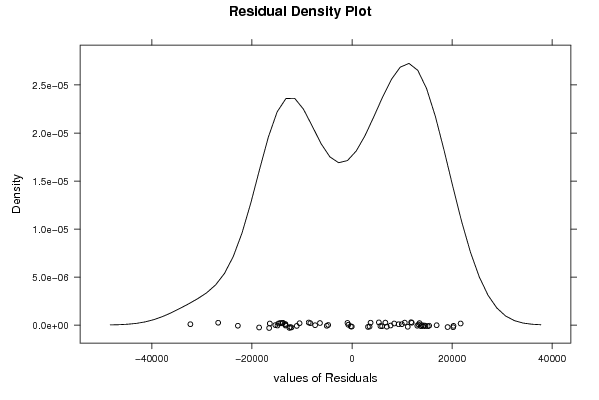
densityplot(~mysum$resid,col='black',main='Residual Density Plot', xlab='values of Residuals')
dev.off()
bitmap(file='test4.png')
qqnorm(mysum$resid, main='Residual Normal Q-Q Plot')
qqline(mysum$resid)
grid()
dev.off()
(myerror <- as.ts(mysum$resid))
bitmap(file='test5.png')
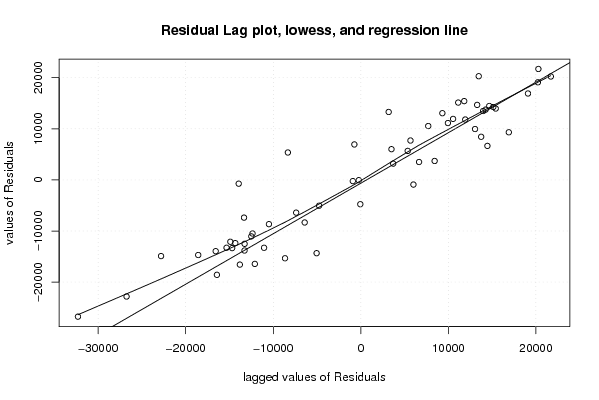
dum <- cbind(lag(myerror,k=1),myerror)
dum
dum1 <- dum[2:length(myerror),]
dum1
z <- as.data.frame(dum1)
z
plot(z,main=paste('Residual Lag plot, lowess, and regression line'), ylab='values of Residuals', xlab='lagged values of Residuals')
lines(lowess(z))
abline(lm(z))
grid()
dev.off()
bitmap(file='test6.png')
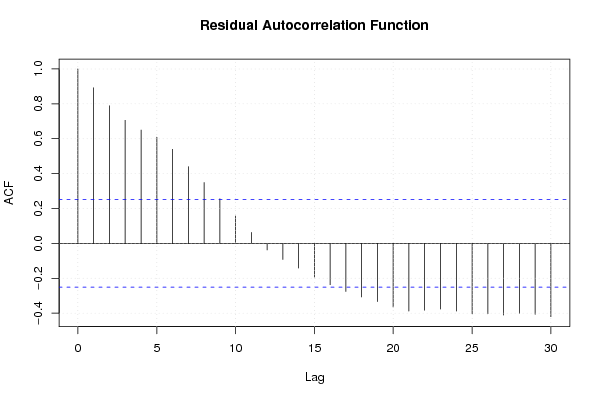
acf(mysum$resid, lag.max=length(mysum$resid)/2, main='Residual Autocorrelation Function')
grid()
dev.off()
bitmap(file='test7.png')
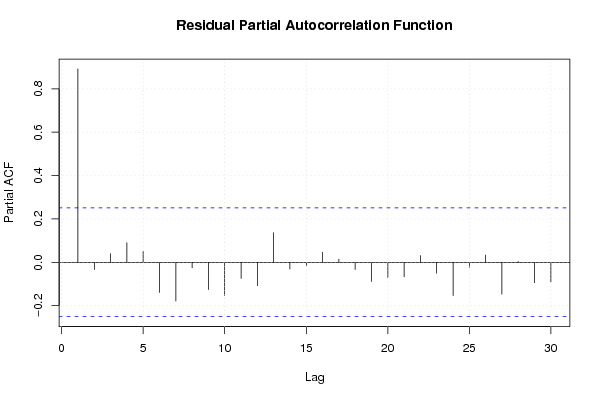
pacf(mysum$resid, lag.max=length(mysum$resid)/2, main='Residual Partial Autocorrelation Function')
grid()
dev.off()
bitmap(file='test8.png')
opar <- par(mfrow = c(2,2), oma = c(0, 0, 1.1, 0))
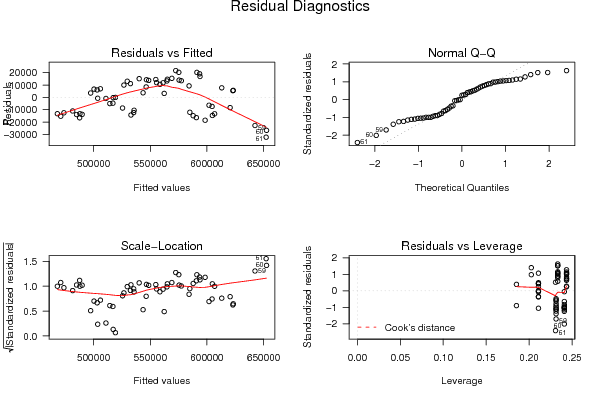
plot(mylm, las = 1, sub='Residual Diagnostics')
par(opar)
dev.off()
if (n > n25) {
bitmap(file='test9.png')
plot(kp3:nmkm3,gqarr[,2], main='Goldfeld-Quandt test',ylab='2-sided p-value',xlab='breakpoint')
grid()
dev.off()
}
load(file='createtable')
a<-table.start()
a<-table.row.start(a)
a<-table.element(a, 'Multiple Linear Regression - Estimated Regression Equation', 1, TRUE)
a<-table.row.end(a)
myeq <- colnames(x)[1]
myeq <- paste(myeq, '[t] = ', sep='')
for (i in 1:k){
if (mysum$coefficients[i,1] > 0) myeq <- paste(myeq, '+', '')
myeq <- paste(myeq, mysum$coefficients[i,1], sep=' ')
if (rownames(mysum$coefficients)[i] != '(Intercept)') {
myeq <- paste(myeq, rownames(mysum$coefficients)[i], sep='')
if (rownames(mysum$coefficients)[i] != 't') myeq <- paste(myeq, '[t]', sep='')
}
}
myeq <- paste(myeq, ' + e[t]')
a<-table.row.start(a)
a<-table.element(a, myeq)
a<-table.row.end(a)
a<-table.end(a)
table.save(a,file='mytable1.tab')
a<-table.start()
a<-table.row.start(a)
a<-table.element(a,hyperlink('ols1.htm','Multiple Linear Regression - Ordinary Least Squares',''), 6, TRUE)
a<-table.row.end(a)
a<-table.row.start(a)
a<-table.element(a,'Variable',header=TRUE)
a<-table.element(a,'Parameter',header=TRUE)
a<-table.element(a,'S.D.',header=TRUE)
a<-table.element(a,'T-STAT
H0: parameter = 0',header=TRUE)
a<-table.element(a,'2-tail p-value',header=TRUE)
a<-table.element(a,'1-tail p-value',header=TRUE)
a<-table.row.end(a)
for (i in 1:k){
a<-table.row.start(a)
a<-table.element(a,rownames(mysum$coefficients)[i],header=TRUE)
a<-table.element(a,mysum$coefficients[i,1])
a<-table.element(a, round(mysum$coefficients[i,2],6))
a<-table.element(a, round(mysum$coefficients[i,3],4))
a<-table.element(a, round(mysum$coefficients[i,4],6))
a<-table.element(a, round(mysum$coefficients[i,4]/2,6))
a<-table.row.end(a)
}
a<-table.end(a)
table.save(a,file='mytable2.tab')
a<-table.start()
a<-table.row.start(a)
a<-table.element(a, 'Multiple Linear Regression - Regression Statistics', 2, TRUE)
a<-table.row.end(a)
a<-table.row.start(a)
a<-table.element(a, 'Multiple R',1,TRUE)
a<-table.element(a, sqrt(mysum$r.squared))
a<-table.row.end(a)
a<-table.row.start(a)
a<-table.element(a, 'R-squared',1,TRUE)
a<-table.element(a, mysum$r.squared)
a<-table.row.end(a)
a<-table.row.start(a)
a<-table.element(a, 'Adjusted R-squared',1,TRUE)
a<-table.element(a, mysum$adj.r.squared)
a<-table.row.end(a)
a<-table.row.start(a)
a<-table.element(a, 'F-TEST (value)',1,TRUE)
a<-table.element(a, mysum$fstatistic[1])
a<-table.row.end(a)
a<-table.row.start(a)
a<-table.element(a, 'F-TEST (DF numerator)',1,TRUE)
a<-table.element(a, mysum$fstatistic[2])
a<-table.row.end(a)
a<-table.row.start(a)
a<-table.element(a, 'F-TEST (DF denominator)',1,TRUE)
a<-table.element(a, mysum$fstatistic[3])
a<-table.row.end(a)
a<-table.row.start(a)
a<-table.element(a, 'p-value',1,TRUE)
a<-table.element(a, 1-pf(mysum$fstatistic[1],mysum$fstatistic[2],mysum$fstatistic[3]))
a<-table.row.end(a)
a<-table.row.start(a)
a<-table.element(a, 'Multiple Linear Regression - Residual Statistics', 2, TRUE)
a<-table.row.end(a)
a<-table.row.start(a)
a<-table.element(a, 'Residual Standard Deviation',1,TRUE)
a<-table.element(a, mysum$sigma)
a<-table.row.end(a)
a<-table.row.start(a)
a<-table.element(a, 'Sum Squared Residuals',1,TRUE)
a<-table.element(a, sum(myerror*myerror))
a<-table.row.end(a)
a<-table.end(a)
table.save(a,file='mytable3.tab')
a<-table.start()
a<-table.row.start(a)
a<-table.element(a, 'Multiple Linear Regression - Actuals, Interpolation, and Residuals', 4, TRUE)
a<-table.row.end(a)
a<-table.row.start(a)
a<-table.element(a, 'Time or Index', 1, TRUE)
a<-table.element(a, 'Actuals', 1, TRUE)
a<-table.element(a, 'Interpolation
Forecast', 1, TRUE)
a<-table.element(a, 'Residuals
Prediction Error', 1, TRUE)
a<-table.row.end(a)
for (i in 1:n) {
a<-table.row.start(a)
a<-table.element(a,i, 1, TRUE)
a<-table.element(a,x[i])
a<-table.element(a,x[i]-mysum$resid[i])
a<-table.element(a,mysum$resid[i])
a<-table.row.end(a)
}
a<-table.end(a)
table.save(a,file='mytable4.tab')
if (n > n25) {
a<-table.start()
a<-table.row.start(a)
a<-table.element(a,'Goldfeld-Quandt test for Heteroskedasticity',4,TRUE)
a<-table.row.end(a)
a<-table.row.start(a)
a<-table.element(a,'p-values',header=TRUE)
a<-table.element(a,'Alternative Hypothesis',3,header=TRUE)
a<-table.row.end(a)
a<-table.row.start(a)
a<-table.element(a,'breakpoint index',header=TRUE)
a<-table.element(a,'greater',header=TRUE)
a<-table.element(a,'2-sided',header=TRUE)
a<-table.element(a,'less',header=TRUE)
a<-table.row.end(a)
for (mypoint in kp3:nmkm3) {
a<-table.row.start(a)
a<-table.element(a,mypoint,header=TRUE)
a<-table.element(a,gqarr[mypoint-kp3+1,1])
a<-table.element(a,gqarr[mypoint-kp3+1,2])
a<-table.element(a,gqarr[mypoint-kp3+1,3])
a<-table.row.end(a)
}
a<-table.end(a)
table.save(a,file='mytable5.tab')
a<-table.start()
a<-table.row.start(a)
a<-table.element(a,'Meta Analysis of Goldfeld-Quandt test for Heteroskedasticity',4,TRUE)
a<-table.row.end(a)
a<-table.row.start(a)
a<-table.element(a,'Description',header=TRUE)
a<-table.element(a,'# significant tests',header=TRUE)
a<-table.element(a,'% significant tests',header=TRUE)
a<-table.element(a,'OK/NOK',header=TRUE)
a<-table.row.end(a)
a<-table.row.start(a)
a<-table.element(a,'1% type I error level',header=TRUE)
a<-table.element(a,numsignificant1)
a<-table.element(a,numsignificant1/numgqtests)
if (numsignificant1/numgqtests < 0.01) dum <- 'OK' else dum <- 'NOK'
a<-table.element(a,dum)
a<-table.row.end(a)
a<-table.row.start(a)
a<-table.element(a,'5% type I error level',header=TRUE)
a<-table.element(a,numsignificant5)
a<-table.element(a,numsignificant5/numgqtests)
if (numsignificant5/numgqtests < 0.05) dum <- 'OK' else dum <- 'NOK'
a<-table.element(a,dum)
a<-table.row.end(a)
a<-table.row.start(a)
a<-table.element(a,'10% type I error level',header=TRUE)
a<-table.element(a,numsignificant10)
a<-table.element(a,numsignificant10/numgqtests)
if (numsignificant10/numgqtests < 0.1) dum <- 'OK' else dum <- 'NOK'
a<-table.element(a,dum)
a<-table.row.end(a)
a<-table.end(a)
table.save(a,file='mytable6.tab')
}