Free Statistics
of Irreproducible Research!
Description of Statistical Computation | |||||||||||||||||||||||||||||||||||||||||
|---|---|---|---|---|---|---|---|---|---|---|---|---|---|---|---|---|---|---|---|---|---|---|---|---|---|---|---|---|---|---|---|---|---|---|---|---|---|---|---|---|---|
| Author's title | |||||||||||||||||||||||||||||||||||||||||
| Author | *The author of this computation has been verified* | ||||||||||||||||||||||||||||||||||||||||
| R Software Module | rwasp_univariatedataseries.wasp | ||||||||||||||||||||||||||||||||||||||||
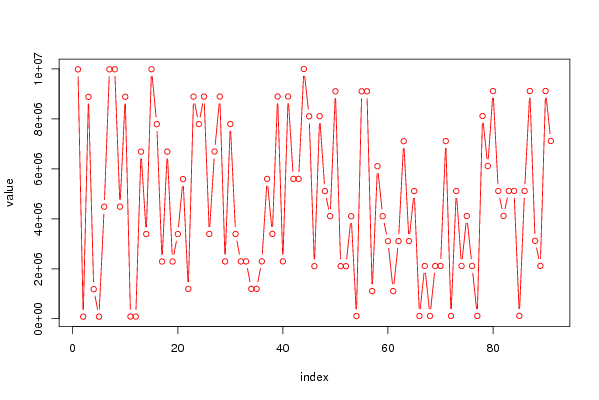
| Title produced by software | Univariate Data Series | ||||||||||||||||||||||||||||||||||||||||
| Date of computation | Fri, 03 Oct 2008 09:09:38 -0600 | ||||||||||||||||||||||||||||||||||||||||
| Cite this page as follows | Statistical Computations at FreeStatistics.org, Office for Research Development and Education, URL https://freestatistics.org/blog/index.php?v=date/2008/Oct/03/t1223049163lmbiyqhooexvcdn.htm/, Retrieved Fri, 17 May 2024 03:05:22 +0000 | ||||||||||||||||||||||||||||||||||||||||
| Statistical Computations at FreeStatistics.org, Office for Research Development and Education, URL https://freestatistics.org/blog/index.php?pk=14951, Retrieved Fri, 17 May 2024 03:05:22 +0000 | |||||||||||||||||||||||||||||||||||||||||
| QR Codes: | |||||||||||||||||||||||||||||||||||||||||
|
| |||||||||||||||||||||||||||||||||||||||||
| Original text written by user: | |||||||||||||||||||||||||||||||||||||||||
| IsPrivate? | No (this computation is public) | ||||||||||||||||||||||||||||||||||||||||
| User-defined keywords | |||||||||||||||||||||||||||||||||||||||||
| Estimated Impact | 220 | ||||||||||||||||||||||||||||||||||||||||
Tree of Dependent Computations | |||||||||||||||||||||||||||||||||||||||||
| Family? (F = Feedback message, R = changed R code, M = changed R Module, P = changed Parameters, D = changed Data) | |||||||||||||||||||||||||||||||||||||||||
| - [Univariate Data Series] [] [2008-10-03 15:09:38] [fdca7b9f854bfffb453280beefa0aca5] [Current] | |||||||||||||||||||||||||||||||||||||||||
| Feedback Forum | |||||||||||||||||||||||||||||||||||||||||
Post a new message | |||||||||||||||||||||||||||||||||||||||||
Dataset | |||||||||||||||||||||||||||||||||||||||||
| Dataseries X: | |||||||||||||||||||||||||||||||||||||||||
9983174. 0083415. 8883126. 1184830. 0084372. 4485237. 9984834. 9985428. 4486591. 8886533. 0086431. 0087500. 6687723. 3388576. 9989435. 7788846. 2289935. 6689498. 2290215. 3390291. 5590336. 1191264. 8891607. 7791739. 8892667. 3393482. 6693550. 8893444. 2292999. 7793399. 3394903. 2295435. 2295548. 1195580. 1197029. 2296181. 5598471. 3397074. 8897299. 2297029. 8898373. 5598446. 5598968. 9999442. 8101985. 2103313. 8105901. 5107783. 4105912. 9105393. 2104611. 2104038. 4103662. 0103799. 9103530. 9104189. 1105285. 6105739. 4104766. 3104778. 1105846. 3106609. 7107271. 3109247. 5109579. 0110037. 2110080. 0111547. 2109895. 2111554. 7111105. 0112445. 5112202. 2112334. 4112661. 2112594. 0113504. 8113709. 6114311. 9113542. 5113905. 4114435. 5116184. 5116170. 0116272. 5116457. 9116906. 3117024. 2117134. 9117126. 7116263. | |||||||||||||||||||||||||||||||||||||||||
Tables (Output of Computation) | |||||||||||||||||||||||||||||||||||||||||
| |||||||||||||||||||||||||||||||||||||||||
Figures (Output of Computation) | |||||||||||||||||||||||||||||||||||||||||
Input Parameters & R Code | |||||||||||||||||||||||||||||||||||||||||
| Parameters (Session): | |||||||||||||||||||||||||||||||||||||||||
| Parameters (R input): | |||||||||||||||||||||||||||||||||||||||||
| par1 = ; par2 = ; par3 = ; | |||||||||||||||||||||||||||||||||||||||||
| R code (references can be found in the software module): | |||||||||||||||||||||||||||||||||||||||||
bitmap(file='test1.png') | |||||||||||||||||||||||||||||||||||||||||