Free Statistics

of Irreproducible Research!

Author's title

Author*Unverified author*
R Software Modulerwasp_babies.wasp
Title produced by softwareExercise 1.13
Date of computationMon, 13 Oct 2008 03:26:18 -0600
Cite this page as followsStatistical Computations at FreeStatistics.org, Office for Research Development and Education, URL https://freestatistics.org/blog/index.php?v=date/2008/Oct/13/t12238900688mka51devyuean4.htm/, Retrieved Fri, 17 May 2024 05:15:40 +0000
Statistical Computations at FreeStatistics.org, Office for Research Development and Education, URL https://freestatistics.org/blog/index.php?pk=15593, Retrieved Fri, 17 May 2024 05:15:40 +0000
QR Codes:

Original text written by user:
IsPrivate?No (this computation is public)
User-defined keywords
Estimated Impact198
Family? (F = Feedback message, R = changed R code, M = changed R Module, P = changed Parameters, D = changed Data)
F     [Exercise 1.13] [Exercise 1.13 (Wo...] [2008-10-01 13:28:34] [b98453cac15ba1066b407e146608df68]
F   P     [Exercise 1.13] [Exercise 1.13 ] [2008-10-13 09:26:18] [d41d8cd98f00b204e9800998ecf8427e] [Current]
Feedback Forum
2008-10-17 08:51:51 [90714a39acc78a7b2ecd294ecc6b2864] [reply
De student heeft de vraag goed begrepen en is tot een juist resultaat gekomen maar de conclusie lijkt mij niet helemaal correct. Er werden twee nieuwe calculaties uitgevoerd en de resultaten wijzen uit dat de berekening niet echt nauwkeurig is. Ik denk dat de student in de conclusie bedoelt dat het aantal geboortes per dag in het kleine ziekenhuis te klein is om een nauwkeuriger resultaat te verkrijgen. Naar mijn mening gaat het eerder over de wet van de grote getallen die zegt dat de schatting nauwkeuriger wordt naarmate er meer simulaties worden uitgevoerd. Een mogelijke tip is de berekening meerdere malen uitvoeren en de resultaten te schikken van klein naar groot. Dan kan je als oplossing weergeven dat het resultaat ergens ligt tussen de kleinste en grootste waarde.
2008-10-17 12:56:56 [Christy Masson] [reply
Ik sluit me aan bij mijn collega dat enkele calculaties meer een beter beeld geven om te kunnen vergelijken
2008-10-17 16:29:07 [Tom Ardies] [reply
De student schrijft dat elke berekening een ander resultaat geeft en dit klopt ook. Ze zegt er wel bij dat er te weinig geboortes zijn om een goed resultaat te bekomen. Dit is een foute redenering. Ze had moeten zeggen dat de tijdspanne van de steekproef groter moest zijn.
2008-10-18 18:18:08 [Astrid Sniekers] [reply
Uitleg oplossing a en b:
De student heeft de berekening om de waarschijnlijkheid dat meer dan 60% van de geboortes jongens zijn in het kleine ziekenhuis twee keer opnieuw uitgevoerd. Dit had hij of zij beter nog een aantal keer gedaan. Op deze manier zou de student met meer zekerheid kunnen zeggen dat de oplossing niet nauwkeurig is.

Uitleg oplossing c:
De student heeft gelijk als hij of zij zegt dat de nauwkeurigheid gaat toenemen door het verwachte aantal geboortes in het kleine ziekenhuis te verhogen. Dit is echter een wijziging van de opdracht en hierdoor niet correct. De student heeft spijtig genoeg niet gedacht om het aantal dagen te verhogen. Hij of zij had de berekening een aantal keer over een grotere tijdspanne (bv. 3650 dagen = 10 jaar) moeten uitvoeren. De wet van de grote getallen zegt namelijk dat hoe meer simulaties u doet, hoe nauwkeuriger uw resultaat wordt.
2008-10-19 16:53:03 [Bonifer Spillemaeckers] [reply
De student bemerkt correct op dat elke reproductie een ander resultaat oplevert. Ze trekt hier wel een verkeerde conclusie door te stellen dat het aantal geboortes verhoogd zou moeten worden om een stabieler resultaat te bekomen.
2008-10-20 10:43:34 [0da8ca6c46830c93169756afa1dc11e0] [reply
Oplossing a & b
De conclusie die de studente hier trekt is juist, de oplossing is niet nauwkeurig. Om dit aan te tonen had ze twee maal de berekening opnieuw gedaan, door een paar extra berekeneningen had dit nog duidelijker gemaakt kunnen worden.

Oplossing c
Door het verwachte aantal geboortes te laten stijgen wordt het resultaat inderdaad nauwkeuriger, maar het doet de opgave echter ook veranderen en is bijgevolg dus niet juist. Het juiste antwoord hier moest zijn: het aantal dagen verhogen. (De wet van grote getallen)
2008-10-20 17:01:13 [Joris Deboel] [reply
2008-10-20 17:02:22 [0da8ca6c46830c93169756afa1dc11e0] [reply
Ik sluit me volledig aan bij de vorige conclusie, A & B zijn juist enkel bij vraag C is het de parameter: aantal dagen die moeten aangepast worden

Post a new message


Summary of computational transaction
Raw Inputview raw input (R code)
Raw Outputview raw output of R engine
Computing time1 seconds
R Server'Gwilym Jenkins' @ 72.249.127.135

\begin{tabular}{lllllllll}
\hline
Summary of computational transaction \tabularnewline
Raw Input & view raw input (R code)  \tabularnewline
Raw Output & view raw output of R engine  \tabularnewline
Computing time & 1 seconds \tabularnewline
R Server & 'Gwilym Jenkins' @ 72.249.127.135 \tabularnewline
\hline
\end{tabular}
%Source: https://freestatistics.org/blog/index.php?pk=15593&T=0

[TABLE]
[ROW][C]Summary of computational transaction[/C][/ROW]
[ROW][C]Raw Input[/C][C]view raw input (R code) [/C][/ROW]
[ROW][C]Raw Output[/C][C]view raw output of R engine [/C][/ROW]
[ROW][C]Computing time[/C][C]1 seconds[/C][/ROW]
[ROW][C]R Server[/C][C]'Gwilym Jenkins' @ 72.249.127.135[/C][/ROW]
[/TABLE]
Source: https://freestatistics.org/blog/index.php?pk=15593&T=0

Globally Unique Identifier (entire table): ba.freestatistics.org/blog/index.php?pk=15593&T=0

As an alternative you can also use a QR Code:  

The GUIDs for individual cells are displayed in the table below:

Summary of computational transaction
Raw Inputview raw input (R code)
Raw Outputview raw output of R engine
Computing time1 seconds
R Server'Gwilym Jenkins' @ 72.249.127.135


Exercise 1.13 p. 14 (Introduction to Probability, 2nd ed.)
Number of simulated days365
Expected number of births in Large Hospital45
Expected number of births in Small Hospital15
Percentage of Male births per day(for which the probability is computed)0.6
#Females births in Large Hospital8127
#Males births in Large Hospital8298
#Female births in Small Hospital2771
#Male births in Small Hospital2704
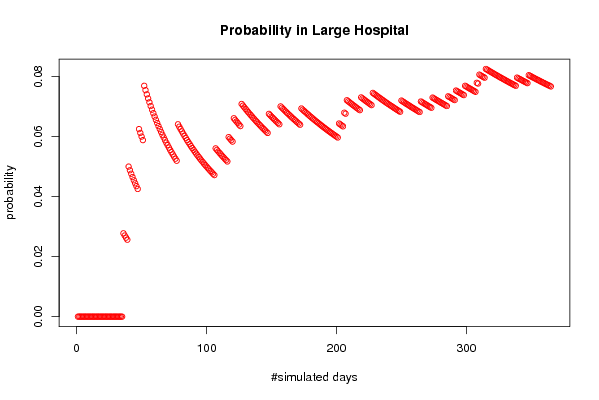
Probability of more than 60 % of male births in Large Hospital0.0767123287671233
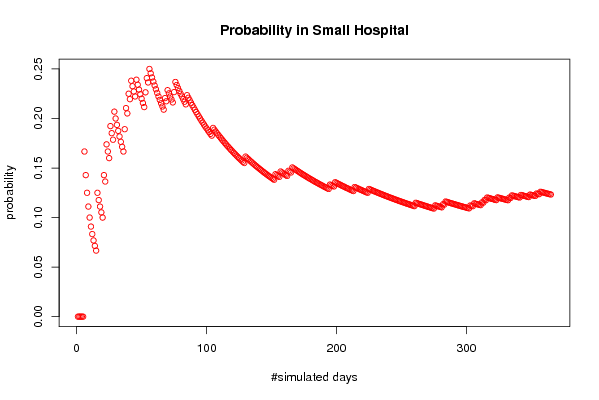
Probability of more than 60 % of male births in Small Hospital0.123287671232877
#Days per Year when more than 60 % of male births occur in Large Hospital28
#Days per Year when more than 60 % of male births occur in Small Hospital45

\begin{tabular}{lllllllll}
\hline
Exercise 1.13 p. 14 (Introduction to Probability, 2nd ed.) \tabularnewline
Number of simulated days & 365 \tabularnewline
Expected number of births in Large Hospital & 45 \tabularnewline
Expected number of births in Small Hospital & 15 \tabularnewline
Percentage of Male births per day(for which the probability is computed) & 0.6 \tabularnewline
#Females births in Large Hospital & 8127 \tabularnewline
#Males births in Large Hospital & 8298 \tabularnewline
#Female births in Small Hospital & 2771 \tabularnewline
#Male births in Small Hospital & 2704 \tabularnewline
Probability of more than 60 % of male births in Large Hospital & 0.0767123287671233 \tabularnewline
Probability of more than 60 % of male births in Small Hospital & 0.123287671232877 \tabularnewline
#Days per Year when more than 60 % of male births occur in Large Hospital & 28 \tabularnewline
#Days per Year when more than 60 % of male births occur in Small Hospital & 45 \tabularnewline
\hline
\end{tabular}
%Source: https://freestatistics.org/blog/index.php?pk=15593&T=1

[TABLE]
[ROW][C]Exercise 1.13 p. 14 (Introduction to Probability, 2nd ed.)[/C][/ROW]
[ROW][C]Number of simulated days[/C][C]365[/C][/ROW]
[ROW][C]Expected number of births in Large Hospital[/C][C]45[/C][/ROW]
[ROW][C]Expected number of births in Small Hospital[/C][C]15[/C][/ROW]
[ROW][C]Percentage of Male births per day(for which the probability is computed)[/C][C]0.6[/C][/ROW]
[ROW][C]#Females births in Large Hospital[/C][C]8127[/C][/ROW]
[ROW][C]#Males births in Large Hospital[/C][C]8298[/C][/ROW]
[ROW][C]#Female births in Small Hospital[/C][C]2771[/C][/ROW]
[ROW][C]#Male births in Small Hospital[/C][C]2704[/C][/ROW]
[ROW][C]Probability of more than 60 % of male births in Large Hospital[/C][C]0.0767123287671233[/C][/ROW]
[C]Probability of more than 60 % of male births in Small Hospital[/C][C]0.123287671232877[/C][/ROW]
[ROW][C]#Days per Year when more than 60 % of male births occur in Large Hospital[/C][C]28[/C][/ROW]
[C]#Days per Year when more than 60 % of male births occur in Small Hospital[/C][C]45[/C][/ROW]
[/TABLE]
Source: https://freestatistics.org/blog/index.php?pk=15593&T=1

Globally Unique Identifier (entire table): ba.freestatistics.org/blog/index.php?pk=15593&T=1

As an alternative you can also use a QR Code:  

The GUIDs for individual cells are displayed in the table below:

Exercise 1.13 p. 14 (Introduction to Probability, 2nd ed.)
Number of simulated days365
Expected number of births in Large Hospital45
Expected number of births in Small Hospital15
Percentage of Male births per day(for which the probability is computed)0.6
#Females births in Large Hospital8127
#Males births in Large Hospital8298
#Female births in Small Hospital2771
#Male births in Small Hospital2704
Probability of more than 60 % of male births in Large Hospital0.0767123287671233
Probability of more than 60 % of male births in Small Hospital0.123287671232877
#Days per Year when more than 60 % of male births occur in Large Hospital28
#Days per Year when more than 60 % of male births occur in Small Hospital45


Parameters (Session):
par1 = 365 ; par2 = 45 ; par3 = 15 ; par4 = 0.6 ;
Parameters (R input):
par1 = 365 ; par2 = 45 ; par3 = 15 ; par4 = 0.6 ;
R code (references can be found in the software module):
par1 <- as.numeric(par1)
par2 <- as.numeric(par2)
par3 <- as.numeric(par3)
par4 <- as.numeric(par4)
numsuccessbig <- 0
numsuccesssmall <- 0
bighospital <- array(NA,dim=c(par1,par2))
smallhospital <- array(NA,dim=c(par1,par3))
bigprob <- array(NA,dim=par1)
smallprob <- array(NA,dim=par1)
for (i in 1:par1) {
bighospital[i,] <- sample(c('F','M'),par2,replace=TRUE)
if (as.matrix(table(bighospital[i,]))[2] > par4*par2) numsuccessbig = numsuccessbig + 1
bigprob[i] <- numsuccessbig/i
smallhospital[i,] <- sample(c('F','M'),par3,replace=TRUE)
if (as.matrix(table(smallhospital[i,]))[2] > par4*par3) numsuccesssmall = numsuccesssmall + 1
smallprob[i] <- numsuccesssmall/i
}
tbig <- as.matrix(table(bighospital))
tsmall <- as.matrix(table(smallhospital))
tbig
tsmall
numsuccessbig/par1
bigprob[par1]
numsuccesssmall/par1
smallprob[par1]
numsuccessbig/par1*365
bigprob[par1]*365
numsuccesssmall/par1*365
smallprob[par1]*365
bitmap(file='test1.png')
plot(bigprob,col=2,main='Probability in Large Hospital',xlab='#simulated days',ylab='probability')
dev.off()
bitmap(file='test2.png')
plot(smallprob,col=2,main='Probability in Small Hospital',xlab='#simulated days',ylab='probability')
dev.off()
load(file='createtable')
a<-table.start()
a<-table.row.start(a)
a<-table.element(a,'Exercise 1.13 p. 14 (Introduction to Probability, 2nd ed.)',2,TRUE)
a<-table.row.end(a)
a<-table.row.start(a)
a<-table.element(a,'Number of simulated days',header=TRUE)
a<-table.element(a,par1)
a<-table.row.end(a)
a<-table.row.start(a)
a<-table.element(a,'Expected number of births in Large Hospital',header=TRUE)
a<-table.element(a,par2)
a<-table.row.end(a)
a<-table.row.start(a)
a<-table.element(a,'Expected number of births in Small Hospital',header=TRUE)
a<-table.element(a,par3)
a<-table.row.end(a)
a<-table.row.start(a)
a<-table.element(a,'Percentage of Male births per day
(for which the probability is computed)',header=TRUE)
a<-table.element(a,par4)
a<-table.row.end(a)
a<-table.row.start(a)
a<-table.element(a,'#Females births in Large Hospital',header=TRUE)
a<-table.element(a,tbig[1])
a<-table.row.end(a)
a<-table.row.start(a)
a<-table.element(a,'#Males births in Large Hospital',header=TRUE)
a<-table.element(a,tbig[2])
a<-table.row.end(a)
a<-table.row.start(a)
a<-table.element(a,'#Female births in Small Hospital',header=TRUE)
a<-table.element(a,tsmall[1])
a<-table.row.end(a)
a<-table.row.start(a)
a<-table.element(a,'#Male births in Small Hospital',header=TRUE)
a<-table.element(a,tsmall[2])
a<-table.row.end(a)
a<-table.row.start(a)
dum1 <- paste('Probability of more than', par4*100, sep=' ')
dum <- paste(dum1, '% of male births in Large Hospital', sep=' ')
a<-table.element(a, dum, header=TRUE)
a<-table.element(a, bigprob[par1])
a<-table.row.end(a)
dum <- paste(dum1, '% of male births in Small Hospital', sep=' ')
a<-table.element(a, dum, header=TRUE)
a<-table.element(a, smallprob[par1])
a<-table.row.end(a)
a<-table.row.start(a)
dum1 <- paste('#Days per Year when more than', par4*100, sep=' ')
dum <- paste(dum1, '% of male births occur in Large Hospital', sep=' ')
a<-table.element(a, dum, header=TRUE)
a<-table.element(a, bigprob[par1]*365)
a<-table.row.end(a)
dum <- paste(dum1, '% of male births occur in Small Hospital', sep=' ')
a<-table.element(a, dum, header=TRUE)
a<-table.element(a, smallprob[par1]*365)
a<-table.row.end(a)
a<-table.end(a)
table.save(a,file='mytable.tab')