Free Statistics

of Irreproducible Research!

Author's title

Author*The author of this computation has been verified*
R Software Modulerwasp_babies.wasp
Title produced by softwareExercise 1.13
Date of computationMon, 13 Oct 2008 03:32:46 -0600
Cite this page as followsStatistical Computations at FreeStatistics.org, Office for Research Development and Education, URL https://freestatistics.org/blog/index.php?v=date/2008/Oct/13/t1223890425palrdrqwdg8d1ic.htm/, Retrieved Fri, 17 May 2024 05:15:54 +0000
Statistical Computations at FreeStatistics.org, Office for Research Development and Education, URL https://freestatistics.org/blog/index.php?pk=15598, Retrieved Fri, 17 May 2024 05:15:54 +0000
QR Codes:

Original text written by user:
IsPrivate?No (this computation is public)
User-defined keywords
Estimated Impact222
Family? (F = Feedback message, R = changed R code, M = changed R Module, P = changed Parameters, D = changed Data)
F     [Exercise 1.13] [Exercise 1.13 (Wo...] [2008-10-01 13:28:34] [b98453cac15ba1066b407e146608df68]
F   P     [Exercise 1.13] [Reproductie 1] [2008-10-13 09:32:46] [d96f761aa3e94002e7c05c3c847d2c79] [Current]
Feedback Forum
2008-10-15 15:27:58 [Tamara Witters] [reply
Dit is een juiste oplossing!
Bij deze vraag is de wet van de grote getallen van toepassing.
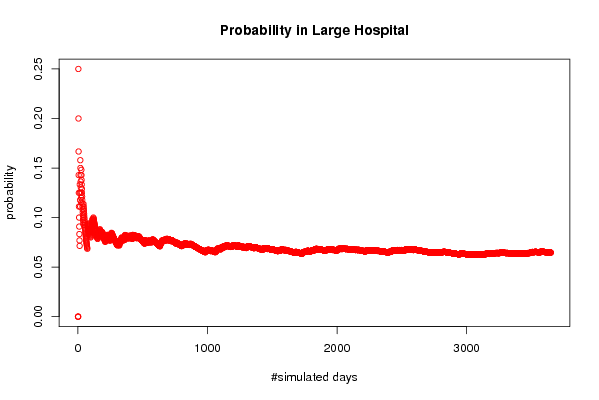
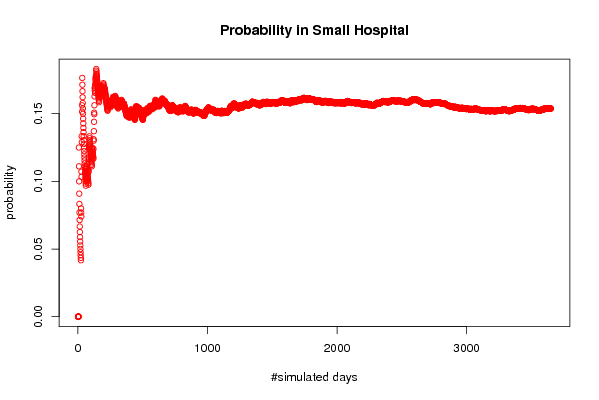
Concreet heb je hier dus het aantal dagen aangepast (van 1 jaar naar 10 jaar) om zo de nauwkeurigheid te vergroten.
Wanner je deze simulatie aan aantal keer reproduceert, verkrijg je elke keer een andere uitkomst, zoals jij hebt aangetoont in je oplosssing.
2008-10-17 11:39:13 [339a57d8a4d5d113e4804fc423e4a59e] [reply
Deze berekening is inderdaad correct. Zoals Tamara Witters reeds aangeeft is de wet van de grote getallen van toepassing, waardoor een schatting nauwkeuriger wordt naarmate men het aantal observaties vergroot. Bij deze reproductie is het aantal dagen van 365 verandert naar 3650, wat dus een groter aantal observaties teweeg brengt.
2008-10-17 15:16:36 [Julie Leurentop] [reply
Zoals de andere personen al hebben aangegeven is deze bewerking juist uitgevoerd. Door verschillende reproducties te doen, wordt de berekening inderdaad nauwkeuriger. Wat ik wel merkwaardig vind is dat de berekening niet op naam staat van Matthieu, maar op een zekere Servaes...

Let ook op dt-fouten (zowel in het werk als in de commentaar ervan op het forum).
2008-10-18 12:32:46 [Pieter Broos] [reply
link 4, 5 en 6 geven een simulatie met 3650 dagen. Wet van de grote getallen goed toegepast, bijgevolg is de redenering correct
2008-10-19 13:17:30 [Evelyn Ongena] [reply
De student heeft goed opgemerkt dat de juistheid van het percentage toeneemt wanneer we de resultaten voor een langere periode bekijken. De schommelingen zullen afnemen. Er is echter geen conclusie geschreven of mogelijke redenen gegeven waarom het wijzigen van deze parameter zou leiden tot een juister resultaat.
2008-10-19 13:44:17 [Nathalie Koulouris] [reply
De student heeft de juiste berekening gemaakt.De parameter die moet veranderd worden in de berekening is het aantal dagen. Door de trekking te vergroten, namelijk door de trekking uit te voeren over een aantal jaren, zal de nauwkeurigheid vergroten. Als we het aantal dagen veranderen in de berekening zien we dat de schommeling veel kleiner wordt.
2008-10-19 16:18:37 [Bonifer Spillemaeckers] [reply
De juiste parameter werd aangepast. Door de berekeningen uit te voeren over een langere periode bekomen we een nauwkeuriger resultaat. (Wet van de grote getallen)

Post a new message


Summary of computational transaction
Raw Inputview raw input (R code)
Raw Outputview raw output of R engine
Computing time5 seconds
R Server'George Udny Yule' @ 72.249.76.132

\begin{tabular}{lllllllll}
\hline
Summary of computational transaction \tabularnewline
Raw Input & view raw input (R code)  \tabularnewline
Raw Output & view raw output of R engine  \tabularnewline
Computing time & 5 seconds \tabularnewline
R Server & 'George Udny Yule' @ 72.249.76.132 \tabularnewline
\hline
\end{tabular}
%Source: https://freestatistics.org/blog/index.php?pk=15598&T=0

[TABLE]
[ROW][C]Summary of computational transaction[/C][/ROW]
[ROW][C]Raw Input[/C][C]view raw input (R code) [/C][/ROW]
[ROW][C]Raw Output[/C][C]view raw output of R engine [/C][/ROW]
[ROW][C]Computing time[/C][C]5 seconds[/C][/ROW]
[ROW][C]R Server[/C][C]'George Udny Yule' @ 72.249.76.132[/C][/ROW]
[/TABLE]
Source: https://freestatistics.org/blog/index.php?pk=15598&T=0

Globally Unique Identifier (entire table): ba.freestatistics.org/blog/index.php?pk=15598&T=0

As an alternative you can also use a QR Code:  

The GUIDs for individual cells are displayed in the table below:

Summary of computational transaction
Raw Inputview raw input (R code)
Raw Outputview raw output of R engine
Computing time5 seconds
R Server'George Udny Yule' @ 72.249.76.132


Exercise 1.13 p. 14 (Introduction to Probability, 2nd ed.)
Number of simulated days3650
Expected number of births in Large Hospital45
Expected number of births in Small Hospital15
Percentage of Male births per day(for which the probability is computed)0.6
#Females births in Large Hospital82141
#Males births in Large Hospital82109
#Female births in Small Hospital27288
#Male births in Small Hospital27462
Probability of more than 60 % of male births in Large Hospital0.0646575342465753
Probability of more than 60 % of male births in Small Hospital0.153972602739726
#Days per Year when more than 60 % of male births occur in Large Hospital23.6
#Days per Year when more than 60 % of male births occur in Small Hospital56.2

\begin{tabular}{lllllllll}
\hline
Exercise 1.13 p. 14 (Introduction to Probability, 2nd ed.) \tabularnewline
Number of simulated days & 3650 \tabularnewline
Expected number of births in Large Hospital & 45 \tabularnewline
Expected number of births in Small Hospital & 15 \tabularnewline
Percentage of Male births per day(for which the probability is computed) & 0.6 \tabularnewline
#Females births in Large Hospital & 82141 \tabularnewline
#Males births in Large Hospital & 82109 \tabularnewline
#Female births in Small Hospital & 27288 \tabularnewline
#Male births in Small Hospital & 27462 \tabularnewline
Probability of more than 60 % of male births in Large Hospital & 0.0646575342465753 \tabularnewline
Probability of more than 60 % of male births in Small Hospital & 0.153972602739726 \tabularnewline
#Days per Year when more than 60 % of male births occur in Large Hospital & 23.6 \tabularnewline
#Days per Year when more than 60 % of male births occur in Small Hospital & 56.2 \tabularnewline
\hline
\end{tabular}
%Source: https://freestatistics.org/blog/index.php?pk=15598&T=1

[TABLE]
[ROW][C]Exercise 1.13 p. 14 (Introduction to Probability, 2nd ed.)[/C][/ROW]
[ROW][C]Number of simulated days[/C][C]3650[/C][/ROW]
[ROW][C]Expected number of births in Large Hospital[/C][C]45[/C][/ROW]
[ROW][C]Expected number of births in Small Hospital[/C][C]15[/C][/ROW]
[ROW][C]Percentage of Male births per day(for which the probability is computed)[/C][C]0.6[/C][/ROW]
[ROW][C]#Females births in Large Hospital[/C][C]82141[/C][/ROW]
[ROW][C]#Males births in Large Hospital[/C][C]82109[/C][/ROW]
[ROW][C]#Female births in Small Hospital[/C][C]27288[/C][/ROW]
[ROW][C]#Male births in Small Hospital[/C][C]27462[/C][/ROW]
[ROW][C]Probability of more than 60 % of male births in Large Hospital[/C][C]0.0646575342465753[/C][/ROW]
[C]Probability of more than 60 % of male births in Small Hospital[/C][C]0.153972602739726[/C][/ROW]
[ROW][C]#Days per Year when more than 60 % of male births occur in Large Hospital[/C][C]23.6[/C][/ROW]
[C]#Days per Year when more than 60 % of male births occur in Small Hospital[/C][C]56.2[/C][/ROW]
[/TABLE]
Source: https://freestatistics.org/blog/index.php?pk=15598&T=1

Globally Unique Identifier (entire table): ba.freestatistics.org/blog/index.php?pk=15598&T=1

As an alternative you can also use a QR Code:  

The GUIDs for individual cells are displayed in the table below:

Exercise 1.13 p. 14 (Introduction to Probability, 2nd ed.)
Number of simulated days3650
Expected number of births in Large Hospital45
Expected number of births in Small Hospital15
Percentage of Male births per day(for which the probability is computed)0.6
#Females births in Large Hospital82141
#Males births in Large Hospital82109
#Female births in Small Hospital27288
#Male births in Small Hospital27462
Probability of more than 60 % of male births in Large Hospital0.0646575342465753
Probability of more than 60 % of male births in Small Hospital0.153972602739726
#Days per Year when more than 60 % of male births occur in Large Hospital23.6
#Days per Year when more than 60 % of male births occur in Small Hospital56.2


Parameters (Session):
par1 = 365 ; par2 = 45 ; par3 = 15 ; par4 = 0.6 ;
Parameters (R input):
par1 = 3650 ; par2 = 45 ; par3 = 15 ; par4 = 0.6 ;
R code (references can be found in the software module):
par1 <- as.numeric(par1)
par2 <- as.numeric(par2)
par3 <- as.numeric(par3)
par4 <- as.numeric(par4)
numsuccessbig <- 0
numsuccesssmall <- 0
bighospital <- array(NA,dim=c(par1,par2))
smallhospital <- array(NA,dim=c(par1,par3))
bigprob <- array(NA,dim=par1)
smallprob <- array(NA,dim=par1)
for (i in 1:par1) {
bighospital[i,] <- sample(c('F','M'),par2,replace=TRUE)
if (as.matrix(table(bighospital[i,]))[2] > par4*par2) numsuccessbig = numsuccessbig + 1
bigprob[i] <- numsuccessbig/i
smallhospital[i,] <- sample(c('F','M'),par3,replace=TRUE)
if (as.matrix(table(smallhospital[i,]))[2] > par4*par3) numsuccesssmall = numsuccesssmall + 1
smallprob[i] <- numsuccesssmall/i
}
tbig <- as.matrix(table(bighospital))
tsmall <- as.matrix(table(smallhospital))
tbig
tsmall
numsuccessbig/par1
bigprob[par1]
numsuccesssmall/par1
smallprob[par1]
numsuccessbig/par1*365
bigprob[par1]*365
numsuccesssmall/par1*365
smallprob[par1]*365
bitmap(file='test1.png')
plot(bigprob,col=2,main='Probability in Large Hospital',xlab='#simulated days',ylab='probability')
dev.off()
bitmap(file='test2.png')
plot(smallprob,col=2,main='Probability in Small Hospital',xlab='#simulated days',ylab='probability')
dev.off()
load(file='createtable')
a<-table.start()
a<-table.row.start(a)
a<-table.element(a,'Exercise 1.13 p. 14 (Introduction to Probability, 2nd ed.)',2,TRUE)
a<-table.row.end(a)
a<-table.row.start(a)
a<-table.element(a,'Number of simulated days',header=TRUE)
a<-table.element(a,par1)
a<-table.row.end(a)
a<-table.row.start(a)
a<-table.element(a,'Expected number of births in Large Hospital',header=TRUE)
a<-table.element(a,par2)
a<-table.row.end(a)
a<-table.row.start(a)
a<-table.element(a,'Expected number of births in Small Hospital',header=TRUE)
a<-table.element(a,par3)
a<-table.row.end(a)
a<-table.row.start(a)
a<-table.element(a,'Percentage of Male births per day
(for which the probability is computed)',header=TRUE)
a<-table.element(a,par4)
a<-table.row.end(a)
a<-table.row.start(a)
a<-table.element(a,'#Females births in Large Hospital',header=TRUE)
a<-table.element(a,tbig[1])
a<-table.row.end(a)
a<-table.row.start(a)
a<-table.element(a,'#Males births in Large Hospital',header=TRUE)
a<-table.element(a,tbig[2])
a<-table.row.end(a)
a<-table.row.start(a)
a<-table.element(a,'#Female births in Small Hospital',header=TRUE)
a<-table.element(a,tsmall[1])
a<-table.row.end(a)
a<-table.row.start(a)
a<-table.element(a,'#Male births in Small Hospital',header=TRUE)
a<-table.element(a,tsmall[2])
a<-table.row.end(a)
a<-table.row.start(a)
dum1 <- paste('Probability of more than', par4*100, sep=' ')
dum <- paste(dum1, '% of male births in Large Hospital', sep=' ')
a<-table.element(a, dum, header=TRUE)
a<-table.element(a, bigprob[par1])
a<-table.row.end(a)
dum <- paste(dum1, '% of male births in Small Hospital', sep=' ')
a<-table.element(a, dum, header=TRUE)
a<-table.element(a, smallprob[par1])
a<-table.row.end(a)
a<-table.row.start(a)
dum1 <- paste('#Days per Year when more than', par4*100, sep=' ')
dum <- paste(dum1, '% of male births occur in Large Hospital', sep=' ')
a<-table.element(a, dum, header=TRUE)
a<-table.element(a, bigprob[par1]*365)
a<-table.row.end(a)
dum <- paste(dum1, '% of male births occur in Small Hospital', sep=' ')
a<-table.element(a, dum, header=TRUE)
a<-table.element(a, smallprob[par1]*365)
a<-table.row.end(a)
a<-table.end(a)
table.save(a,file='mytable.tab')