Free Statistics
of Irreproducible Research!
Description of Statistical Computation | |||||||||||||||||||||||||||||||||||||||||
|---|---|---|---|---|---|---|---|---|---|---|---|---|---|---|---|---|---|---|---|---|---|---|---|---|---|---|---|---|---|---|---|---|---|---|---|---|---|---|---|---|---|
| Author's title | |||||||||||||||||||||||||||||||||||||||||
| Author | *Unverified author* | ||||||||||||||||||||||||||||||||||||||||
| R Software Module | rwasp_univariatedataseries.wasp | ||||||||||||||||||||||||||||||||||||||||
| Title produced by software | Univariate Data Series | ||||||||||||||||||||||||||||||||||||||||
| Date of computation | Mon, 13 Oct 2008 17:17:36 -0600 | ||||||||||||||||||||||||||||||||||||||||
| Cite this page as follows | Statistical Computations at FreeStatistics.org, Office for Research Development and Education, URL https://freestatistics.org/blog/index.php?v=date/2008/Oct/14/t12239398923h35p0tbhm7xh2f.htm/, Retrieved Wed, 22 May 2024 12:40:41 +0000 | ||||||||||||||||||||||||||||||||||||||||
| Statistical Computations at FreeStatistics.org, Office for Research Development and Education, URL https://freestatistics.org/blog/index.php?pk=16163, Retrieved Wed, 22 May 2024 12:40:41 +0000 | |||||||||||||||||||||||||||||||||||||||||
| QR Codes: | |||||||||||||||||||||||||||||||||||||||||
|
| |||||||||||||||||||||||||||||||||||||||||
| Original text written by user: | |||||||||||||||||||||||||||||||||||||||||
| IsPrivate? | No (this computation is public) | ||||||||||||||||||||||||||||||||||||||||
| User-defined keywords | |||||||||||||||||||||||||||||||||||||||||
| Estimated Impact | 189 | ||||||||||||||||||||||||||||||||||||||||
Tree of Dependent Computations | |||||||||||||||||||||||||||||||||||||||||
| Family? (F = Feedback message, R = changed R code, M = changed R Module, P = changed Parameters, D = changed Data) | |||||||||||||||||||||||||||||||||||||||||
| F [Univariate Data Series] [] [2008-10-13 23:08:02] [e6c4428cda034f2790871b3ffa59aa02] - PD [Univariate Data Series] [] [2008-10-13 23:11:44] [e6c4428cda034f2790871b3ffa59aa02] F PD [Univariate Data Series] [] [2008-10-13 23:17:36] [c0a347e3519123f7eef62b705326dad9] [Current] | |||||||||||||||||||||||||||||||||||||||||
| Feedback Forum | |||||||||||||||||||||||||||||||||||||||||
Post a new message | |||||||||||||||||||||||||||||||||||||||||
Dataset | |||||||||||||||||||||||||||||||||||||||||
| Dataseries X: | |||||||||||||||||||||||||||||||||||||||||
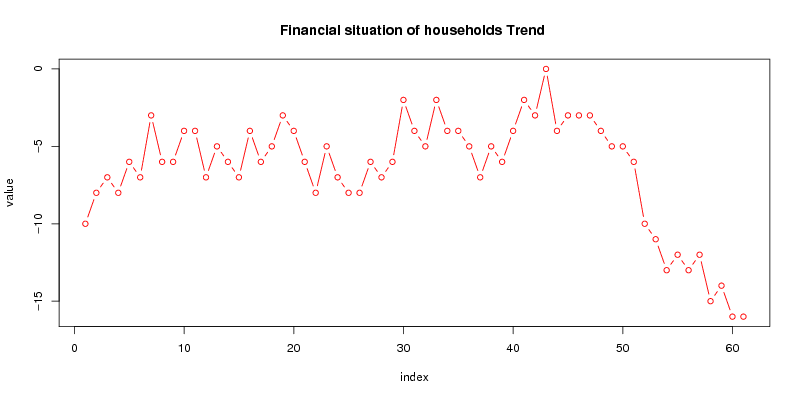
-10 -8 -7 -8 -6 -7 -3 -6 -6 -4 -4 -7 -5 -6 -7 -4 -6 -5 -3 -4 -6 -8 -5 -7 -8 -8 -6 -7 -6 -2 -4 -5 -2 -4 -4 -5 -7 -5 -6 -4 -2 -3 0 -4 -3 -3 -3 -4 -5 -5 -6 -10 -11 -13 -12 -13 -12 -15 -14 -16 -16 | |||||||||||||||||||||||||||||||||||||||||
Tables (Output of Computation) | |||||||||||||||||||||||||||||||||||||||||
| |||||||||||||||||||||||||||||||||||||||||
Figures (Output of Computation) | |||||||||||||||||||||||||||||||||||||||||
Input Parameters & R Code | |||||||||||||||||||||||||||||||||||||||||
| Parameters (Session): | |||||||||||||||||||||||||||||||||||||||||
| par1 = Financial situation of households Trend over last twelve months ; par2 = http://www.nbb.be/belgostat/PresentationLinker?Switch=true&prop=null&TableId=602000040&Lang=E ; par3 = Financial situation of households Trend over last twelve months ; | |||||||||||||||||||||||||||||||||||||||||
| Parameters (R input): | |||||||||||||||||||||||||||||||||||||||||
| par1 = Financial situation of households Trend over last twelve months ; par2 = http://www.nbb.be/belgostat/PresentationLinker?Switch=true&prop=null&TableId=602000040&Lang=E ; par3 = Financial situation of households Trend over last twelve months ; | |||||||||||||||||||||||||||||||||||||||||
| R code (references can be found in the software module): | |||||||||||||||||||||||||||||||||||||||||
bitmap(file='test1.png') | |||||||||||||||||||||||||||||||||||||||||