Free Statistics

of Irreproducible Research!

Author's title

Author*The author of this computation has been verified*
R Software Modulerwasp_correlation.wasp
Title produced by softwarePearson Correlation
Date of computationFri, 17 Oct 2008 03:24:43 -0600
Cite this page as followsStatistical Computations at FreeStatistics.org, Office for Research Development and Education, URL https://freestatistics.org/blog/index.php?v=date/2008/Oct/17/t1224235611ps3rriau7w8i1ql.htm/, Retrieved Wed, 22 May 2024 05:37:06 +0000
Statistical Computations at FreeStatistics.org, Office for Research Development and Education, URL https://freestatistics.org/blog/index.php?pk=16400, Retrieved Wed, 22 May 2024 05:37:06 +0000
QR Codes:

Original text written by user:
IsPrivate?No (this computation is public)
User-defined keywords
Estimated Impact193
Family? (F = Feedback message, R = changed R code, M = changed R Module, P = changed Parameters, D = changed Data)
-     [Back to Back Histogram] [Back-to-back hist...] [2008-10-17 08:52:06] [c5a66f1c8528a963efc2b82a8519f117]
F RMPD    [Pearson Correlation] [Pearson collerati...] [2008-10-17 09:24:43] [b4fc5040f26b33db57f84cfb8d1d2b82] [Current]
-           [Pearson Correlation] [Q3] [2008-10-17 13:39:31] [a0d819c22534897f04a2f0b92f1eb36a]
-    D      [Pearson Correlation] [Q4] [2008-10-17 14:06:21] [a0d819c22534897f04a2f0b92f1eb36a]
- RMPD      [Back to Back Histogram] [Q2 - Kleding] [2008-10-17 14:14:22] [a0d819c22534897f04a2f0b92f1eb36a]
Feedback Forum
2008-10-25 11:34:06 [Davy De Nef] [reply
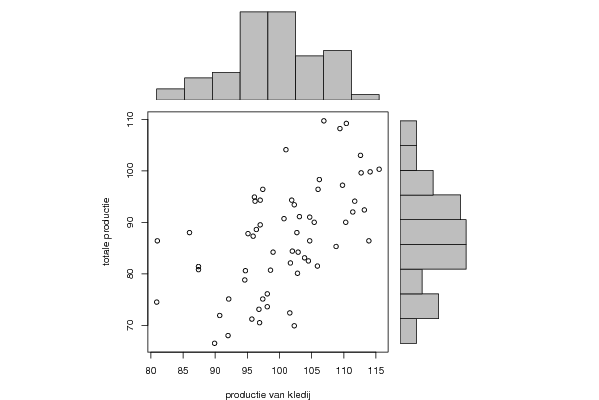
Hier gaat de student na of er een samenhang is tussen de gegevens.
We kunnen op de grafiek een denkbeeldige stijgende rechte trekken.
Er is dus sprake van een positieve correlatie.
Let wel op dat er niet noodzakelijk een verband hoeft te zijn tussen reeksen, om te kunnen spreken van een positieve correlatie.
2008-10-27 20:01:21 [Kim De Vos] [reply
Bij een correlatie zijn er 3 referentiegetallen die we in acht moeten nemen -1 < 0 < 1
Leunt je oplossing aan tegen -1 spreekt men van een negatieve correlatie, bij 0 geen correlatie en bij 1 van een positieve correlatie.
Men bekomt hier als resultaat 0.56.. dit situeert zich ongeveer te midden van 0 en 1, hieruit leiden we af dat het verband niet sterk maar ook niet zwak is.
Voor meer duidelijkheid kijk je best naar de grafiek, hier kan je een rechte trekken in stijgende lijn maar de punten liggen verspreid over een groot vlak.

Post a new message
Dataseries X:
110.40
96.40
101.90
106.20
81.00
94.70
101.00
109.40
102.30
90.70
96.20
96.10
106.00
103.10
102.00
104.70
86.00
92.10
106.90
112.60
101.70
92.00
97.40
97.00
105.40
102.70
98.10
104.50
87.40
89.90
109.80
111.70
98.60
96.90
95.10
97.00
112.70
102.90
97.40
111.40
87.40
96.80
114.10
110.30
103.90
101.60
94.60
95.90
104.70
102.80
98.10
113.90
80.90
95.70
113.20
105.90
108.80
102.30
99.00
100.70
115.50
Dataseries Y:
109.20
88.60
94.30
98.30
86.40
80.60
104.10
108.20
93.40
71.90
94.10
94.90
96.40
91.10
84.40
86.40
88.00
75.10
109.70
103.00
82.10
68.00
96.40
94.30
90.00
88.00
76.10
82.50
81.40
66.50
97.20
94.10
80.70
70.50
87.80
89.50
99.60
84.20
75.10
92.00
80.80
73.10
99.80
90.00
83.10
72.40
78.80
87.30
91.00
80.10
73.60
86.40
74.50
71.20
92.40
81.50
85.30
69.90
84.20
90.70
100.30


Summary of computational transaction
Raw Inputview raw input (R code)
Raw Outputview raw output of R engine
Computing time2 seconds
R Server'George Udny Yule' @ 72.249.76.132

\begin{tabular}{lllllllll}
\hline
Summary of computational transaction \tabularnewline
Raw Input & view raw input (R code)  \tabularnewline
Raw Output & view raw output of R engine  \tabularnewline
Computing time & 2 seconds \tabularnewline
R Server & 'George Udny Yule' @ 72.249.76.132 \tabularnewline
\hline
\end{tabular}
%Source: https://freestatistics.org/blog/index.php?pk=16400&T=0

[TABLE]
[ROW][C]Summary of computational transaction[/C][/ROW]
[ROW][C]Raw Input[/C][C]view raw input (R code) [/C][/ROW]
[ROW][C]Raw Output[/C][C]view raw output of R engine [/C][/ROW]
[ROW][C]Computing time[/C][C]2 seconds[/C][/ROW]
[ROW][C]R Server[/C][C]'George Udny Yule' @ 72.249.76.132[/C][/ROW]
[/TABLE]
Source: https://freestatistics.org/blog/index.php?pk=16400&T=0

Globally Unique Identifier (entire table): ba.freestatistics.org/blog/index.php?pk=16400&T=0

As an alternative you can also use a QR Code:  

The GUIDs for individual cells are displayed in the table below:

Summary of computational transaction
Raw Inputview raw input (R code)
Raw Outputview raw output of R engine
Computing time2 seconds
R Server'George Udny Yule' @ 72.249.76.132


Pearson Product Moment Correlation - Ungrouped Data
StatisticVariable XVariable Y
Mean100.90819672131186.8934426229508
Biased Variance64.2309164203171109.891760279495
Biased Standard Deviation8.0144192815398110.4829270854802
Covariance48.2815546448088
Correlation0.565259717157914
Determination0.319518547841445
T-Test5.2633941884171
p-value (2 sided)2.07228182791397e-06
p-value (1 sided)1.03614091395698e-06
Degrees of Freedom59
Number of Observations61

\begin{tabular}{lllllllll}
\hline
Pearson Product Moment Correlation - Ungrouped Data \tabularnewline
Statistic & Variable X & Variable Y \tabularnewline
Mean & 100.908196721311 & 86.8934426229508 \tabularnewline
Biased Variance & 64.2309164203171 & 109.891760279495 \tabularnewline
Biased Standard Deviation & 8.01441928153981 & 10.4829270854802 \tabularnewline
Covariance & 48.2815546448088 \tabularnewline
Correlation & 0.565259717157914 \tabularnewline
Determination & 0.319518547841445 \tabularnewline
T-Test & 5.2633941884171 \tabularnewline
p-value (2 sided) & 2.07228182791397e-06 \tabularnewline
p-value (1 sided) & 1.03614091395698e-06 \tabularnewline
Degrees of Freedom & 59 \tabularnewline
Number of Observations & 61 \tabularnewline
\hline
\end{tabular}
%Source: https://freestatistics.org/blog/index.php?pk=16400&T=1

[TABLE]
[ROW][C]Pearson Product Moment Correlation - Ungrouped Data[/C][/ROW]
[ROW][C]Statistic[/C][C]Variable X[/C][C]Variable Y[/C][/ROW]
[ROW][C]Mean[/C][C]100.908196721311[/C][C]86.8934426229508[/C][/ROW]
[ROW][C]Biased Variance[/C][C]64.2309164203171[/C][C]109.891760279495[/C][/ROW]
[ROW][C]Biased Standard Deviation[/C][C]8.01441928153981[/C][C]10.4829270854802[/C][/ROW]
[ROW][C]Covariance[/C][C]48.2815546448088[/C][/ROW]
[ROW][C]Correlation[/C][C]0.565259717157914[/C][/ROW]
[ROW][C]Determination[/C][C]0.319518547841445[/C][/ROW]
[ROW][C]T-Test[/C][C]5.2633941884171[/C][/ROW]
[ROW][C]p-value (2 sided)[/C][C]2.07228182791397e-06[/C][/ROW]
[ROW][C]p-value (1 sided)[/C][C]1.03614091395698e-06[/C][/ROW]
[ROW][C]Degrees of Freedom[/C][C]59[/C][/ROW]
[ROW][C]Number of Observations[/C][C]61[/C][/ROW]
[/TABLE]
Source: https://freestatistics.org/blog/index.php?pk=16400&T=1

Globally Unique Identifier (entire table): ba.freestatistics.org/blog/index.php?pk=16400&T=1

As an alternative you can also use a QR Code:  

The GUIDs for individual cells are displayed in the table below:

Pearson Product Moment Correlation - Ungrouped Data
StatisticVariable XVariable Y
Mean100.90819672131186.8934426229508
Biased Variance64.2309164203171109.891760279495
Biased Standard Deviation8.0144192815398110.4829270854802
Covariance48.2815546448088
Correlation0.565259717157914
Determination0.319518547841445
T-Test5.2633941884171
p-value (2 sided)2.07228182791397e-06
p-value (1 sided)1.03614091395698e-06
Degrees of Freedom59
Number of Observations61


Parameters (Session):
Parameters (R input):
R code (references can be found in the software module):
bitmap(file='test1.png')
histx <- hist(x, plot=FALSE)
histy <- hist(y, plot=FALSE)
maxcounts <- max(c(histx$counts, histx$counts))
xrange <- c(min(x),max(x))
yrange <- c(min(y),max(y))
nf <- layout(matrix(c(2,0,1,3),2,2,byrow=TRUE), c(3,1), c(1,3), TRUE)
par(mar=c(4,4,1,1))
plot(x, y, xlim=xrange, ylim=yrange, xlab=xlab, ylab=ylab)
par(mar=c(0,4,1,1))
barplot(histx$counts, axes=FALSE, ylim=c(0, maxcounts), space=0)
par(mar=c(4,0,1,1))
barplot(histy$counts, axes=FALSE, xlim=c(0, maxcounts), space=0, horiz=TRUE)
dev.off()
lx = length(x)
makebiased = (lx-1)/lx
varx = var(x)*makebiased
vary = var(y)*makebiased
corxy <- cor.test(x,y,method='pearson')
cxy <- as.matrix(corxy$estimate)[1,1]
load(file='createtable')
a<-table.start()
a<-table.row.start(a)
a<-table.element(a,'Pearson Product Moment Correlation - Ungrouped Data',3,TRUE)
a<-table.row.end(a)
a<-table.row.start(a)
a<-table.element(a,'Statistic',1,TRUE)
a<-table.element(a,'Variable X',1,TRUE)
a<-table.element(a,'Variable Y',1,TRUE)
a<-table.row.end(a)
a<-table.row.start(a)
a<-table.element(a,hyperlink('arithmetic_mean.htm','Mean',''),header=TRUE)
a<-table.element(a,mean(x))
a<-table.element(a,mean(y))
a<-table.row.end(a)
a<-table.row.start(a)
a<-table.element(a,hyperlink('biased.htm','Biased Variance',''),header=TRUE)
a<-table.element(a,varx)
a<-table.element(a,vary)
a<-table.row.end(a)
a<-table.row.start(a)
a<-table.element(a,hyperlink('biased1.htm','Biased Standard Deviation',''),header=TRUE)
a<-table.element(a,sqrt(varx))
a<-table.element(a,sqrt(vary))
a<-table.row.end(a)
a<-table.row.start(a)
a<-table.element(a,hyperlink('covariance.htm','Covariance',''),header=TRUE)
a<-table.element(a,cov(x,y),2)
a<-table.row.end(a)
a<-table.row.start(a)
a<-table.element(a,hyperlink('pearson_correlation.htm','Correlation',''),header=TRUE)
a<-table.element(a,cxy,2)
a<-table.row.end(a)
a<-table.row.start(a)
a<-table.element(a,hyperlink('coeff_of_determination.htm','Determination',''),header=TRUE)
a<-table.element(a,cxy*cxy,2)
a<-table.row.end(a)
a<-table.row.start(a)
a<-table.element(a,hyperlink('ttest_statistic.htm','T-Test',''),header=TRUE)
a<-table.element(a,as.matrix(corxy$statistic)[1,1],2)
a<-table.row.end(a)
a<-table.row.start(a)
a<-table.element(a,'p-value (2 sided)',header=TRUE)
a<-table.element(a,(p2 <- as.matrix(corxy$p.value)[1,1]),2)
a<-table.row.end(a)
a<-table.row.start(a)
a<-table.element(a,'p-value (1 sided)',header=TRUE)
a<-table.element(a,p2/2,2)
a<-table.row.end(a)
a<-table.row.start(a)
a<-table.element(a,'Degrees of Freedom',header=TRUE)
a<-table.element(a,lx-2,2)
a<-table.row.end(a)
a<-table.row.start(a)
a<-table.element(a,'Number of Observations',header=TRUE)
a<-table.element(a,lx,2)
a<-table.row.end(a)
a<-table.end(a)
table.save(a,file='mytable.tab')