Free Statistics
of Irreproducible Research!
Description of Statistical Computation | |||||||||||||||||||||
|---|---|---|---|---|---|---|---|---|---|---|---|---|---|---|---|---|---|---|---|---|---|
| Author's title | |||||||||||||||||||||
| Author | *The author of this computation has been verified* | ||||||||||||||||||||
| R Software Module | rwasp_backtobackhist.wasp | ||||||||||||||||||||
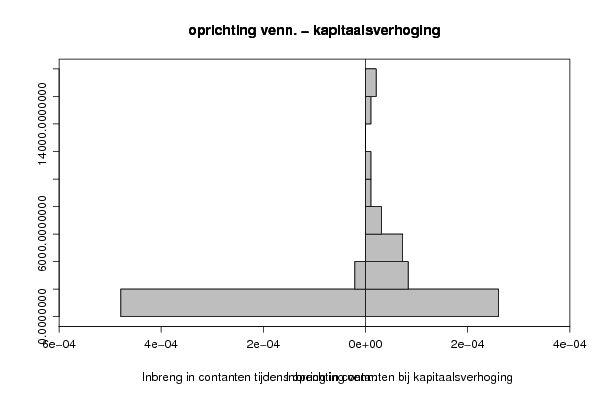
| Title produced by software | Back to Back Histogram | ||||||||||||||||||||
| Date of computation | Sun, 19 Oct 2008 08:34:06 -0600 | ||||||||||||||||||||
| Cite this page as follows | Statistical Computations at FreeStatistics.org, Office for Research Development and Education, URL https://freestatistics.org/blog/index.php?v=date/2008/Oct/19/t1224427177eej69emgttlnxl6.htm/, Retrieved Fri, 17 May 2024 10:09:11 +0000 | ||||||||||||||||||||
| Statistical Computations at FreeStatistics.org, Office for Research Development and Education, URL https://freestatistics.org/blog/index.php?pk=16880, Retrieved Fri, 17 May 2024 10:09:11 +0000 | |||||||||||||||||||||
| QR Codes: | |||||||||||||||||||||
|
| |||||||||||||||||||||
| Original text written by user: | |||||||||||||||||||||
| IsPrivate? | No (this computation is public) | ||||||||||||||||||||
| User-defined keywords | |||||||||||||||||||||
| Estimated Impact | 163 | ||||||||||||||||||||
Tree of Dependent Computations | |||||||||||||||||||||
| Family? (F = Feedback message, R = changed R code, M = changed R Module, P = changed Parameters, D = changed Data) | |||||||||||||||||||||
| - [Back to Back Histogram] [Investigating Ass...] [2007-10-22 22:01:16] [b9964c45117f7aac638ab9056d451faa] F PD [Back to Back Histogram] [Task 3 - Q8 - inb...] [2008-10-19 14:34:06] [dafd615cb3e0decc017580d68ecea30a] [Current] | |||||||||||||||||||||
| Feedback Forum | |||||||||||||||||||||
Post a new message | |||||||||||||||||||||
Dataset | |||||||||||||||||||||
| Dataseries X: | |||||||||||||||||||||
209 169 325 293 93 297 2125 149 106 172 107 155 751 79 149 589 44 320 270 141 314 341 101 2053 81 46 73 44 33 115 70 58 68 62 160 65 101 80 80 74 70 102 65 87 81 155 111 37 | |||||||||||||||||||||
| Dataseries Y: | |||||||||||||||||||||
17501 2127 6187 5006 6005 5127 3022 2291 6084 8323 2338 1432 4019 3167 1292 4622 1631 4783 3417 4858 3057 16061 1533 11544 4115 850 501 1148 224 185 1083 478 815 1932 643 472 14367 920 997 2834 466 912 894 491 371 1422 343 1047 | |||||||||||||||||||||
Tables (Output of Computation) | |||||||||||||||||||||
| |||||||||||||||||||||
Figures (Output of Computation) | |||||||||||||||||||||
Input Parameters & R Code | |||||||||||||||||||||
| Parameters (Session): | |||||||||||||||||||||
| par1 = grey ; par2 = grey ; par3 = TRUE ; par4 = Inbreng in contanten tijdens oprichting venn. ; par5 = Inbreng in contanten bij kapitaalsverhoging ; | |||||||||||||||||||||
| Parameters (R input): | |||||||||||||||||||||
| par1 = grey ; par2 = grey ; par3 = TRUE ; par4 = Inbreng in contanten tijdens oprichting venn. ; par5 = Inbreng in contanten bij kapitaalsverhoging ; | |||||||||||||||||||||
| R code (references can be found in the software module): | |||||||||||||||||||||
if (par3 == 'TRUE') par3 <- TRUE | |||||||||||||||||||||