Free Statistics

of Irreproducible Research!

Author's title

Author*The author of this computation has been verified*
R Software Modulerwasp_centraltendency.wasp
Title produced by softwareCentral Tendency
Date of computationSun, 19 Oct 2008 18:29:52 -0600
Cite this page as followsStatistical Computations at FreeStatistics.org, Office for Research Development and Education, URL https://freestatistics.org/blog/index.php?v=date/2008/Oct/20/t12244626545qe317i6wx510qc.htm/, Retrieved Fri, 17 May 2024 06:22:44 +0000
Statistical Computations at FreeStatistics.org, Office for Research Development and Education, URL https://freestatistics.org/blog/index.php?pk=17133, Retrieved Fri, 17 May 2024 06:22:44 +0000
QR Codes:

Original text written by user:
IsPrivate?No (this computation is public)
User-defined keywords
Estimated Impact190
Family? (F = Feedback message, R = changed R code, M = changed R Module, P = changed Parameters, D = changed Data)
-       [Central Tendency] [Central Tendency ...] [2008-10-20 00:29:52] [0831954c833179c36e9320daee0825b5] [Current]
F   PD    [Central Tendency] [uitvoer van Vlaan...] [2008-10-20 15:29:35] [077ffec662d24c06be4c491541a44245]
- RM D      [Pearson Correlation] [uitvoer correlati...] [2008-10-20 15:43:05] [077ffec662d24c06be4c491541a44245]
- RM D      [Pearson Correlation] [uitvoer correlati...] [2008-10-20 15:49:15] [077ffec662d24c06be4c491541a44245]
- RM D      [Pearson Correlation] [uitvoer correlati...] [2008-10-20 15:54:34] [077ffec662d24c06be4c491541a44245]
Feedback Forum

Post a new message
Dataseries X:
12055
12113
9617
12646
13581
12162
10970
11880
11888
12927
12300
12093
12381
12197
9455
13168
13428
11981
11885
11692
12234
14341
13131
12421
14286
12865
11160
14316
14389
14014
13419
12770
13316
15333
14243
13824
14963
13203
12199
15509
14200
15170
14058
13786
14148
16542
13588
15582
15803
14131
12923
15612
16034
16037
14038
15331
15038
17402
14993
16044
16930
15921
14417
15961
17852
16484
14216
17430
17840
17629


Summary of computational transaction
Raw Inputview raw input (R code)
Raw Outputview raw output of R engine
Computing time3 seconds
R Server'Herman Ole Andreas Wold' @ 193.190.124.10:1001

\begin{tabular}{lllllllll}
\hline
Summary of computational transaction \tabularnewline
Raw Input & view raw input (R code)  \tabularnewline
Raw Output & view raw output of R engine  \tabularnewline
Computing time & 3 seconds \tabularnewline
R Server & 'Herman Ole Andreas Wold' @ 193.190.124.10:1001 \tabularnewline
\hline
\end{tabular}
%Source: https://freestatistics.org/blog/index.php?pk=17133&T=0

[TABLE]
[ROW][C]Summary of computational transaction[/C][/ROW]
[ROW][C]Raw Input[/C][C]view raw input (R code) [/C][/ROW]
[ROW][C]Raw Output[/C][C]view raw output of R engine [/C][/ROW]
[ROW][C]Computing time[/C][C]3 seconds[/C][/ROW]
[ROW][C]R Server[/C][C]'Herman Ole Andreas Wold' @ 193.190.124.10:1001[/C][/ROW]
[/TABLE]
Source: https://freestatistics.org/blog/index.php?pk=17133&T=0

Globally Unique Identifier (entire table): ba.freestatistics.org/blog/index.php?pk=17133&T=0

As an alternative you can also use a QR Code:  

The GUIDs for individual cells are displayed in the table below:

Summary of computational transaction
Raw Inputview raw input (R code)
Raw Outputview raw output of R engine
Computing time3 seconds
R Server'Herman Ole Andreas Wold' @ 193.190.124.10:1001


Central Tendency - Ungrouped Data
MeasureValueS.E.Value/S.E.
Arithmetic Mean13964.2142857143227.08626510268061.4929937722134
Geometric Mean13835.3086755969
Harmonic Mean13704.4579260849
Quadratic Mean14091.0427034847
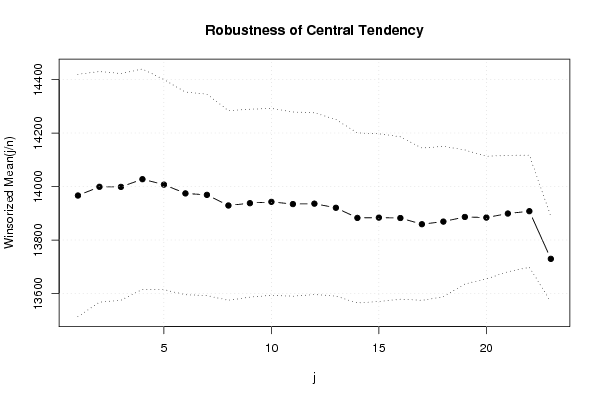
Winsorized Mean ( 1 / 23 )13966.3571428571226.38853539631461.6919806403084
Winsorized Mean ( 2 / 23 )13998.9857142857215.55153629783064.9449591254276
Winsorized Mean ( 3 / 23 )13998.6211.88961382570266.065531704235
Winsorized Mean ( 4 / 23 )14027.4206.05782862356968.0750646248223
Winsorized Mean ( 5 / 23 )14007.1142857143196.25064417386671.3735964774968
Winsorized Mean ( 6 / 23 )13974.2857142857189.31911030055273.8133920664477
Winsorized Mean ( 7 / 23 )13968.7857142857188.13913499621874.2471028931143
Winsorized Mean ( 8 / 23 )13929.1285714286177.20447059289278.6048372528323
Winsorized Mean ( 9 / 23 )13937.7428571429175.55120490255579.3941737106243
Winsorized Mean ( 10 / 23 )13942.7428571429174.6383244975779.8378185158142
Winsorized Mean ( 11 / 23 )13934.4142857143172.18224671550480.9282870419157
Winsorized Mean ( 12 / 23 )13935.9571428571169.73614090792982.1036525769516
Winsorized Mean ( 13 / 23 )13920.5428571429165.08352824686284.3242387958078
Winsorized Mean ( 14 / 23 )13882.7428571429158.8498981397687.395352592096
Winsorized Mean ( 15 / 23 )13883.8142857143156.68956569294088.6071400116199
Winsorized Mean ( 16 / 23 )13882.2142857143151.79242104291491.4552531037739
Winsorized Mean ( 17 / 23 )13859.1428571429142.29449281541497.3976053670683
Winsorized Mean ( 18 / 23 )13868.9142857143140.67571734474498.5878341158672
Winsorized Mean ( 19 / 23 )13886.2857142857125.185236071893110.925905881672
Winsorized Mean ( 20 / 23 )13884114.586658374493121.165938486697
Winsorized Mean ( 21 / 23 )13899108.641883264107127.934085662080
Winsorized Mean ( 22 / 23 )13907.8104.766637254297132.750275894052
Winsorized Mean ( 23 / 23 )13729.714285714380.0720771135243171.466943042437
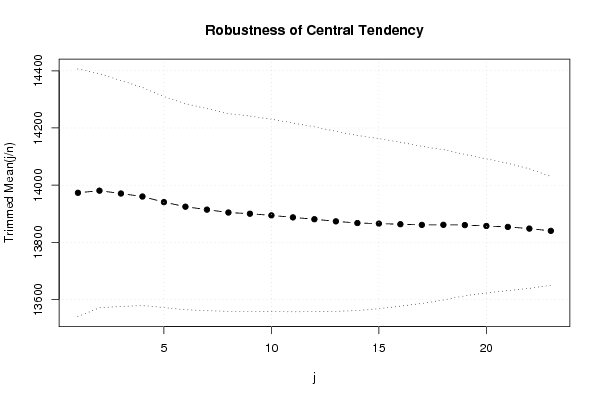
Trimmed Mean ( 1 / 23 )13973.3529411765216.53584982673664.5313602914132
Trimmed Mean ( 2 / 23 )13980.7727272727204.65918886682068.3124603624351
Trimmed Mean ( 3 / 23 )13970.8125197.52161810935070.7305490595244
Trimmed Mean ( 4 / 23 )13960.3548387097190.62798484875173.2335016277184
Trimmed Mean ( 5 / 23 )13940.8184.43753830693875.5854807430793
Trimmed Mean ( 6 / 23 )13924.7931034483180.09192510317877.3204745047312
Trimmed Mean ( 7 / 23 )13914.4821428571176.73752640838878.7296417779716
Trimmed Mean ( 8 / 23 )13904.4259259259172.83434789189780.4494366746057
Trimmed Mean ( 9 / 23 )13900.2692307692170.63296703289881.4629756047628
Trimmed Mean ( 10 / 23 )13894.44168.11349460821982.6491652700478
Trimmed Mean ( 11 / 23 )13887.3958333333164.99647465496684.1678336605319
Trimmed Mean ( 12 / 23 )13880.8913043478161.46478423806385.9685371633847
Trimmed Mean ( 13 / 23 )13873.5909090909157.35616042689288.1668113371172
Trimmed Mean ( 14 / 23 )13867.5714285714153.00444507391890.635088554923
Trimmed Mean ( 15 / 23 )13865.675148.68081190970293.2579989435422
Trimmed Mean ( 16 / 23 )13863.4473684211143.31229860777996.7359221999704
Trimmed Mean ( 17 / 23 )13861.1666666667137.219014485996101.014911953629
Trimmed Mean ( 18 / 23 )13861.4117647059131.383099850350105.503765556563
Trimmed Mean ( 19 / 23 )13860.5123.510978028467112.220793821303
Trimmed Mean ( 20 / 23 )13857.3333333333117.163902617779118.273060419810
Trimmed Mean ( 21 / 23 )13854111.306823666427124.466762626511
Trimmed Mean ( 22 / 23 )13848.2307692308104.439416486192132.595826701709
Trimmed Mean ( 23 / 23 )13840.333333333395.0750593384646145.572702553486
Median14026
Midrange13653.5
Midmean - Weighted Average at Xnp13819.1142857143
Midmean - Weighted Average at X(n+1)p13861.1666666667
Midmean - Empirical Distribution Function13861.1666666667
Midmean - Empirical Distribution Function - Averaging13861.1666666667
Midmean - Empirical Distribution Function - Interpolation13861.4117647059
Midmean - Closest Observation13861.1666666667
Midmean - True Basic - Statistics Graphics Toolkit13861.1666666667
Midmean - MS Excel (old versions)13861.1666666667
Number of observations70

\begin{tabular}{lllllllll}
\hline
Central Tendency - Ungrouped Data \tabularnewline
Measure & Value & S.E. & Value/S.E. \tabularnewline
Arithmetic Mean & 13964.2142857143 & 227.086265102680 & 61.4929937722134 \tabularnewline
Geometric Mean & 13835.3086755969 &  &  \tabularnewline
Harmonic Mean & 13704.4579260849 &  &  \tabularnewline
Quadratic Mean & 14091.0427034847 &  &  \tabularnewline
Winsorized Mean ( 1 / 23 ) & 13966.3571428571 & 226.388535396314 & 61.6919806403084 \tabularnewline
Winsorized Mean ( 2 / 23 ) & 13998.9857142857 & 215.551536297830 & 64.9449591254276 \tabularnewline
Winsorized Mean ( 3 / 23 ) & 13998.6 & 211.889613825702 & 66.065531704235 \tabularnewline
Winsorized Mean ( 4 / 23 ) & 14027.4 & 206.057828623569 & 68.0750646248223 \tabularnewline
Winsorized Mean ( 5 / 23 ) & 14007.1142857143 & 196.250644173866 & 71.3735964774968 \tabularnewline
Winsorized Mean ( 6 / 23 ) & 13974.2857142857 & 189.319110300552 & 73.8133920664477 \tabularnewline
Winsorized Mean ( 7 / 23 ) & 13968.7857142857 & 188.139134996218 & 74.2471028931143 \tabularnewline
Winsorized Mean ( 8 / 23 ) & 13929.1285714286 & 177.204470592892 & 78.6048372528323 \tabularnewline
Winsorized Mean ( 9 / 23 ) & 13937.7428571429 & 175.551204902555 & 79.3941737106243 \tabularnewline
Winsorized Mean ( 10 / 23 ) & 13942.7428571429 & 174.63832449757 & 79.8378185158142 \tabularnewline
Winsorized Mean ( 11 / 23 ) & 13934.4142857143 & 172.182246715504 & 80.9282870419157 \tabularnewline
Winsorized Mean ( 12 / 23 ) & 13935.9571428571 & 169.736140907929 & 82.1036525769516 \tabularnewline
Winsorized Mean ( 13 / 23 ) & 13920.5428571429 & 165.083528246862 & 84.3242387958078 \tabularnewline
Winsorized Mean ( 14 / 23 ) & 13882.7428571429 & 158.84989813976 & 87.395352592096 \tabularnewline
Winsorized Mean ( 15 / 23 ) & 13883.8142857143 & 156.689565692940 & 88.6071400116199 \tabularnewline
Winsorized Mean ( 16 / 23 ) & 13882.2142857143 & 151.792421042914 & 91.4552531037739 \tabularnewline
Winsorized Mean ( 17 / 23 ) & 13859.1428571429 & 142.294492815414 & 97.3976053670683 \tabularnewline
Winsorized Mean ( 18 / 23 ) & 13868.9142857143 & 140.675717344744 & 98.5878341158672 \tabularnewline
Winsorized Mean ( 19 / 23 ) & 13886.2857142857 & 125.185236071893 & 110.925905881672 \tabularnewline
Winsorized Mean ( 20 / 23 ) & 13884 & 114.586658374493 & 121.165938486697 \tabularnewline
Winsorized Mean ( 21 / 23 ) & 13899 & 108.641883264107 & 127.934085662080 \tabularnewline
Winsorized Mean ( 22 / 23 ) & 13907.8 & 104.766637254297 & 132.750275894052 \tabularnewline
Winsorized Mean ( 23 / 23 ) & 13729.7142857143 & 80.0720771135243 & 171.466943042437 \tabularnewline
Trimmed Mean ( 1 / 23 ) & 13973.3529411765 & 216.535849826736 & 64.5313602914132 \tabularnewline
Trimmed Mean ( 2 / 23 ) & 13980.7727272727 & 204.659188866820 & 68.3124603624351 \tabularnewline
Trimmed Mean ( 3 / 23 ) & 13970.8125 & 197.521618109350 & 70.7305490595244 \tabularnewline
Trimmed Mean ( 4 / 23 ) & 13960.3548387097 & 190.627984848751 & 73.2335016277184 \tabularnewline
Trimmed Mean ( 5 / 23 ) & 13940.8 & 184.437538306938 & 75.5854807430793 \tabularnewline
Trimmed Mean ( 6 / 23 ) & 13924.7931034483 & 180.091925103178 & 77.3204745047312 \tabularnewline
Trimmed Mean ( 7 / 23 ) & 13914.4821428571 & 176.737526408388 & 78.7296417779716 \tabularnewline
Trimmed Mean ( 8 / 23 ) & 13904.4259259259 & 172.834347891897 & 80.4494366746057 \tabularnewline
Trimmed Mean ( 9 / 23 ) & 13900.2692307692 & 170.632967032898 & 81.4629756047628 \tabularnewline
Trimmed Mean ( 10 / 23 ) & 13894.44 & 168.113494608219 & 82.6491652700478 \tabularnewline
Trimmed Mean ( 11 / 23 ) & 13887.3958333333 & 164.996474654966 & 84.1678336605319 \tabularnewline
Trimmed Mean ( 12 / 23 ) & 13880.8913043478 & 161.464784238063 & 85.9685371633847 \tabularnewline
Trimmed Mean ( 13 / 23 ) & 13873.5909090909 & 157.356160426892 & 88.1668113371172 \tabularnewline
Trimmed Mean ( 14 / 23 ) & 13867.5714285714 & 153.004445073918 & 90.635088554923 \tabularnewline
Trimmed Mean ( 15 / 23 ) & 13865.675 & 148.680811909702 & 93.2579989435422 \tabularnewline
Trimmed Mean ( 16 / 23 ) & 13863.4473684211 & 143.312298607779 & 96.7359221999704 \tabularnewline
Trimmed Mean ( 17 / 23 ) & 13861.1666666667 & 137.219014485996 & 101.014911953629 \tabularnewline
Trimmed Mean ( 18 / 23 ) & 13861.4117647059 & 131.383099850350 & 105.503765556563 \tabularnewline
Trimmed Mean ( 19 / 23 ) & 13860.5 & 123.510978028467 & 112.220793821303 \tabularnewline
Trimmed Mean ( 20 / 23 ) & 13857.3333333333 & 117.163902617779 & 118.273060419810 \tabularnewline
Trimmed Mean ( 21 / 23 ) & 13854 & 111.306823666427 & 124.466762626511 \tabularnewline
Trimmed Mean ( 22 / 23 ) & 13848.2307692308 & 104.439416486192 & 132.595826701709 \tabularnewline
Trimmed Mean ( 23 / 23 ) & 13840.3333333333 & 95.0750593384646 & 145.572702553486 \tabularnewline
Median & 14026 &  &  \tabularnewline
Midrange & 13653.5 &  &  \tabularnewline
Midmean - Weighted Average at Xnp & 13819.1142857143 &  &  \tabularnewline
Midmean - Weighted Average at X(n+1)p & 13861.1666666667 &  &  \tabularnewline
Midmean - Empirical Distribution Function & 13861.1666666667 &  &  \tabularnewline
Midmean - Empirical Distribution Function - Averaging & 13861.1666666667 &  &  \tabularnewline
Midmean - Empirical Distribution Function - Interpolation & 13861.4117647059 &  &  \tabularnewline
Midmean - Closest Observation & 13861.1666666667 &  &  \tabularnewline
Midmean - True Basic - Statistics Graphics Toolkit & 13861.1666666667 &  &  \tabularnewline
Midmean - MS Excel (old versions) & 13861.1666666667 &  &  \tabularnewline
Number of observations & 70 &  &  \tabularnewline
\hline
\end{tabular}
%Source: https://freestatistics.org/blog/index.php?pk=17133&T=1

[TABLE]
[ROW][C]Central Tendency - Ungrouped Data[/C][/ROW]
[ROW][C]Measure[/C][C]Value[/C][C]S.E.[/C][C]Value/S.E.[/C][/ROW]
[ROW][C]Arithmetic Mean[/C][C]13964.2142857143[/C][C]227.086265102680[/C][C]61.4929937722134[/C][/ROW]
[ROW][C]Geometric Mean[/C][C]13835.3086755969[/C][C][/C][C][/C][/ROW]
[ROW][C]Harmonic Mean[/C][C]13704.4579260849[/C][C][/C][C][/C][/ROW]
[ROW][C]Quadratic Mean[/C][C]14091.0427034847[/C][C][/C][C][/C][/ROW]
[ROW][C]Winsorized Mean ( 1 / 23 )[/C][C]13966.3571428571[/C][C]226.388535396314[/C][C]61.6919806403084[/C][/ROW]
[ROW][C]Winsorized Mean ( 2 / 23 )[/C][C]13998.9857142857[/C][C]215.551536297830[/C][C]64.9449591254276[/C][/ROW]
[ROW][C]Winsorized Mean ( 3 / 23 )[/C][C]13998.6[/C][C]211.889613825702[/C][C]66.065531704235[/C][/ROW]
[ROW][C]Winsorized Mean ( 4 / 23 )[/C][C]14027.4[/C][C]206.057828623569[/C][C]68.0750646248223[/C][/ROW]
[ROW][C]Winsorized Mean ( 5 / 23 )[/C][C]14007.1142857143[/C][C]196.250644173866[/C][C]71.3735964774968[/C][/ROW]
[ROW][C]Winsorized Mean ( 6 / 23 )[/C][C]13974.2857142857[/C][C]189.319110300552[/C][C]73.8133920664477[/C][/ROW]
[ROW][C]Winsorized Mean ( 7 / 23 )[/C][C]13968.7857142857[/C][C]188.139134996218[/C][C]74.2471028931143[/C][/ROW]
[ROW][C]Winsorized Mean ( 8 / 23 )[/C][C]13929.1285714286[/C][C]177.204470592892[/C][C]78.6048372528323[/C][/ROW]
[ROW][C]Winsorized Mean ( 9 / 23 )[/C][C]13937.7428571429[/C][C]175.551204902555[/C][C]79.3941737106243[/C][/ROW]
[ROW][C]Winsorized Mean ( 10 / 23 )[/C][C]13942.7428571429[/C][C]174.63832449757[/C][C]79.8378185158142[/C][/ROW]
[ROW][C]Winsorized Mean ( 11 / 23 )[/C][C]13934.4142857143[/C][C]172.182246715504[/C][C]80.9282870419157[/C][/ROW]
[ROW][C]Winsorized Mean ( 12 / 23 )[/C][C]13935.9571428571[/C][C]169.736140907929[/C][C]82.1036525769516[/C][/ROW]
[ROW][C]Winsorized Mean ( 13 / 23 )[/C][C]13920.5428571429[/C][C]165.083528246862[/C][C]84.3242387958078[/C][/ROW]
[ROW][C]Winsorized Mean ( 14 / 23 )[/C][C]13882.7428571429[/C][C]158.84989813976[/C][C]87.395352592096[/C][/ROW]
[ROW][C]Winsorized Mean ( 15 / 23 )[/C][C]13883.8142857143[/C][C]156.689565692940[/C][C]88.6071400116199[/C][/ROW]
[ROW][C]Winsorized Mean ( 16 / 23 )[/C][C]13882.2142857143[/C][C]151.792421042914[/C][C]91.4552531037739[/C][/ROW]
[ROW][C]Winsorized Mean ( 17 / 23 )[/C][C]13859.1428571429[/C][C]142.294492815414[/C][C]97.3976053670683[/C][/ROW]
[ROW][C]Winsorized Mean ( 18 / 23 )[/C][C]13868.9142857143[/C][C]140.675717344744[/C][C]98.5878341158672[/C][/ROW]
[ROW][C]Winsorized Mean ( 19 / 23 )[/C][C]13886.2857142857[/C][C]125.185236071893[/C][C]110.925905881672[/C][/ROW]
[ROW][C]Winsorized Mean ( 20 / 23 )[/C][C]13884[/C][C]114.586658374493[/C][C]121.165938486697[/C][/ROW]
[ROW][C]Winsorized Mean ( 21 / 23 )[/C][C]13899[/C][C]108.641883264107[/C][C]127.934085662080[/C][/ROW]
[ROW][C]Winsorized Mean ( 22 / 23 )[/C][C]13907.8[/C][C]104.766637254297[/C][C]132.750275894052[/C][/ROW]
[ROW][C]Winsorized Mean ( 23 / 23 )[/C][C]13729.7142857143[/C][C]80.0720771135243[/C][C]171.466943042437[/C][/ROW]
[ROW][C]Trimmed Mean ( 1 / 23 )[/C][C]13973.3529411765[/C][C]216.535849826736[/C][C]64.5313602914132[/C][/ROW]
[ROW][C]Trimmed Mean ( 2 / 23 )[/C][C]13980.7727272727[/C][C]204.659188866820[/C][C]68.3124603624351[/C][/ROW]
[ROW][C]Trimmed Mean ( 3 / 23 )[/C][C]13970.8125[/C][C]197.521618109350[/C][C]70.7305490595244[/C][/ROW]
[ROW][C]Trimmed Mean ( 4 / 23 )[/C][C]13960.3548387097[/C][C]190.627984848751[/C][C]73.2335016277184[/C][/ROW]
[ROW][C]Trimmed Mean ( 5 / 23 )[/C][C]13940.8[/C][C]184.437538306938[/C][C]75.5854807430793[/C][/ROW]
[ROW][C]Trimmed Mean ( 6 / 23 )[/C][C]13924.7931034483[/C][C]180.091925103178[/C][C]77.3204745047312[/C][/ROW]
[ROW][C]Trimmed Mean ( 7 / 23 )[/C][C]13914.4821428571[/C][C]176.737526408388[/C][C]78.7296417779716[/C][/ROW]
[ROW][C]Trimmed Mean ( 8 / 23 )[/C][C]13904.4259259259[/C][C]172.834347891897[/C][C]80.4494366746057[/C][/ROW]
[ROW][C]Trimmed Mean ( 9 / 23 )[/C][C]13900.2692307692[/C][C]170.632967032898[/C][C]81.4629756047628[/C][/ROW]
[ROW][C]Trimmed Mean ( 10 / 23 )[/C][C]13894.44[/C][C]168.113494608219[/C][C]82.6491652700478[/C][/ROW]
[ROW][C]Trimmed Mean ( 11 / 23 )[/C][C]13887.3958333333[/C][C]164.996474654966[/C][C]84.1678336605319[/C][/ROW]
[ROW][C]Trimmed Mean ( 12 / 23 )[/C][C]13880.8913043478[/C][C]161.464784238063[/C][C]85.9685371633847[/C][/ROW]
[ROW][C]Trimmed Mean ( 13 / 23 )[/C][C]13873.5909090909[/C][C]157.356160426892[/C][C]88.1668113371172[/C][/ROW]
[ROW][C]Trimmed Mean ( 14 / 23 )[/C][C]13867.5714285714[/C][C]153.004445073918[/C][C]90.635088554923[/C][/ROW]
[ROW][C]Trimmed Mean ( 15 / 23 )[/C][C]13865.675[/C][C]148.680811909702[/C][C]93.2579989435422[/C][/ROW]
[ROW][C]Trimmed Mean ( 16 / 23 )[/C][C]13863.4473684211[/C][C]143.312298607779[/C][C]96.7359221999704[/C][/ROW]
[ROW][C]Trimmed Mean ( 17 / 23 )[/C][C]13861.1666666667[/C][C]137.219014485996[/C][C]101.014911953629[/C][/ROW]
[ROW][C]Trimmed Mean ( 18 / 23 )[/C][C]13861.4117647059[/C][C]131.383099850350[/C][C]105.503765556563[/C][/ROW]
[ROW][C]Trimmed Mean ( 19 / 23 )[/C][C]13860.5[/C][C]123.510978028467[/C][C]112.220793821303[/C][/ROW]
[ROW][C]Trimmed Mean ( 20 / 23 )[/C][C]13857.3333333333[/C][C]117.163902617779[/C][C]118.273060419810[/C][/ROW]
[ROW][C]Trimmed Mean ( 21 / 23 )[/C][C]13854[/C][C]111.306823666427[/C][C]124.466762626511[/C][/ROW]
[ROW][C]Trimmed Mean ( 22 / 23 )[/C][C]13848.2307692308[/C][C]104.439416486192[/C][C]132.595826701709[/C][/ROW]
[ROW][C]Trimmed Mean ( 23 / 23 )[/C][C]13840.3333333333[/C][C]95.0750593384646[/C][C]145.572702553486[/C][/ROW]
[ROW][C]Median[/C][C]14026[/C][C][/C][C][/C][/ROW]
[ROW][C]Midrange[/C][C]13653.5[/C][C][/C][C][/C][/ROW]
[ROW][C]Midmean - Weighted Average at Xnp[/C][C]13819.1142857143[/C][C][/C][C][/C][/ROW]
[ROW][C]Midmean - Weighted Average at X(n+1)p[/C][C]13861.1666666667[/C][C][/C][C][/C][/ROW]
[ROW][C]Midmean - Empirical Distribution Function[/C][C]13861.1666666667[/C][C][/C][C][/C][/ROW]
[ROW][C]Midmean - Empirical Distribution Function - Averaging[/C][C]13861.1666666667[/C][C][/C][C][/C][/ROW]
[ROW][C]Midmean - Empirical Distribution Function - Interpolation[/C][C]13861.4117647059[/C][C][/C][C][/C][/ROW]
[ROW][C]Midmean - Closest Observation[/C][C]13861.1666666667[/C][C][/C][C][/C][/ROW]
[ROW][C]Midmean - True Basic - Statistics Graphics Toolkit[/C][C]13861.1666666667[/C][C][/C][C][/C][/ROW]
[ROW][C]Midmean - MS Excel (old versions)[/C][C]13861.1666666667[/C][C][/C][C][/C][/ROW]
[ROW][C]Number of observations[/C][C]70[/C][C][/C][C][/C][/ROW]
[/TABLE]
Source: https://freestatistics.org/blog/index.php?pk=17133&T=1

Globally Unique Identifier (entire table): ba.freestatistics.org/blog/index.php?pk=17133&T=1

As an alternative you can also use a QR Code:  

The GUIDs for individual cells are displayed in the table below:

Central Tendency - Ungrouped Data
MeasureValueS.E.Value/S.E.
Arithmetic Mean13964.2142857143227.08626510268061.4929937722134
Geometric Mean13835.3086755969
Harmonic Mean13704.4579260849
Quadratic Mean14091.0427034847
Winsorized Mean ( 1 / 23 )13966.3571428571226.38853539631461.6919806403084
Winsorized Mean ( 2 / 23 )13998.9857142857215.55153629783064.9449591254276
Winsorized Mean ( 3 / 23 )13998.6211.88961382570266.065531704235
Winsorized Mean ( 4 / 23 )14027.4206.05782862356968.0750646248223
Winsorized Mean ( 5 / 23 )14007.1142857143196.25064417386671.3735964774968
Winsorized Mean ( 6 / 23 )13974.2857142857189.31911030055273.8133920664477
Winsorized Mean ( 7 / 23 )13968.7857142857188.13913499621874.2471028931143
Winsorized Mean ( 8 / 23 )13929.1285714286177.20447059289278.6048372528323
Winsorized Mean ( 9 / 23 )13937.7428571429175.55120490255579.3941737106243
Winsorized Mean ( 10 / 23 )13942.7428571429174.6383244975779.8378185158142
Winsorized Mean ( 11 / 23 )13934.4142857143172.18224671550480.9282870419157
Winsorized Mean ( 12 / 23 )13935.9571428571169.73614090792982.1036525769516
Winsorized Mean ( 13 / 23 )13920.5428571429165.08352824686284.3242387958078
Winsorized Mean ( 14 / 23 )13882.7428571429158.8498981397687.395352592096
Winsorized Mean ( 15 / 23 )13883.8142857143156.68956569294088.6071400116199
Winsorized Mean ( 16 / 23 )13882.2142857143151.79242104291491.4552531037739
Winsorized Mean ( 17 / 23 )13859.1428571429142.29449281541497.3976053670683
Winsorized Mean ( 18 / 23 )13868.9142857143140.67571734474498.5878341158672
Winsorized Mean ( 19 / 23 )13886.2857142857125.185236071893110.925905881672
Winsorized Mean ( 20 / 23 )13884114.586658374493121.165938486697
Winsorized Mean ( 21 / 23 )13899108.641883264107127.934085662080
Winsorized Mean ( 22 / 23 )13907.8104.766637254297132.750275894052
Winsorized Mean ( 23 / 23 )13729.714285714380.0720771135243171.466943042437
Trimmed Mean ( 1 / 23 )13973.3529411765216.53584982673664.5313602914132
Trimmed Mean ( 2 / 23 )13980.7727272727204.65918886682068.3124603624351
Trimmed Mean ( 3 / 23 )13970.8125197.52161810935070.7305490595244
Trimmed Mean ( 4 / 23 )13960.3548387097190.62798484875173.2335016277184
Trimmed Mean ( 5 / 23 )13940.8184.43753830693875.5854807430793
Trimmed Mean ( 6 / 23 )13924.7931034483180.09192510317877.3204745047312
Trimmed Mean ( 7 / 23 )13914.4821428571176.73752640838878.7296417779716
Trimmed Mean ( 8 / 23 )13904.4259259259172.83434789189780.4494366746057
Trimmed Mean ( 9 / 23 )13900.2692307692170.63296703289881.4629756047628
Trimmed Mean ( 10 / 23 )13894.44168.11349460821982.6491652700478
Trimmed Mean ( 11 / 23 )13887.3958333333164.99647465496684.1678336605319
Trimmed Mean ( 12 / 23 )13880.8913043478161.46478423806385.9685371633847
Trimmed Mean ( 13 / 23 )13873.5909090909157.35616042689288.1668113371172
Trimmed Mean ( 14 / 23 )13867.5714285714153.00444507391890.635088554923
Trimmed Mean ( 15 / 23 )13865.675148.68081190970293.2579989435422
Trimmed Mean ( 16 / 23 )13863.4473684211143.31229860777996.7359221999704
Trimmed Mean ( 17 / 23 )13861.1666666667137.219014485996101.014911953629
Trimmed Mean ( 18 / 23 )13861.4117647059131.383099850350105.503765556563
Trimmed Mean ( 19 / 23 )13860.5123.510978028467112.220793821303
Trimmed Mean ( 20 / 23 )13857.3333333333117.163902617779118.273060419810
Trimmed Mean ( 21 / 23 )13854111.306823666427124.466762626511
Trimmed Mean ( 22 / 23 )13848.2307692308104.439416486192132.595826701709
Trimmed Mean ( 23 / 23 )13840.333333333395.0750593384646145.572702553486
Median14026
Midrange13653.5
Midmean - Weighted Average at Xnp13819.1142857143
Midmean - Weighted Average at X(n+1)p13861.1666666667
Midmean - Empirical Distribution Function13861.1666666667
Midmean - Empirical Distribution Function - Averaging13861.1666666667
Midmean - Empirical Distribution Function - Interpolation13861.4117647059
Midmean - Closest Observation13861.1666666667
Midmean - True Basic - Statistics Graphics Toolkit13861.1666666667
Midmean - MS Excel (old versions)13861.1666666667
Number of observations70


Parameters (Session):
par1 = grey ; par2 = grey ; par3 = TRUE ; par4 = Totaal ; par5 = Waals Gewest ;
Parameters (R input):
R code (references can be found in the software module):
geomean <- function(x) {
return(exp(mean(log(x))))
}
harmean <- function(x) {
return(1/mean(1/x))
}
quamean <- function(x) {
return(sqrt(mean(x*x)))
}
winmean <- function(x) {
x <-sort(x[!is.na(x)])
n<-length(x)
denom <- 3
nodenom <- n/denom
if (nodenom>40) denom <- n/40
sqrtn = sqrt(n)
roundnodenom = floor(nodenom)
win <- array(NA,dim=c(roundnodenom,2))
for (j in 1:roundnodenom) {
win[j,1] <- (j*x[j+1]+sum(x[(j+1):(n-j)])+j*x[n-j])/n
win[j,2] <- sd(c(rep(x[j+1],j),x[(j+1):(n-j)],rep(x[n-j],j)))/sqrtn
}
return(win)
}
trimean <- function(x) {
x <-sort(x[!is.na(x)])
n<-length(x)
denom <- 3
nodenom <- n/denom
if (nodenom>40) denom <- n/40
sqrtn = sqrt(n)
roundnodenom = floor(nodenom)
tri <- array(NA,dim=c(roundnodenom,2))
for (j in 1:roundnodenom) {
tri[j,1] <- mean(x,trim=j/n)
tri[j,2] <- sd(x[(j+1):(n-j)]) / sqrt(n-j*2)
}
return(tri)
}
midrange <- function(x) {
return((max(x)+min(x))/2)
}
q1 <- function(data,n,p,i,f) {
np <- n*p;
i <<- floor(np)
f <<- np - i
qvalue <- (1-f)*data[i] + f*data[i+1]
}
q2 <- function(data,n,p,i,f) {
np <- (n+1)*p
i <<- floor(np)
f <<- np - i
qvalue <- (1-f)*data[i] + f*data[i+1]
}
q3 <- function(data,n,p,i,f) {
np <- n*p
i <<- floor(np)
f <<- np - i
if (f==0) {
qvalue <- data[i]
} else {
qvalue <- data[i+1]
}
}
q4 <- function(data,n,p,i,f) {
np <- n*p
i <<- floor(np)
f <<- np - i
if (f==0) {
qvalue <- (data[i]+data[i+1])/2
} else {
qvalue <- data[i+1]
}
}
q5 <- function(data,n,p,i,f) {
np <- (n-1)*p
i <<- floor(np)
f <<- np - i
if (f==0) {
qvalue <- data[i+1]
} else {
qvalue <- data[i+1] + f*(data[i+2]-data[i+1])
}
}
q6 <- function(data,n,p,i,f) {
np <- n*p+0.5
i <<- floor(np)
f <<- np - i
qvalue <- data[i]
}
q7 <- function(data,n,p,i,f) {
np <- (n+1)*p
i <<- floor(np)
f <<- np - i
if (f==0) {
qvalue <- data[i]
} else {
qvalue <- f*data[i] + (1-f)*data[i+1]
}
}
q8 <- function(data,n,p,i,f) {
np <- (n+1)*p
i <<- floor(np)
f <<- np - i
if (f==0) {
qvalue <- data[i]
} else {
if (f == 0.5) {
qvalue <- (data[i]+data[i+1])/2
} else {
if (f < 0.5) {
qvalue <- data[i]
} else {
qvalue <- data[i+1]
}
}
}
}
midmean <- function(x,def) {
x <-sort(x[!is.na(x)])
n<-length(x)
if (def==1) {
qvalue1 <- q1(x,n,0.25,i,f)
qvalue3 <- q1(x,n,0.75,i,f)
}
if (def==2) {
qvalue1 <- q2(x,n,0.25,i,f)
qvalue3 <- q2(x,n,0.75,i,f)
}
if (def==3) {
qvalue1 <- q3(x,n,0.25,i,f)
qvalue3 <- q3(x,n,0.75,i,f)
}
if (def==4) {
qvalue1 <- q4(x,n,0.25,i,f)
qvalue3 <- q4(x,n,0.75,i,f)
}
if (def==5) {
qvalue1 <- q5(x,n,0.25,i,f)
qvalue3 <- q5(x,n,0.75,i,f)
}
if (def==6) {
qvalue1 <- q6(x,n,0.25,i,f)
qvalue3 <- q6(x,n,0.75,i,f)
}
if (def==7) {
qvalue1 <- q7(x,n,0.25,i,f)
qvalue3 <- q7(x,n,0.75,i,f)
}
if (def==8) {
qvalue1 <- q8(x,n,0.25,i,f)
qvalue3 <- q8(x,n,0.75,i,f)
}
midm <- 0
myn <- 0
roundno4 <- round(n/4)
round3no4 <- round(3*n/4)
for (i in 1:n) {
if ((x[i]>=qvalue1) & (x[i]<=qvalue3)){
midm = midm + x[i]
myn = myn + 1
}
}
midm = midm / myn
return(midm)
}
(arm <- mean(x))
sqrtn <- sqrt(length(x))
(armse <- sd(x) / sqrtn)
(armose <- arm / armse)
(geo <- geomean(x))
(har <- harmean(x))
(qua <- quamean(x))
(win <- winmean(x))
(tri <- trimean(x))
(midr <- midrange(x))
midm <- array(NA,dim=8)
for (j in 1:8) midm[j] <- midmean(x,j)
midm
bitmap(file='test1.png')
lb <- win[,1] - 2*win[,2]
ub <- win[,1] + 2*win[,2]
if ((ylimmin == '') | (ylimmax == '')) plot(win[,1],type='b',main=main, xlab='j', pch=19, ylab='Winsorized Mean(j/n)', ylim=c(min(lb),max(ub))) else plot(win[,1],type='l',main=main, xlab='j', pch=19, ylab='Winsorized Mean(j/n)', ylim=c(ylimmin,ylimmax))
lines(ub,lty=3)
lines(lb,lty=3)
grid()
dev.off()
bitmap(file='test2.png')
lb <- tri[,1] - 2*tri[,2]
ub <- tri[,1] + 2*tri[,2]
if ((ylimmin == '') | (ylimmax == '')) plot(tri[,1],type='b',main=main, xlab='j', pch=19, ylab='Trimmed Mean(j/n)', ylim=c(min(lb),max(ub))) else plot(tri[,1],type='l',main=main, xlab='j', pch=19, ylab='Trimmed Mean(j/n)', ylim=c(ylimmin,ylimmax))
lines(ub,lty=3)
lines(lb,lty=3)
grid()
dev.off()
load(file='createtable')
a<-table.start()
a<-table.row.start(a)
a<-table.element(a,'Central Tendency - Ungrouped Data',4,TRUE)
a<-table.row.end(a)
a<-table.row.start(a)
a<-table.element(a,'Measure',header=TRUE)
a<-table.element(a,'Value',header=TRUE)
a<-table.element(a,'S.E.',header=TRUE)
a<-table.element(a,'Value/S.E.',header=TRUE)
a<-table.row.end(a)
a<-table.row.start(a)
a<-table.element(a,hyperlink('arithmetic_mean.htm', 'Arithmetic Mean', 'click to view the definition of the Arithmetic Mean'),header=TRUE)
a<-table.element(a,arm)
a<-table.element(a,hyperlink('arithmetic_mean_standard_error.htm', armse, 'click to view the definition of the Standard Error of the Arithmetic Mean'))
a<-table.element(a,armose)
a<-table.row.end(a)
a<-table.row.start(a)
a<-table.element(a,hyperlink('geometric_mean.htm', 'Geometric Mean', 'click to view the definition of the Geometric Mean'),header=TRUE)
a<-table.element(a,geo)
a<-table.element(a,'')
a<-table.row.end(a)
a<-table.row.start(a)
a<-table.element(a,hyperlink('harmonic_mean.htm', 'Harmonic Mean', 'click to view the definition of the Harmonic Mean'),header=TRUE)
a<-table.element(a,har)
a<-table.element(a,'')
a<-table.row.end(a)
a<-table.row.start(a)
a<-table.element(a,hyperlink('quadratic_mean.htm', 'Quadratic Mean', 'click to view the definition of the Quadratic Mean'),header=TRUE)
a<-table.element(a,qua)
a<-table.element(a,'')
a<-table.row.end(a)
for (j in 1:length(win[,1])) {
a<-table.row.start(a)
mylabel <- paste('Winsorized Mean (',j)
mylabel <- paste(mylabel,'/')
mylabel <- paste(mylabel,length(win[,1]))
mylabel <- paste(mylabel,')')
a<-table.element(a,hyperlink('winsorized_mean.htm', mylabel, 'click to view the definition of the Winsorized Mean'),header=TRUE)
a<-table.element(a,win[j,1])
a<-table.element(a,win[j,2])
a<-table.element(a,win[j,1]/win[j,2])
a<-table.row.end(a)
}
for (j in 1:length(tri[,1])) {
a<-table.row.start(a)
mylabel <- paste('Trimmed Mean (',j)
mylabel <- paste(mylabel,'/')
mylabel <- paste(mylabel,length(tri[,1]))
mylabel <- paste(mylabel,')')
a<-table.element(a,hyperlink('arithmetic_mean.htm', mylabel, 'click to view the definition of the Trimmed Mean'),header=TRUE)
a<-table.element(a,tri[j,1])
a<-table.element(a,tri[j,2])
a<-table.element(a,tri[j,1]/tri[j,2])
a<-table.row.end(a)
}
a<-table.row.start(a)
a<-table.element(a,hyperlink('median_1.htm', 'Median', 'click to view the definition of the Median'),header=TRUE)
a<-table.element(a,median(x))
a<-table.element(a,'')
a<-table.row.end(a)
a<-table.row.start(a)
a<-table.element(a,hyperlink('midrange.htm', 'Midrange', 'click to view the definition of the Midrange'),header=TRUE)
a<-table.element(a,midr)
a<-table.element(a,'')
a<-table.row.end(a)
a<-table.row.start(a)
mymid <- hyperlink('midmean.htm', 'Midmean', 'click to view the definition of the Midmean')
mylabel <- paste(mymid,hyperlink('method_1.htm','Weighted Average at Xnp',''),sep=' - ')
a<-table.element(a,mylabel,header=TRUE)
a<-table.element(a,midm[1])
a<-table.element(a,'')
a<-table.row.end(a)
a<-table.row.start(a)
mymid <- hyperlink('midmean.htm', 'Midmean', 'click to view the definition of the Midmean')
mylabel <- paste(mymid,hyperlink('method_2.htm','Weighted Average at X(n+1)p',''),sep=' - ')
a<-table.element(a,mylabel,header=TRUE)
a<-table.element(a,midm[2])
a<-table.element(a,'')
a<-table.row.end(a)
a<-table.row.start(a)
mymid <- hyperlink('midmean.htm', 'Midmean', 'click to view the definition of the Midmean')
mylabel <- paste(mymid,hyperlink('method_3.htm','Empirical Distribution Function',''),sep=' - ')
a<-table.element(a,mylabel,header=TRUE)
a<-table.element(a,midm[3])
a<-table.element(a,'')
a<-table.row.end(a)
a<-table.row.start(a)
mymid <- hyperlink('midmean.htm', 'Midmean', 'click to view the definition of the Midmean')
mylabel <- paste(mymid,hyperlink('method_4.htm','Empirical Distribution Function - Averaging',''),sep=' - ')
a<-table.element(a,mylabel,header=TRUE)
a<-table.element(a,midm[4])
a<-table.element(a,'')
a<-table.row.end(a)
a<-table.row.start(a)
mymid <- hyperlink('midmean.htm', 'Midmean', 'click to view the definition of the Midmean')
mylabel <- paste(mymid,hyperlink('method_5.htm','Empirical Distribution Function - Interpolation',''),sep=' - ')
a<-table.element(a,mylabel,header=TRUE)
a<-table.element(a,midm[5])
a<-table.element(a,'')
a<-table.row.end(a)
a<-table.row.start(a)
mymid <- hyperlink('midmean.htm', 'Midmean', 'click to view the definition of the Midmean')
mylabel <- paste(mymid,hyperlink('method_6.htm','Closest Observation',''),sep=' - ')
a<-table.element(a,mylabel,header=TRUE)
a<-table.element(a,midm[6])
a<-table.element(a,'')
a<-table.row.end(a)
a<-table.row.start(a)
mymid <- hyperlink('midmean.htm', 'Midmean', 'click to view the definition of the Midmean')
mylabel <- paste(mymid,hyperlink('method_7.htm','True Basic - Statistics Graphics Toolkit',''),sep=' - ')
a<-table.element(a,mylabel,header=TRUE)
a<-table.element(a,midm[7])
a<-table.element(a,'')
a<-table.row.end(a)
a<-table.row.start(a)
mymid <- hyperlink('midmean.htm', 'Midmean', 'click to view the definition of the Midmean')
mylabel <- paste(mymid,hyperlink('method_8.htm','MS Excel (old versions)',''),sep=' - ')
a<-table.element(a,mylabel,header=TRUE)
a<-table.element(a,midm[8])
a<-table.element(a,'')
a<-table.row.end(a)
a<-table.row.start(a)
a<-table.element(a,'Number of observations',header=TRUE)
a<-table.element(a,length(x))
a<-table.element(a,'')
a<-table.row.end(a)
a<-table.end(a)
table.save(a,file='mytable.tab')