Free Statistics
of Irreproducible Research!
Description of Statistical Computation | |||||||||||||||||||||
|---|---|---|---|---|---|---|---|---|---|---|---|---|---|---|---|---|---|---|---|---|---|
| Author's title | |||||||||||||||||||||
| Author | *The author of this computation has been verified* | ||||||||||||||||||||
| R Software Module | rwasp_backtobackhist.wasp | ||||||||||||||||||||
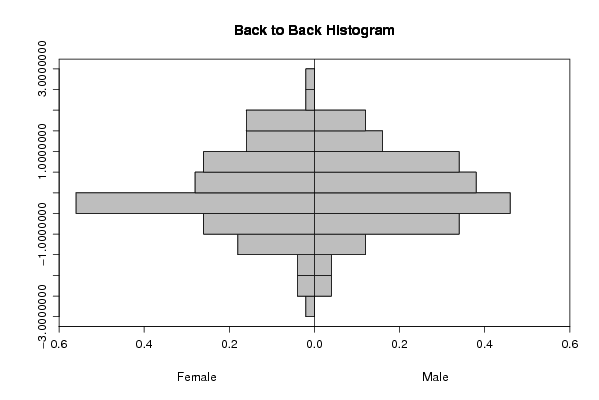
| Title produced by software | Back to Back Histogram | ||||||||||||||||||||
| Date of computation | Mon, 20 Oct 2008 08:54:18 -0600 | ||||||||||||||||||||
| Cite this page as follows | Statistical Computations at FreeStatistics.org, Office for Research Development and Education, URL https://freestatistics.org/blog/index.php?v=date/2008/Oct/20/t12245145254x0v4eh0bf4b08b.htm/, Retrieved Fri, 17 May 2024 23:18:48 +0000 | ||||||||||||||||||||
| Statistical Computations at FreeStatistics.org, Office for Research Development and Education, URL https://freestatistics.org/blog/index.php?pk=17408, Retrieved Fri, 17 May 2024 23:18:48 +0000 | |||||||||||||||||||||
| QR Codes: | |||||||||||||||||||||
|
| |||||||||||||||||||||
| Original text written by user: | |||||||||||||||||||||
| IsPrivate? | No (this computation is public) | ||||||||||||||||||||
| User-defined keywords | |||||||||||||||||||||
| Estimated Impact | 134 | ||||||||||||||||||||
Tree of Dependent Computations | |||||||||||||||||||||
| Family? (F = Feedback message, R = changed R code, M = changed R Module, P = changed Parameters, D = changed Data) | |||||||||||||||||||||
| F [Univariate Data Series] [werkloosheid mannen] [2008-10-13 15:39:35] [e43247bc0ab243a5af99ac7f55ba0b41] F PD [Univariate Data Series] [werkloosheid onde...] [2008-10-13 15:49:45] [e43247bc0ab243a5af99ac7f55ba0b41] F RMPD [Back to Back Histogram] [tijdreeks 3 back ...] [2008-10-20 14:54:18] [f24298b2e4c2a19d76cf4460ec5d2246] [Current] | |||||||||||||||||||||
| Feedback Forum | |||||||||||||||||||||
Post a new message | |||||||||||||||||||||
Dataset | |||||||||||||||||||||
| Dataseries X: | |||||||||||||||||||||
1.97629 -0.0361 0.07117 1.23355 0.28578 0.2158 1.37532 0.88658 0.01751 -1.63386 -0.10037 1.12964 -0.51118 -2.30805 0.27471 -0.62217 -0.11151 -0.1141 -1.18533 -0.17558 -0.52126 -0.2211 -0.55288 -0.43851 -0.56762 1.81772 0.59778 0.30372 1.71796 -0.89267 0.57353 -1.01236 -0.48203 0.51141 -0.55989 -0.48264 1.47293 1.59422 -0.73087 -0.03829 0.99176 -1.86628 -0.43733 0.93608 0.38318 -0.30173 -1.00425 0.8098 1.45966 -2.19123 -0.40534 1.94067 0.48497 -0.2021 -1.16963 -0.36985 0.75979 0.19779 -0.45474 -0.9206 -0.10771 -1.20366 2.67487 1.57247 0.67842 0.11641 -0.46631 1.84623 -1.2914 0.96074 0.23254 0.86255 1.41143 -0.01301 0.20226 -2.78601 -0.158 0.83164 2.18853 -1.14609 0.23125 0.02265 1.37913 -0.24625 -0.00513 -0.963 -0.01937 -1.15867 -0.15707 -0.60072 -0.164 -0.6838 1.66298 -0.57167 -0.03546 -0.39706 0.71473 1.26745 -0.35679 -1.02532 | |||||||||||||||||||||
| Dataseries Y: | |||||||||||||||||||||
0.65741 -0.23311 0.74568 0.54108 -0.83516 0.13481 -0.28442 0.46668 -1.10642 -0.10782 0.05024 0.31088 0.17889 -1.05978 -0.97363 -0.56134 -1.2829 1.98664 0.07118 -0.40209 -0.19577 -0.39322 -0.09014 -0.19331 -0.6323 -0.37168 -0.73259 -0.81329 0.58775 -0.53212 1.47014 0.12605 0.87762 -0.47746 -2.24293 0.01562 1.13217 -0.07541 -0.44371 0.26008 0.01334 -0.96388 1.65731 -0.22507 -1.51857 -1.33558 0.52953 1.39326 1.12663 -0.01136 0.94034 0.78786 0.08694 0.0328 1.55286 -2.40488 0.16733 -0.40313 -1.74584 -0.69384 -0.13967 -0.45824 0.984 0.68723 -1.1106 0.54159 0.78018 -1.19219 -0.24727 1.65407 0.50304 0.91005 1.75622 0.12704 0.26597 1.08004 0.00937 0.38422 -0.53297 -0.82255 -0.04665 -0.56281 0.78689 -0.64757 -0.78003 -0.90153 1.12854 -0.38383 -0.59328 -0.12503 -0.48269 1.67105 0.686 -0.72765 0.30209 0.25766 1.12498 -0.31011 0.82459 1.17489 | |||||||||||||||||||||
Tables (Output of Computation) | |||||||||||||||||||||
| |||||||||||||||||||||
Figures (Output of Computation) | |||||||||||||||||||||
Input Parameters & R Code | |||||||||||||||||||||
| Parameters (Session): | |||||||||||||||||||||
| par1 = grey ; par2 = grey ; par3 = TRUE ; par4 = Female ; par5 = Male ; | |||||||||||||||||||||
| Parameters (R input): | |||||||||||||||||||||
| par1 = grey ; par2 = grey ; par3 = TRUE ; par4 = Female ; par5 = Male ; | |||||||||||||||||||||
| R code (references can be found in the software module): | |||||||||||||||||||||
if (par3 == 'TRUE') par3 <- TRUE | |||||||||||||||||||||