Free Statistics

of Irreproducible Research!

Author's title

Author*The author of this computation has been verified*
R Software Modulerwasp_correlation.wasp
Title produced by softwarePearson Correlation
Date of computationMon, 20 Oct 2008 09:29:27 -0600
Cite this page as followsStatistical Computations at FreeStatistics.org, Office for Research Development and Education, URL https://freestatistics.org/blog/index.php?v=date/2008/Oct/20/t12245167911jamkmusdsli34i.htm/, Retrieved Fri, 17 May 2024 02:07:08 +0000
Statistical Computations at FreeStatistics.org, Office for Research Development and Education, URL https://freestatistics.org/blog/index.php?pk=17489, Retrieved Fri, 17 May 2024 02:07:08 +0000
QR Codes:

Original text written by user:
IsPrivate?No (this computation is public)
User-defined keywords
Estimated Impact118
Family? (F = Feedback message, R = changed R code, M = changed R Module, P = changed Parameters, D = changed Data)
F       [Pearson Correlation] [Investigating ass...] [2008-10-20 15:29:27] [708e5cce6cfef15b7edd0dea71956401] [Current]
Feedback Forum
2008-10-24 09:06:53 [Ellen Smolders] [reply
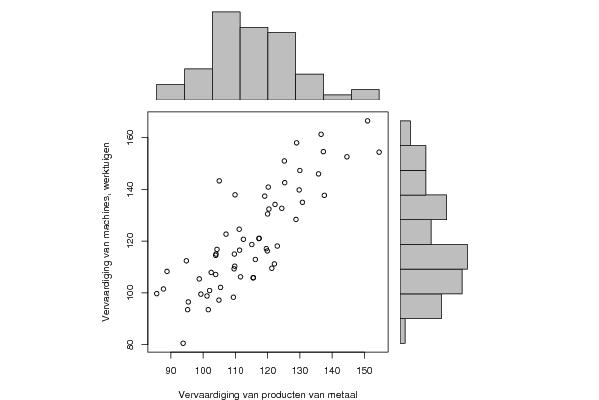
De student heeft een juist maar te beknopt antwoord gegeven. Beide datasets zijn gerelateerd, dit kunnen we afleiden uit de berekeningen. De correlatie bedraagt 0.8244, dit betekent een sterke positieve correlatie tussen beide datasets. Dit kunnen we ook vaststellen wanneer we de scater plot bekijken waar we een denkbeeldige stijgende rechte kunnen zien. Alle punten op de scater plot liggen zeer dicht bij deze rechte = sterk verband! De datasets bevatten niet veel outliers.
2008-10-26 10:16:01 [Ruben Jacobs] [reply
Dit klopt inderdaad. Daarnaast had je ook nog de andere verbanden tussen je andere tijdreeksen kunnen onderzoeken.
2008-10-26 14:28:07 [Kevin Neelen] [reply
Er is hier slechts 1 correlatie berekend wat met andere woorden wil zeggen dat er slechts 2 tijdreeksen inderzocht zijn geweest door de student die eventueel een lineair verband zouden kunnen vertonen. Dit is wel zeer weinig. Er zijn misschien nog meerdere verbanden tussen andere tijdreeksen die op het eerste zicht ogenschijnlijk niet aanwezig zijn. Het kan zijn dat de student deze berekenkingen wel degelijk heeft uitgevoerd, maar in het Word-docuement staat slechts deze ene link. De correlatie bedraagt hier 0,824 wat zeer diecht bij 1 ligt. Dit duidt op een sterk positief lineair verband tussen beide reeksen. Ook kunnen we zien dat de verschillende waarden in de scatter-plot bijna op 1 rechte liggen die naar rechtsboven gaat (wat dus ook duidt op een sterk positief lineair verband).

Post a new message
Dataseries X:
101.6
101.2
111.6
109.4
105.4
119.6
87.7
93.8
115.6
121.3
104.9
103.9
95.2
102
117.4
111.3
109.6
123
88.8
98.8
119.9
122.1
115.5
107.1
99.3
102.5
111.2
109.7
109.8
124.4
85.6
95.4
115.1
116.2
120
109.9
104
104.3
120.2
112.5
122.3
130
94.8
103.9
128.8
137.6
130.8
125.2
119.1
120.4
136.6
129.8
135.8
151
105
117.3
144.6
154.6
137.3
129
125.3
Dataseries Y:
93.5
98.8
106.2
98.3
102.1
117.1
101.5
80.5
105.9
109.5
97.2
114.5
93.5
100.9
121.1
116.5
109.3
118.1
108.3
105.4
116.2
111.2
105.8
122.7
99.5
107.9
124.6
115
110.3
132.7
99.7
96.5
118.7
112.9
130.5
137.9
115
116.8
140.9
120.7
134.2
147.3
112.4
107.1
128.4
137.7
135
151
137.4
132.4
161.3
139.8
146
166.5
143.3
121
152.6
154.4
154.6
158
142.6


Summary of computational transaction
Raw Inputview raw input (R code)
Raw Outputview raw output of R engine
Computing time1 seconds
R Server'George Udny Yule' @ 72.249.76.132

\begin{tabular}{lllllllll}
\hline
Summary of computational transaction \tabularnewline
Raw Input & view raw input (R code)  \tabularnewline
Raw Output & view raw output of R engine  \tabularnewline
Computing time & 1 seconds \tabularnewline
R Server & 'George Udny Yule' @ 72.249.76.132 \tabularnewline
\hline
\end{tabular}
%Source: https://freestatistics.org/blog/index.php?pk=17489&T=0

[TABLE]
[ROW][C]Summary of computational transaction[/C][/ROW]
[ROW][C]Raw Input[/C][C]view raw input (R code) [/C][/ROW]
[ROW][C]Raw Output[/C][C]view raw output of R engine [/C][/ROW]
[ROW][C]Computing time[/C][C]1 seconds[/C][/ROW]
[ROW][C]R Server[/C][C]'George Udny Yule' @ 72.249.76.132[/C][/ROW]
[/TABLE]
Source: https://freestatistics.org/blog/index.php?pk=17489&T=0

Globally Unique Identifier (entire table): ba.freestatistics.org/blog/index.php?pk=17489&T=0

As an alternative you can also use a QR Code:  

The GUIDs for individual cells are displayed in the table below:

Summary of computational transaction
Raw Inputview raw input (R code)
Raw Outputview raw output of R engine
Computing time1 seconds
R Server'George Udny Yule' @ 72.249.76.132


Pearson Product Moment Correlation - Ungrouped Data
StatisticVariable XVariable Y
Mean114.852459016393121.257377049180
Biased Variance222.107739854878385.569658693899
Biased Standard Deviation14.903279499991919.635927752309
Covariance245.299439890710
Correlation0.824488685204379
Determination0.679781592030046
T-Test11.1914809252909
p-value (2 sided)4.44089209850063e-16
p-value (1 sided)2.22044604925031e-16
Degrees of Freedom59
Number of Observations61

\begin{tabular}{lllllllll}
\hline
Pearson Product Moment Correlation - Ungrouped Data \tabularnewline
Statistic & Variable X & Variable Y \tabularnewline
Mean & 114.852459016393 & 121.257377049180 \tabularnewline
Biased Variance & 222.107739854878 & 385.569658693899 \tabularnewline
Biased Standard Deviation & 14.9032794999919 & 19.635927752309 \tabularnewline
Covariance & 245.299439890710 \tabularnewline
Correlation & 0.824488685204379 \tabularnewline
Determination & 0.679781592030046 \tabularnewline
T-Test & 11.1914809252909 \tabularnewline
p-value (2 sided) & 4.44089209850063e-16 \tabularnewline
p-value (1 sided) & 2.22044604925031e-16 \tabularnewline
Degrees of Freedom & 59 \tabularnewline
Number of Observations & 61 \tabularnewline
\hline
\end{tabular}
%Source: https://freestatistics.org/blog/index.php?pk=17489&T=1

[TABLE]
[ROW][C]Pearson Product Moment Correlation - Ungrouped Data[/C][/ROW]
[ROW][C]Statistic[/C][C]Variable X[/C][C]Variable Y[/C][/ROW]
[ROW][C]Mean[/C][C]114.852459016393[/C][C]121.257377049180[/C][/ROW]
[ROW][C]Biased Variance[/C][C]222.107739854878[/C][C]385.569658693899[/C][/ROW]
[ROW][C]Biased Standard Deviation[/C][C]14.9032794999919[/C][C]19.635927752309[/C][/ROW]
[ROW][C]Covariance[/C][C]245.299439890710[/C][/ROW]
[ROW][C]Correlation[/C][C]0.824488685204379[/C][/ROW]
[ROW][C]Determination[/C][C]0.679781592030046[/C][/ROW]
[ROW][C]T-Test[/C][C]11.1914809252909[/C][/ROW]
[ROW][C]p-value (2 sided)[/C][C]4.44089209850063e-16[/C][/ROW]
[ROW][C]p-value (1 sided)[/C][C]2.22044604925031e-16[/C][/ROW]
[ROW][C]Degrees of Freedom[/C][C]59[/C][/ROW]
[ROW][C]Number of Observations[/C][C]61[/C][/ROW]
[/TABLE]
Source: https://freestatistics.org/blog/index.php?pk=17489&T=1

Globally Unique Identifier (entire table): ba.freestatistics.org/blog/index.php?pk=17489&T=1

As an alternative you can also use a QR Code:  

The GUIDs for individual cells are displayed in the table below:

Pearson Product Moment Correlation - Ungrouped Data
StatisticVariable XVariable Y
Mean114.852459016393121.257377049180
Biased Variance222.107739854878385.569658693899
Biased Standard Deviation14.903279499991919.635927752309
Covariance245.299439890710
Correlation0.824488685204379
Determination0.679781592030046
T-Test11.1914809252909
p-value (2 sided)4.44089209850063e-16
p-value (1 sided)2.22044604925031e-16
Degrees of Freedom59
Number of Observations61


Parameters (Session):
Parameters (R input):
R code (references can be found in the software module):
bitmap(file='test1.png')
histx <- hist(x, plot=FALSE)
histy <- hist(y, plot=FALSE)
maxcounts <- max(c(histx$counts, histx$counts))
xrange <- c(min(x),max(x))
yrange <- c(min(y),max(y))
nf <- layout(matrix(c(2,0,1,3),2,2,byrow=TRUE), c(3,1), c(1,3), TRUE)
par(mar=c(4,4,1,1))
plot(x, y, xlim=xrange, ylim=yrange, xlab=xlab, ylab=ylab)
par(mar=c(0,4,1,1))
barplot(histx$counts, axes=FALSE, ylim=c(0, maxcounts), space=0)
par(mar=c(4,0,1,1))
barplot(histy$counts, axes=FALSE, xlim=c(0, maxcounts), space=0, horiz=TRUE)
dev.off()
lx = length(x)
makebiased = (lx-1)/lx
varx = var(x)*makebiased
vary = var(y)*makebiased
corxy <- cor.test(x,y,method='pearson')
cxy <- as.matrix(corxy$estimate)[1,1]
load(file='createtable')
a<-table.start()
a<-table.row.start(a)
a<-table.element(a,'Pearson Product Moment Correlation - Ungrouped Data',3,TRUE)
a<-table.row.end(a)
a<-table.row.start(a)
a<-table.element(a,'Statistic',1,TRUE)
a<-table.element(a,'Variable X',1,TRUE)
a<-table.element(a,'Variable Y',1,TRUE)
a<-table.row.end(a)
a<-table.row.start(a)
a<-table.element(a,hyperlink('arithmetic_mean.htm','Mean',''),header=TRUE)
a<-table.element(a,mean(x))
a<-table.element(a,mean(y))
a<-table.row.end(a)
a<-table.row.start(a)
a<-table.element(a,hyperlink('biased.htm','Biased Variance',''),header=TRUE)
a<-table.element(a,varx)
a<-table.element(a,vary)
a<-table.row.end(a)
a<-table.row.start(a)
a<-table.element(a,hyperlink('biased1.htm','Biased Standard Deviation',''),header=TRUE)
a<-table.element(a,sqrt(varx))
a<-table.element(a,sqrt(vary))
a<-table.row.end(a)
a<-table.row.start(a)
a<-table.element(a,hyperlink('covariance.htm','Covariance',''),header=TRUE)
a<-table.element(a,cov(x,y),2)
a<-table.row.end(a)
a<-table.row.start(a)
a<-table.element(a,hyperlink('pearson_correlation.htm','Correlation',''),header=TRUE)
a<-table.element(a,cxy,2)
a<-table.row.end(a)
a<-table.row.start(a)
a<-table.element(a,hyperlink('coeff_of_determination.htm','Determination',''),header=TRUE)
a<-table.element(a,cxy*cxy,2)
a<-table.row.end(a)
a<-table.row.start(a)
a<-table.element(a,hyperlink('ttest_statistic.htm','T-Test',''),header=TRUE)
a<-table.element(a,as.matrix(corxy$statistic)[1,1],2)
a<-table.row.end(a)
a<-table.row.start(a)
a<-table.element(a,'p-value (2 sided)',header=TRUE)
a<-table.element(a,(p2 <- as.matrix(corxy$p.value)[1,1]),2)
a<-table.row.end(a)
a<-table.row.start(a)
a<-table.element(a,'p-value (1 sided)',header=TRUE)
a<-table.element(a,p2/2,2)
a<-table.row.end(a)
a<-table.row.start(a)
a<-table.element(a,'Degrees of Freedom',header=TRUE)
a<-table.element(a,lx-2,2)
a<-table.row.end(a)
a<-table.row.start(a)
a<-table.element(a,'Number of Observations',header=TRUE)
a<-table.element(a,lx,2)
a<-table.row.end(a)
a<-table.end(a)
table.save(a,file='mytable.tab')