Free Statistics
of Irreproducible Research!
Description of Statistical Computation | |||||||||||||||||||||||||||||||||||||||||
|---|---|---|---|---|---|---|---|---|---|---|---|---|---|---|---|---|---|---|---|---|---|---|---|---|---|---|---|---|---|---|---|---|---|---|---|---|---|---|---|---|---|
| Author's title | Industri�le productie - koninkrijk - indexen per werkdag - volgens de beste... | ||||||||||||||||||||||||||||||||||||||||
| Author | *The author of this computation has been verified* | ||||||||||||||||||||||||||||||||||||||||
| R Software Module | rwasp_univariatedataseries.wasp | ||||||||||||||||||||||||||||||||||||||||
| Title produced by software | Univariate Data Series | ||||||||||||||||||||||||||||||||||||||||
| Date of computation | Mon, 20 Oct 2008 09:50:32 -0600 | ||||||||||||||||||||||||||||||||||||||||
| Cite this page as follows | Statistical Computations at FreeStatistics.org, Office for Research Development and Education, URL https://freestatistics.org/blog/index.php?v=date/2008/Oct/20/t12245178725ci27njj5jxth0v.htm/, Retrieved Fri, 17 May 2024 05:48:16 +0000 | ||||||||||||||||||||||||||||||||||||||||
| Statistical Computations at FreeStatistics.org, Office for Research Development and Education, URL https://freestatistics.org/blog/index.php?pk=17530, Retrieved Fri, 17 May 2024 05:48:16 +0000 | |||||||||||||||||||||||||||||||||||||||||
| QR Codes: | |||||||||||||||||||||||||||||||||||||||||
|
| |||||||||||||||||||||||||||||||||||||||||
| Original text written by user: | |||||||||||||||||||||||||||||||||||||||||
| IsPrivate? | No (this computation is public) | ||||||||||||||||||||||||||||||||||||||||
| User-defined keywords | |||||||||||||||||||||||||||||||||||||||||
| Estimated Impact | 112 | ||||||||||||||||||||||||||||||||||||||||
Tree of Dependent Computations | |||||||||||||||||||||||||||||||||||||||||
| Family? (F = Feedback message, R = changed R code, M = changed R Module, P = changed Parameters, D = changed Data) | |||||||||||||||||||||||||||||||||||||||||
| F [Univariate Data Series] [ Werkje Investere...] [2008-10-13 21:14:46] [491a70d26f8c977398d8a0c1c87d3dd4] - P [Univariate Data Series] [Industri�le produ...] [2008-10-20 14:18:06] [491a70d26f8c977398d8a0c1c87d3dd4] - P [Univariate Data Series] [Industri�le produ...] [2008-10-20 15:50:32] [2ba2a74112fb2c960057a572bf2825d3] [Current] | |||||||||||||||||||||||||||||||||||||||||
| Feedback Forum | |||||||||||||||||||||||||||||||||||||||||
Post a new message | |||||||||||||||||||||||||||||||||||||||||
Dataset | |||||||||||||||||||||||||||||||||||||||||
| Dataseries X: | |||||||||||||||||||||||||||||||||||||||||
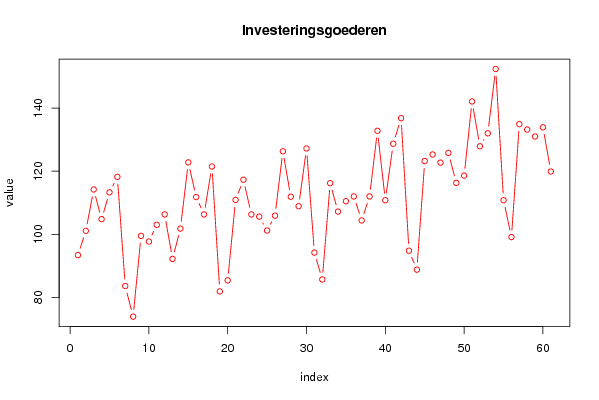
93.4 101.1 114.2 104.8 113.3 118.2 83.6 73.9 99.5 97.7 103 106.3 92.2 101.8 122.8 111.8 106.3 121.5 81.9 85.4 110.9 117.3 106.3 105.6 101.2 105.9 126.3 111.9 108.9 127.2 94.2 85.7 116.2 107.2 110.5 112 104.4 112 132.8 110.8 128.7 136.8 94.8 88.8 123.2 125.3 122.7 125.8 116.3 118.6 142.1 127.9 132 152.4 110.8 99.1 134.9 133.2 131 133.9 119.9 | |||||||||||||||||||||||||||||||||||||||||
Tables (Output of Computation) | |||||||||||||||||||||||||||||||||||||||||
| |||||||||||||||||||||||||||||||||||||||||
Figures (Output of Computation) | |||||||||||||||||||||||||||||||||||||||||
Input Parameters & R Code | |||||||||||||||||||||||||||||||||||||||||
| Parameters (Session): | |||||||||||||||||||||||||||||||||||||||||
| par1 = Industri�le productie - koninkrijk - indexen per werkdag - volgens de bestemming: Investeringsgoederen ; par2 = http://www.nbb.be/belgostat/PublicatieSelectieLinker?LinkID=534000029|910000082&Lang=N ; par3 = Goederen die door de bedrijven aangekocht worden ter investering ; | |||||||||||||||||||||||||||||||||||||||||
| Parameters (R input): | |||||||||||||||||||||||||||||||||||||||||
| par1 = Industri�le productie - koninkrijk - indexen per werkdag - volgens de bestemming: Investeringsgoederen ; par2 = http://www.nbb.be/belgostat/PublicatieSelectieLinker?LinkID=534000029|910000082&Lang=N ; par3 = Goederen die door de bedrijven aangekocht worden ter investering ; | |||||||||||||||||||||||||||||||||||||||||
| R code (references can be found in the software module): | |||||||||||||||||||||||||||||||||||||||||
bitmap(file='test1.png') | |||||||||||||||||||||||||||||||||||||||||