Free Statistics

of Irreproducible Research!

Author's title

Author*Unverified author*
R Software Modulerwasp_centraltendency.wasp
Title produced by softwareCentral Tendency
Date of computationMon, 20 Oct 2008 10:11:35 -0600
Cite this page as followsStatistical Computations at FreeStatistics.org, Office for Research Development and Education, URL https://freestatistics.org/blog/index.php?v=date/2008/Oct/20/t1224519694s57b3tg5jy8p3tj.htm/, Retrieved Fri, 17 May 2024 04:12:15 +0000
Statistical Computations at FreeStatistics.org, Office for Research Development and Education, URL https://freestatistics.org/blog/index.php?pk=17594, Retrieved Fri, 17 May 2024 04:12:15 +0000
QR Codes:

Original text written by user:
IsPrivate?No (this computation is public)
User-defined keywords
Estimated Impact120
Family? (F = Feedback message, R = changed R code, M = changed R Module, P = changed Parameters, D = changed Data)
-       [Central Tendency] [central tendency:...] [2008-10-20 16:11:35] [01c398ee8ca2f8c0964b19b0b10c7536] [Current]
Feedback Forum

Post a new message
Dataseries X:
15859,4
15258,9
15498,6
15106,5
15023,6
12083
15761,3
16942,6
15070,3
13659,6
14768,9
14725,1
15998,1
15370,6
14956,9
15469,7
15101,8
11703,7
16283,6
16726,5
14968,9
14861
14583,3
15305,8
17903,9
16379,4
15420,3
17870,5
15912,8
13866,5
17823,2
17872
17422
16704,5
15991,2
16583,6
19123,5
17838,7
17209,4
18586,5
16258,1
15141,6
19202,1
17746,5
19090,1
18040,3
17515,5
17751,8
21072,4
17170
19439,5
19795,4
17574,9
16165,4
19464,6
19932,1
19961,2
17343,4
18924,2
18574,1
21350,6
18594,6
19823,1
20844,4
19640,2
17735,4
19813,6
22238,5
20682,2
17818,6
21872,1
22117
21865,9


Summary of computational transaction
Raw Inputview raw input (R code)
Raw Outputview raw output of R engine
Computing time2 seconds
R Server'George Udny Yule' @ 72.249.76.132

\begin{tabular}{lllllllll}
\hline
Summary of computational transaction \tabularnewline
Raw Input & view raw input (R code)  \tabularnewline
Raw Output & view raw output of R engine  \tabularnewline
Computing time & 2 seconds \tabularnewline
R Server & 'George Udny Yule' @ 72.249.76.132 \tabularnewline
\hline
\end{tabular}
%Source: https://freestatistics.org/blog/index.php?pk=17594&T=0

[TABLE]
[ROW][C]Summary of computational transaction[/C][/ROW]
[ROW][C]Raw Input[/C][C]view raw input (R code) [/C][/ROW]
[ROW][C]Raw Output[/C][C]view raw output of R engine [/C][/ROW]
[ROW][C]Computing time[/C][C]2 seconds[/C][/ROW]
[ROW][C]R Server[/C][C]'George Udny Yule' @ 72.249.76.132[/C][/ROW]
[/TABLE]
Source: https://freestatistics.org/blog/index.php?pk=17594&T=0

Globally Unique Identifier (entire table): ba.freestatistics.org/blog/index.php?pk=17594&T=0

As an alternative you can also use a QR Code:  

The GUIDs for individual cells are displayed in the table below:

Summary of computational transaction
Raw Inputview raw input (R code)
Raw Outputview raw output of R engine
Computing time2 seconds
R Server'George Udny Yule' @ 72.249.76.132


Central Tendency - Ungrouped Data
MeasureValueS.E.Value/S.E.
Arithmetic Mean17317.1931506849274.20433816587163.1543368953174
Geometric Mean17159.8971828064
Harmonic Mean17001.1329131009
Quadratic Mean17472.799317542
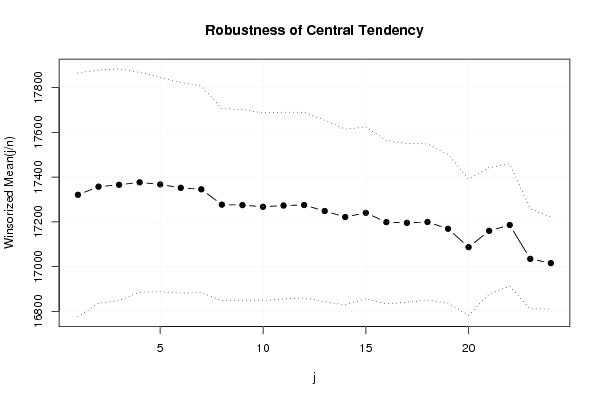
Winsorized Mean ( 1 / 24 )17320.7246575342272.36061293273763.5948218467692
Winsorized Mean ( 2 / 24 )17357.2095890411260.67621135379866.5853224538518
Winsorized Mean ( 3 / 24 )17365.4575342466258.97937180152667.0534390961259
Winsorized Mean ( 4 / 24 )17376.498630137245.59009165337970.7540703827004
Winsorized Mean ( 5 / 24 )17367.1561643836239.89367372970472.3952236604274
Winsorized Mean ( 6 / 24 )17352.0164383562235.40255094071973.7121002683013
Winsorized Mean ( 7 / 24 )17345.2945205479230.90589365221375.1184573342815
Winsorized Mean ( 8 / 24 )17276.7904109589214.49572323478580.5460833922915
Winsorized Mean ( 9 / 24 )17274.6821917808213.65203145639280.8542847639935
Winsorized Mean ( 10 / 24 )17267.2438356164209.98234543810182.2318838261881
Winsorized Mean ( 11 / 24 )17272.8493150685208.70242373951082.7630508816103
Winsorized Mean ( 12 / 24 )17275.0356164384207.44084161894283.276925997879
Winsorized Mean ( 13 / 24 )17248.2342465753202.72115149483385.0835451524897
Winsorized Mean ( 14 / 24 )17221.2890410959196.29855658268287.7300849323472
Winsorized Mean ( 15 / 24 )17240.2342465753191.97765892600489.8033361955956
Winsorized Mean ( 16 / 24 )17198.4808219178182.38692860577094.2966744019927
Winsorized Mean ( 17 / 24 )17195.2671232877177.4438113421296.9054203312528
Winsorized Mean ( 18 / 24 )17199.2863013699174.45947516636698.5861403341293
Winsorized Mean ( 19 / 24 )17168.9643835616166.217882082784103.291921232703
Winsorized Mean ( 20 / 24 )17086.5808219178152.230614350151112.241423283075
Winsorized Mean ( 21 / 24 )17159.8219178082141.225173600433121.506821201426
Winsorized Mean ( 22 / 24 )17185.6493150685136.673338044698125.742515408880
Winsorized Mean ( 23 / 24 )17034.2904109589111.867981232928152.271366866723
Winsorized Mean ( 24 / 24 )17015.2219178082102.792514771376165.529775739531
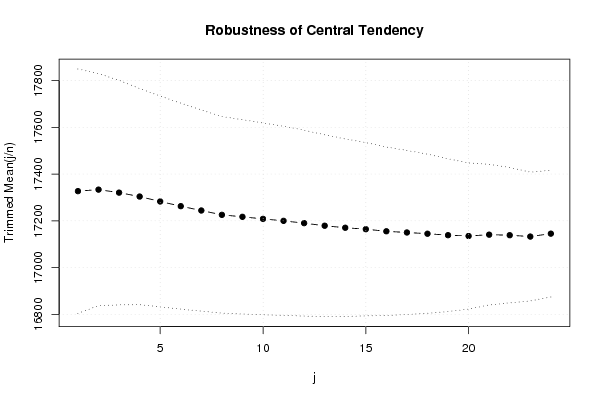
Trimmed Mean ( 1 / 24 )17326.9422535211261.34265363753766.2997104083603
Trimmed Mean ( 2 / 24 )17333.5202898551248.18365941460669.8415049997243
Trimmed Mean ( 3 / 24 )17320.6149253731240.08930453711472.1423845129913
Trimmed Mean ( 4 / 24 )17303.8276923077231.15925737826674.8567368166956
Trimmed Mean ( 5 / 24 )17282.7761904762225.42125836090876.668794754068
Trimmed Mean ( 6 / 24 )17262.5803278689220.2547907447478.375504430571
Trimmed Mean ( 7 / 24 )17244.1372881356215.20694665451580.1281629436369
Trimmed Mean ( 8 / 24 )17225.6298245614210.14932909678881.9685216155404
Trimmed Mean ( 9 / 24 )17217.1418181818207.86960591171582.8266438600657
Trimmed Mean ( 10 / 24 )17208.3358490566205.07293376916083.9132475104058
Trimmed Mean ( 11 / 24 )17199.9039215686202.2322860118485.0502373323397
Trimmed Mean ( 12 / 24 )17190.0244897959198.76129586542786.485773877398
Trimmed Mean ( 13 / 24 )17179.0212765957194.47013168561088.3375823716118
Trimmed Mean ( 14 / 24 )17170.3844444444189.90665000658390.4148666929213
Trimmed Mean ( 15 / 24 )17164.2116279070185.32356386756992.6175348115601
Trimmed Mean ( 16 / 24 )17155.1878048780180.13589508341195.2346993192804
Trimmed Mean ( 17 / 24 )17150.1230769231175.42156193636497.7651942418828
Trimmed Mean ( 18 / 24 )17144.8837837838170.106932960841100.788859603568
Trimmed Mean ( 19 / 24 )17138.58163.429106918674104.868589953983
Trimmed Mean ( 20 / 24 )17135.0424242424156.336444695304109.603633737726
Trimmed Mean ( 21 / 24 )17140.7483870968150.270448727173114.065995891295
Trimmed Mean ( 22 / 24 )17138.4620689655144.723688013611118.421954997123
Trimmed Mean ( 23 / 24 )17132.6629629630137.692274283575124.427191373705
Trimmed Mean ( 24 / 24 )17145.152135.361010895555126.662411033774
Median17343.4
Midrange16971.1
Midmean - Weighted Average at Xnp17090.85
Midmean - Weighted Average at X(n+1)p17144.8837837838
Midmean - Empirical Distribution Function17144.8837837838
Midmean - Empirical Distribution Function - Averaging17144.8837837838
Midmean - Empirical Distribution Function - Interpolation17144.8837837838
Midmean - Closest Observation17098.1921052632
Midmean - True Basic - Statistics Graphics Toolkit17144.8837837838
Midmean - MS Excel (old versions)17144.8837837838
Number of observations73

\begin{tabular}{lllllllll}
\hline
Central Tendency - Ungrouped Data \tabularnewline
Measure & Value & S.E. & Value/S.E. \tabularnewline
Arithmetic Mean & 17317.1931506849 & 274.204338165871 & 63.1543368953174 \tabularnewline
Geometric Mean & 17159.8971828064 &  &  \tabularnewline
Harmonic Mean & 17001.1329131009 &  &  \tabularnewline
Quadratic Mean & 17472.799317542 &  &  \tabularnewline
Winsorized Mean ( 1 / 24 ) & 17320.7246575342 & 272.360612932737 & 63.5948218467692 \tabularnewline
Winsorized Mean ( 2 / 24 ) & 17357.2095890411 & 260.676211353798 & 66.5853224538518 \tabularnewline
Winsorized Mean ( 3 / 24 ) & 17365.4575342466 & 258.979371801526 & 67.0534390961259 \tabularnewline
Winsorized Mean ( 4 / 24 ) & 17376.498630137 & 245.590091653379 & 70.7540703827004 \tabularnewline
Winsorized Mean ( 5 / 24 ) & 17367.1561643836 & 239.893673729704 & 72.3952236604274 \tabularnewline
Winsorized Mean ( 6 / 24 ) & 17352.0164383562 & 235.402550940719 & 73.7121002683013 \tabularnewline
Winsorized Mean ( 7 / 24 ) & 17345.2945205479 & 230.905893652213 & 75.1184573342815 \tabularnewline
Winsorized Mean ( 8 / 24 ) & 17276.7904109589 & 214.495723234785 & 80.5460833922915 \tabularnewline
Winsorized Mean ( 9 / 24 ) & 17274.6821917808 & 213.652031456392 & 80.8542847639935 \tabularnewline
Winsorized Mean ( 10 / 24 ) & 17267.2438356164 & 209.982345438101 & 82.2318838261881 \tabularnewline
Winsorized Mean ( 11 / 24 ) & 17272.8493150685 & 208.702423739510 & 82.7630508816103 \tabularnewline
Winsorized Mean ( 12 / 24 ) & 17275.0356164384 & 207.440841618942 & 83.276925997879 \tabularnewline
Winsorized Mean ( 13 / 24 ) & 17248.2342465753 & 202.721151494833 & 85.0835451524897 \tabularnewline
Winsorized Mean ( 14 / 24 ) & 17221.2890410959 & 196.298556582682 & 87.7300849323472 \tabularnewline
Winsorized Mean ( 15 / 24 ) & 17240.2342465753 & 191.977658926004 & 89.8033361955956 \tabularnewline
Winsorized Mean ( 16 / 24 ) & 17198.4808219178 & 182.386928605770 & 94.2966744019927 \tabularnewline
Winsorized Mean ( 17 / 24 ) & 17195.2671232877 & 177.44381134212 & 96.9054203312528 \tabularnewline
Winsorized Mean ( 18 / 24 ) & 17199.2863013699 & 174.459475166366 & 98.5861403341293 \tabularnewline
Winsorized Mean ( 19 / 24 ) & 17168.9643835616 & 166.217882082784 & 103.291921232703 \tabularnewline
Winsorized Mean ( 20 / 24 ) & 17086.5808219178 & 152.230614350151 & 112.241423283075 \tabularnewline
Winsorized Mean ( 21 / 24 ) & 17159.8219178082 & 141.225173600433 & 121.506821201426 \tabularnewline
Winsorized Mean ( 22 / 24 ) & 17185.6493150685 & 136.673338044698 & 125.742515408880 \tabularnewline
Winsorized Mean ( 23 / 24 ) & 17034.2904109589 & 111.867981232928 & 152.271366866723 \tabularnewline
Winsorized Mean ( 24 / 24 ) & 17015.2219178082 & 102.792514771376 & 165.529775739531 \tabularnewline
Trimmed Mean ( 1 / 24 ) & 17326.9422535211 & 261.342653637537 & 66.2997104083603 \tabularnewline
Trimmed Mean ( 2 / 24 ) & 17333.5202898551 & 248.183659414606 & 69.8415049997243 \tabularnewline
Trimmed Mean ( 3 / 24 ) & 17320.6149253731 & 240.089304537114 & 72.1423845129913 \tabularnewline
Trimmed Mean ( 4 / 24 ) & 17303.8276923077 & 231.159257378266 & 74.8567368166956 \tabularnewline
Trimmed Mean ( 5 / 24 ) & 17282.7761904762 & 225.421258360908 & 76.668794754068 \tabularnewline
Trimmed Mean ( 6 / 24 ) & 17262.5803278689 & 220.25479074474 & 78.375504430571 \tabularnewline
Trimmed Mean ( 7 / 24 ) & 17244.1372881356 & 215.206946654515 & 80.1281629436369 \tabularnewline
Trimmed Mean ( 8 / 24 ) & 17225.6298245614 & 210.149329096788 & 81.9685216155404 \tabularnewline
Trimmed Mean ( 9 / 24 ) & 17217.1418181818 & 207.869605911715 & 82.8266438600657 \tabularnewline
Trimmed Mean ( 10 / 24 ) & 17208.3358490566 & 205.072933769160 & 83.9132475104058 \tabularnewline
Trimmed Mean ( 11 / 24 ) & 17199.9039215686 & 202.23228601184 & 85.0502373323397 \tabularnewline
Trimmed Mean ( 12 / 24 ) & 17190.0244897959 & 198.761295865427 & 86.485773877398 \tabularnewline
Trimmed Mean ( 13 / 24 ) & 17179.0212765957 & 194.470131685610 & 88.3375823716118 \tabularnewline
Trimmed Mean ( 14 / 24 ) & 17170.3844444444 & 189.906650006583 & 90.4148666929213 \tabularnewline
Trimmed Mean ( 15 / 24 ) & 17164.2116279070 & 185.323563867569 & 92.6175348115601 \tabularnewline
Trimmed Mean ( 16 / 24 ) & 17155.1878048780 & 180.135895083411 & 95.2346993192804 \tabularnewline
Trimmed Mean ( 17 / 24 ) & 17150.1230769231 & 175.421561936364 & 97.7651942418828 \tabularnewline
Trimmed Mean ( 18 / 24 ) & 17144.8837837838 & 170.106932960841 & 100.788859603568 \tabularnewline
Trimmed Mean ( 19 / 24 ) & 17138.58 & 163.429106918674 & 104.868589953983 \tabularnewline
Trimmed Mean ( 20 / 24 ) & 17135.0424242424 & 156.336444695304 & 109.603633737726 \tabularnewline
Trimmed Mean ( 21 / 24 ) & 17140.7483870968 & 150.270448727173 & 114.065995891295 \tabularnewline
Trimmed Mean ( 22 / 24 ) & 17138.4620689655 & 144.723688013611 & 118.421954997123 \tabularnewline
Trimmed Mean ( 23 / 24 ) & 17132.6629629630 & 137.692274283575 & 124.427191373705 \tabularnewline
Trimmed Mean ( 24 / 24 ) & 17145.152 & 135.361010895555 & 126.662411033774 \tabularnewline
Median & 17343.4 &  &  \tabularnewline
Midrange & 16971.1 &  &  \tabularnewline
Midmean - Weighted Average at Xnp & 17090.85 &  &  \tabularnewline
Midmean - Weighted Average at X(n+1)p & 17144.8837837838 &  &  \tabularnewline
Midmean - Empirical Distribution Function & 17144.8837837838 &  &  \tabularnewline
Midmean - Empirical Distribution Function - Averaging & 17144.8837837838 &  &  \tabularnewline
Midmean - Empirical Distribution Function - Interpolation & 17144.8837837838 &  &  \tabularnewline
Midmean - Closest Observation & 17098.1921052632 &  &  \tabularnewline
Midmean - True Basic - Statistics Graphics Toolkit & 17144.8837837838 &  &  \tabularnewline
Midmean - MS Excel (old versions) & 17144.8837837838 &  &  \tabularnewline
Number of observations & 73 &  &  \tabularnewline
\hline
\end{tabular}
%Source: https://freestatistics.org/blog/index.php?pk=17594&T=1

[TABLE]
[ROW][C]Central Tendency - Ungrouped Data[/C][/ROW]
[ROW][C]Measure[/C][C]Value[/C][C]S.E.[/C][C]Value/S.E.[/C][/ROW]
[ROW][C]Arithmetic Mean[/C][C]17317.1931506849[/C][C]274.204338165871[/C][C]63.1543368953174[/C][/ROW]
[ROW][C]Geometric Mean[/C][C]17159.8971828064[/C][C][/C][C][/C][/ROW]
[ROW][C]Harmonic Mean[/C][C]17001.1329131009[/C][C][/C][C][/C][/ROW]
[ROW][C]Quadratic Mean[/C][C]17472.799317542[/C][C][/C][C][/C][/ROW]
[ROW][C]Winsorized Mean ( 1 / 24 )[/C][C]17320.7246575342[/C][C]272.360612932737[/C][C]63.5948218467692[/C][/ROW]
[ROW][C]Winsorized Mean ( 2 / 24 )[/C][C]17357.2095890411[/C][C]260.676211353798[/C][C]66.5853224538518[/C][/ROW]
[ROW][C]Winsorized Mean ( 3 / 24 )[/C][C]17365.4575342466[/C][C]258.979371801526[/C][C]67.0534390961259[/C][/ROW]
[ROW][C]Winsorized Mean ( 4 / 24 )[/C][C]17376.498630137[/C][C]245.590091653379[/C][C]70.7540703827004[/C][/ROW]
[ROW][C]Winsorized Mean ( 5 / 24 )[/C][C]17367.1561643836[/C][C]239.893673729704[/C][C]72.3952236604274[/C][/ROW]
[ROW][C]Winsorized Mean ( 6 / 24 )[/C][C]17352.0164383562[/C][C]235.402550940719[/C][C]73.7121002683013[/C][/ROW]
[ROW][C]Winsorized Mean ( 7 / 24 )[/C][C]17345.2945205479[/C][C]230.905893652213[/C][C]75.1184573342815[/C][/ROW]
[ROW][C]Winsorized Mean ( 8 / 24 )[/C][C]17276.7904109589[/C][C]214.495723234785[/C][C]80.5460833922915[/C][/ROW]
[ROW][C]Winsorized Mean ( 9 / 24 )[/C][C]17274.6821917808[/C][C]213.652031456392[/C][C]80.8542847639935[/C][/ROW]
[ROW][C]Winsorized Mean ( 10 / 24 )[/C][C]17267.2438356164[/C][C]209.982345438101[/C][C]82.2318838261881[/C][/ROW]
[ROW][C]Winsorized Mean ( 11 / 24 )[/C][C]17272.8493150685[/C][C]208.702423739510[/C][C]82.7630508816103[/C][/ROW]
[ROW][C]Winsorized Mean ( 12 / 24 )[/C][C]17275.0356164384[/C][C]207.440841618942[/C][C]83.276925997879[/C][/ROW]
[ROW][C]Winsorized Mean ( 13 / 24 )[/C][C]17248.2342465753[/C][C]202.721151494833[/C][C]85.0835451524897[/C][/ROW]
[ROW][C]Winsorized Mean ( 14 / 24 )[/C][C]17221.2890410959[/C][C]196.298556582682[/C][C]87.7300849323472[/C][/ROW]
[ROW][C]Winsorized Mean ( 15 / 24 )[/C][C]17240.2342465753[/C][C]191.977658926004[/C][C]89.8033361955956[/C][/ROW]
[ROW][C]Winsorized Mean ( 16 / 24 )[/C][C]17198.4808219178[/C][C]182.386928605770[/C][C]94.2966744019927[/C][/ROW]
[ROW][C]Winsorized Mean ( 17 / 24 )[/C][C]17195.2671232877[/C][C]177.44381134212[/C][C]96.9054203312528[/C][/ROW]
[ROW][C]Winsorized Mean ( 18 / 24 )[/C][C]17199.2863013699[/C][C]174.459475166366[/C][C]98.5861403341293[/C][/ROW]
[ROW][C]Winsorized Mean ( 19 / 24 )[/C][C]17168.9643835616[/C][C]166.217882082784[/C][C]103.291921232703[/C][/ROW]
[ROW][C]Winsorized Mean ( 20 / 24 )[/C][C]17086.5808219178[/C][C]152.230614350151[/C][C]112.241423283075[/C][/ROW]
[ROW][C]Winsorized Mean ( 21 / 24 )[/C][C]17159.8219178082[/C][C]141.225173600433[/C][C]121.506821201426[/C][/ROW]
[ROW][C]Winsorized Mean ( 22 / 24 )[/C][C]17185.6493150685[/C][C]136.673338044698[/C][C]125.742515408880[/C][/ROW]
[ROW][C]Winsorized Mean ( 23 / 24 )[/C][C]17034.2904109589[/C][C]111.867981232928[/C][C]152.271366866723[/C][/ROW]
[ROW][C]Winsorized Mean ( 24 / 24 )[/C][C]17015.2219178082[/C][C]102.792514771376[/C][C]165.529775739531[/C][/ROW]
[ROW][C]Trimmed Mean ( 1 / 24 )[/C][C]17326.9422535211[/C][C]261.342653637537[/C][C]66.2997104083603[/C][/ROW]
[ROW][C]Trimmed Mean ( 2 / 24 )[/C][C]17333.5202898551[/C][C]248.183659414606[/C][C]69.8415049997243[/C][/ROW]
[ROW][C]Trimmed Mean ( 3 / 24 )[/C][C]17320.6149253731[/C][C]240.089304537114[/C][C]72.1423845129913[/C][/ROW]
[ROW][C]Trimmed Mean ( 4 / 24 )[/C][C]17303.8276923077[/C][C]231.159257378266[/C][C]74.8567368166956[/C][/ROW]
[ROW][C]Trimmed Mean ( 5 / 24 )[/C][C]17282.7761904762[/C][C]225.421258360908[/C][C]76.668794754068[/C][/ROW]
[ROW][C]Trimmed Mean ( 6 / 24 )[/C][C]17262.5803278689[/C][C]220.25479074474[/C][C]78.375504430571[/C][/ROW]
[ROW][C]Trimmed Mean ( 7 / 24 )[/C][C]17244.1372881356[/C][C]215.206946654515[/C][C]80.1281629436369[/C][/ROW]
[ROW][C]Trimmed Mean ( 8 / 24 )[/C][C]17225.6298245614[/C][C]210.149329096788[/C][C]81.9685216155404[/C][/ROW]
[ROW][C]Trimmed Mean ( 9 / 24 )[/C][C]17217.1418181818[/C][C]207.869605911715[/C][C]82.8266438600657[/C][/ROW]
[ROW][C]Trimmed Mean ( 10 / 24 )[/C][C]17208.3358490566[/C][C]205.072933769160[/C][C]83.9132475104058[/C][/ROW]
[ROW][C]Trimmed Mean ( 11 / 24 )[/C][C]17199.9039215686[/C][C]202.23228601184[/C][C]85.0502373323397[/C][/ROW]
[ROW][C]Trimmed Mean ( 12 / 24 )[/C][C]17190.0244897959[/C][C]198.761295865427[/C][C]86.485773877398[/C][/ROW]
[ROW][C]Trimmed Mean ( 13 / 24 )[/C][C]17179.0212765957[/C][C]194.470131685610[/C][C]88.3375823716118[/C][/ROW]
[ROW][C]Trimmed Mean ( 14 / 24 )[/C][C]17170.3844444444[/C][C]189.906650006583[/C][C]90.4148666929213[/C][/ROW]
[ROW][C]Trimmed Mean ( 15 / 24 )[/C][C]17164.2116279070[/C][C]185.323563867569[/C][C]92.6175348115601[/C][/ROW]
[ROW][C]Trimmed Mean ( 16 / 24 )[/C][C]17155.1878048780[/C][C]180.135895083411[/C][C]95.2346993192804[/C][/ROW]
[ROW][C]Trimmed Mean ( 17 / 24 )[/C][C]17150.1230769231[/C][C]175.421561936364[/C][C]97.7651942418828[/C][/ROW]
[ROW][C]Trimmed Mean ( 18 / 24 )[/C][C]17144.8837837838[/C][C]170.106932960841[/C][C]100.788859603568[/C][/ROW]
[ROW][C]Trimmed Mean ( 19 / 24 )[/C][C]17138.58[/C][C]163.429106918674[/C][C]104.868589953983[/C][/ROW]
[ROW][C]Trimmed Mean ( 20 / 24 )[/C][C]17135.0424242424[/C][C]156.336444695304[/C][C]109.603633737726[/C][/ROW]
[ROW][C]Trimmed Mean ( 21 / 24 )[/C][C]17140.7483870968[/C][C]150.270448727173[/C][C]114.065995891295[/C][/ROW]
[ROW][C]Trimmed Mean ( 22 / 24 )[/C][C]17138.4620689655[/C][C]144.723688013611[/C][C]118.421954997123[/C][/ROW]
[ROW][C]Trimmed Mean ( 23 / 24 )[/C][C]17132.6629629630[/C][C]137.692274283575[/C][C]124.427191373705[/C][/ROW]
[ROW][C]Trimmed Mean ( 24 / 24 )[/C][C]17145.152[/C][C]135.361010895555[/C][C]126.662411033774[/C][/ROW]
[ROW][C]Median[/C][C]17343.4[/C][C][/C][C][/C][/ROW]
[ROW][C]Midrange[/C][C]16971.1[/C][C][/C][C][/C][/ROW]
[ROW][C]Midmean - Weighted Average at Xnp[/C][C]17090.85[/C][C][/C][C][/C][/ROW]
[ROW][C]Midmean - Weighted Average at X(n+1)p[/C][C]17144.8837837838[/C][C][/C][C][/C][/ROW]
[ROW][C]Midmean - Empirical Distribution Function[/C][C]17144.8837837838[/C][C][/C][C][/C][/ROW]
[ROW][C]Midmean - Empirical Distribution Function - Averaging[/C][C]17144.8837837838[/C][C][/C][C][/C][/ROW]
[ROW][C]Midmean - Empirical Distribution Function - Interpolation[/C][C]17144.8837837838[/C][C][/C][C][/C][/ROW]
[ROW][C]Midmean - Closest Observation[/C][C]17098.1921052632[/C][C][/C][C][/C][/ROW]
[ROW][C]Midmean - True Basic - Statistics Graphics Toolkit[/C][C]17144.8837837838[/C][C][/C][C][/C][/ROW]
[ROW][C]Midmean - MS Excel (old versions)[/C][C]17144.8837837838[/C][C][/C][C][/C][/ROW]
[ROW][C]Number of observations[/C][C]73[/C][C][/C][C][/C][/ROW]
[/TABLE]
Source: https://freestatistics.org/blog/index.php?pk=17594&T=1

Globally Unique Identifier (entire table): ba.freestatistics.org/blog/index.php?pk=17594&T=1

As an alternative you can also use a QR Code:  

The GUIDs for individual cells are displayed in the table below:

Central Tendency - Ungrouped Data
MeasureValueS.E.Value/S.E.
Arithmetic Mean17317.1931506849274.20433816587163.1543368953174
Geometric Mean17159.8971828064
Harmonic Mean17001.1329131009
Quadratic Mean17472.799317542
Winsorized Mean ( 1 / 24 )17320.7246575342272.36061293273763.5948218467692
Winsorized Mean ( 2 / 24 )17357.2095890411260.67621135379866.5853224538518
Winsorized Mean ( 3 / 24 )17365.4575342466258.97937180152667.0534390961259
Winsorized Mean ( 4 / 24 )17376.498630137245.59009165337970.7540703827004
Winsorized Mean ( 5 / 24 )17367.1561643836239.89367372970472.3952236604274
Winsorized Mean ( 6 / 24 )17352.0164383562235.40255094071973.7121002683013
Winsorized Mean ( 7 / 24 )17345.2945205479230.90589365221375.1184573342815
Winsorized Mean ( 8 / 24 )17276.7904109589214.49572323478580.5460833922915
Winsorized Mean ( 9 / 24 )17274.6821917808213.65203145639280.8542847639935
Winsorized Mean ( 10 / 24 )17267.2438356164209.98234543810182.2318838261881
Winsorized Mean ( 11 / 24 )17272.8493150685208.70242373951082.7630508816103
Winsorized Mean ( 12 / 24 )17275.0356164384207.44084161894283.276925997879
Winsorized Mean ( 13 / 24 )17248.2342465753202.72115149483385.0835451524897
Winsorized Mean ( 14 / 24 )17221.2890410959196.29855658268287.7300849323472
Winsorized Mean ( 15 / 24 )17240.2342465753191.97765892600489.8033361955956
Winsorized Mean ( 16 / 24 )17198.4808219178182.38692860577094.2966744019927
Winsorized Mean ( 17 / 24 )17195.2671232877177.4438113421296.9054203312528
Winsorized Mean ( 18 / 24 )17199.2863013699174.45947516636698.5861403341293
Winsorized Mean ( 19 / 24 )17168.9643835616166.217882082784103.291921232703
Winsorized Mean ( 20 / 24 )17086.5808219178152.230614350151112.241423283075
Winsorized Mean ( 21 / 24 )17159.8219178082141.225173600433121.506821201426
Winsorized Mean ( 22 / 24 )17185.6493150685136.673338044698125.742515408880
Winsorized Mean ( 23 / 24 )17034.2904109589111.867981232928152.271366866723
Winsorized Mean ( 24 / 24 )17015.2219178082102.792514771376165.529775739531
Trimmed Mean ( 1 / 24 )17326.9422535211261.34265363753766.2997104083603
Trimmed Mean ( 2 / 24 )17333.5202898551248.18365941460669.8415049997243
Trimmed Mean ( 3 / 24 )17320.6149253731240.08930453711472.1423845129913
Trimmed Mean ( 4 / 24 )17303.8276923077231.15925737826674.8567368166956
Trimmed Mean ( 5 / 24 )17282.7761904762225.42125836090876.668794754068
Trimmed Mean ( 6 / 24 )17262.5803278689220.2547907447478.375504430571
Trimmed Mean ( 7 / 24 )17244.1372881356215.20694665451580.1281629436369
Trimmed Mean ( 8 / 24 )17225.6298245614210.14932909678881.9685216155404
Trimmed Mean ( 9 / 24 )17217.1418181818207.86960591171582.8266438600657
Trimmed Mean ( 10 / 24 )17208.3358490566205.07293376916083.9132475104058
Trimmed Mean ( 11 / 24 )17199.9039215686202.2322860118485.0502373323397
Trimmed Mean ( 12 / 24 )17190.0244897959198.76129586542786.485773877398
Trimmed Mean ( 13 / 24 )17179.0212765957194.47013168561088.3375823716118
Trimmed Mean ( 14 / 24 )17170.3844444444189.90665000658390.4148666929213
Trimmed Mean ( 15 / 24 )17164.2116279070185.32356386756992.6175348115601
Trimmed Mean ( 16 / 24 )17155.1878048780180.13589508341195.2346993192804
Trimmed Mean ( 17 / 24 )17150.1230769231175.42156193636497.7651942418828
Trimmed Mean ( 18 / 24 )17144.8837837838170.106932960841100.788859603568
Trimmed Mean ( 19 / 24 )17138.58163.429106918674104.868589953983
Trimmed Mean ( 20 / 24 )17135.0424242424156.336444695304109.603633737726
Trimmed Mean ( 21 / 24 )17140.7483870968150.270448727173114.065995891295
Trimmed Mean ( 22 / 24 )17138.4620689655144.723688013611118.421954997123
Trimmed Mean ( 23 / 24 )17132.6629629630137.692274283575124.427191373705
Trimmed Mean ( 24 / 24 )17145.152135.361010895555126.662411033774
Median17343.4
Midrange16971.1
Midmean - Weighted Average at Xnp17090.85
Midmean - Weighted Average at X(n+1)p17144.8837837838
Midmean - Empirical Distribution Function17144.8837837838
Midmean - Empirical Distribution Function - Averaging17144.8837837838
Midmean - Empirical Distribution Function - Interpolation17144.8837837838
Midmean - Closest Observation17098.1921052632
Midmean - True Basic - Statistics Graphics Toolkit17144.8837837838
Midmean - MS Excel (old versions)17144.8837837838
Number of observations73


Parameters (Session):
Parameters (R input):
R code (references can be found in the software module):
geomean <- function(x) {
return(exp(mean(log(x))))
}
harmean <- function(x) {
return(1/mean(1/x))
}
quamean <- function(x) {
return(sqrt(mean(x*x)))
}
winmean <- function(x) {
x <-sort(x[!is.na(x)])
n<-length(x)
denom <- 3
nodenom <- n/denom
if (nodenom>40) denom <- n/40
sqrtn = sqrt(n)
roundnodenom = floor(nodenom)
win <- array(NA,dim=c(roundnodenom,2))
for (j in 1:roundnodenom) {
win[j,1] <- (j*x[j+1]+sum(x[(j+1):(n-j)])+j*x[n-j])/n
win[j,2] <- sd(c(rep(x[j+1],j),x[(j+1):(n-j)],rep(x[n-j],j)))/sqrtn
}
return(win)
}
trimean <- function(x) {
x <-sort(x[!is.na(x)])
n<-length(x)
denom <- 3
nodenom <- n/denom
if (nodenom>40) denom <- n/40
sqrtn = sqrt(n)
roundnodenom = floor(nodenom)
tri <- array(NA,dim=c(roundnodenom,2))
for (j in 1:roundnodenom) {
tri[j,1] <- mean(x,trim=j/n)
tri[j,2] <- sd(x[(j+1):(n-j)]) / sqrt(n-j*2)
}
return(tri)
}
midrange <- function(x) {
return((max(x)+min(x))/2)
}
q1 <- function(data,n,p,i,f) {
np <- n*p;
i <<- floor(np)
f <<- np - i
qvalue <- (1-f)*data[i] + f*data[i+1]
}
q2 <- function(data,n,p,i,f) {
np <- (n+1)*p
i <<- floor(np)
f <<- np - i
qvalue <- (1-f)*data[i] + f*data[i+1]
}
q3 <- function(data,n,p,i,f) {
np <- n*p
i <<- floor(np)
f <<- np - i
if (f==0) {
qvalue <- data[i]
} else {
qvalue <- data[i+1]
}
}
q4 <- function(data,n,p,i,f) {
np <- n*p
i <<- floor(np)
f <<- np - i
if (f==0) {
qvalue <- (data[i]+data[i+1])/2
} else {
qvalue <- data[i+1]
}
}
q5 <- function(data,n,p,i,f) {
np <- (n-1)*p
i <<- floor(np)
f <<- np - i
if (f==0) {
qvalue <- data[i+1]
} else {
qvalue <- data[i+1] + f*(data[i+2]-data[i+1])
}
}
q6 <- function(data,n,p,i,f) {
np <- n*p+0.5
i <<- floor(np)
f <<- np - i
qvalue <- data[i]
}
q7 <- function(data,n,p,i,f) {
np <- (n+1)*p
i <<- floor(np)
f <<- np - i
if (f==0) {
qvalue <- data[i]
} else {
qvalue <- f*data[i] + (1-f)*data[i+1]
}
}
q8 <- function(data,n,p,i,f) {
np <- (n+1)*p
i <<- floor(np)
f <<- np - i
if (f==0) {
qvalue <- data[i]
} else {
if (f == 0.5) {
qvalue <- (data[i]+data[i+1])/2
} else {
if (f < 0.5) {
qvalue <- data[i]
} else {
qvalue <- data[i+1]
}
}
}
}
midmean <- function(x,def) {
x <-sort(x[!is.na(x)])
n<-length(x)
if (def==1) {
qvalue1 <- q1(x,n,0.25,i,f)
qvalue3 <- q1(x,n,0.75,i,f)
}
if (def==2) {
qvalue1 <- q2(x,n,0.25,i,f)
qvalue3 <- q2(x,n,0.75,i,f)
}
if (def==3) {
qvalue1 <- q3(x,n,0.25,i,f)
qvalue3 <- q3(x,n,0.75,i,f)
}
if (def==4) {
qvalue1 <- q4(x,n,0.25,i,f)
qvalue3 <- q4(x,n,0.75,i,f)
}
if (def==5) {
qvalue1 <- q5(x,n,0.25,i,f)
qvalue3 <- q5(x,n,0.75,i,f)
}
if (def==6) {
qvalue1 <- q6(x,n,0.25,i,f)
qvalue3 <- q6(x,n,0.75,i,f)
}
if (def==7) {
qvalue1 <- q7(x,n,0.25,i,f)
qvalue3 <- q7(x,n,0.75,i,f)
}
if (def==8) {
qvalue1 <- q8(x,n,0.25,i,f)
qvalue3 <- q8(x,n,0.75,i,f)
}
midm <- 0
myn <- 0
roundno4 <- round(n/4)
round3no4 <- round(3*n/4)
for (i in 1:n) {
if ((x[i]>=qvalue1) & (x[i]<=qvalue3)){
midm = midm + x[i]
myn = myn + 1
}
}
midm = midm / myn
return(midm)
}
(arm <- mean(x))
sqrtn <- sqrt(length(x))
(armse <- sd(x) / sqrtn)
(armose <- arm / armse)
(geo <- geomean(x))
(har <- harmean(x))
(qua <- quamean(x))
(win <- winmean(x))
(tri <- trimean(x))
(midr <- midrange(x))
midm <- array(NA,dim=8)
for (j in 1:8) midm[j] <- midmean(x,j)
midm
bitmap(file='test1.png')
lb <- win[,1] - 2*win[,2]
ub <- win[,1] + 2*win[,2]
if ((ylimmin == '') | (ylimmax == '')) plot(win[,1],type='b',main=main, xlab='j', pch=19, ylab='Winsorized Mean(j/n)', ylim=c(min(lb),max(ub))) else plot(win[,1],type='l',main=main, xlab='j', pch=19, ylab='Winsorized Mean(j/n)', ylim=c(ylimmin,ylimmax))
lines(ub,lty=3)
lines(lb,lty=3)
grid()
dev.off()
bitmap(file='test2.png')
lb <- tri[,1] - 2*tri[,2]
ub <- tri[,1] + 2*tri[,2]
if ((ylimmin == '') | (ylimmax == '')) plot(tri[,1],type='b',main=main, xlab='j', pch=19, ylab='Trimmed Mean(j/n)', ylim=c(min(lb),max(ub))) else plot(tri[,1],type='l',main=main, xlab='j', pch=19, ylab='Trimmed Mean(j/n)', ylim=c(ylimmin,ylimmax))
lines(ub,lty=3)
lines(lb,lty=3)
grid()
dev.off()
load(file='createtable')
a<-table.start()
a<-table.row.start(a)
a<-table.element(a,'Central Tendency - Ungrouped Data',4,TRUE)
a<-table.row.end(a)
a<-table.row.start(a)
a<-table.element(a,'Measure',header=TRUE)
a<-table.element(a,'Value',header=TRUE)
a<-table.element(a,'S.E.',header=TRUE)
a<-table.element(a,'Value/S.E.',header=TRUE)
a<-table.row.end(a)
a<-table.row.start(a)
a<-table.element(a,hyperlink('arithmetic_mean.htm', 'Arithmetic Mean', 'click to view the definition of the Arithmetic Mean'),header=TRUE)
a<-table.element(a,arm)
a<-table.element(a,hyperlink('arithmetic_mean_standard_error.htm', armse, 'click to view the definition of the Standard Error of the Arithmetic Mean'))
a<-table.element(a,armose)
a<-table.row.end(a)
a<-table.row.start(a)
a<-table.element(a,hyperlink('geometric_mean.htm', 'Geometric Mean', 'click to view the definition of the Geometric Mean'),header=TRUE)
a<-table.element(a,geo)
a<-table.element(a,'')
a<-table.row.end(a)
a<-table.row.start(a)
a<-table.element(a,hyperlink('harmonic_mean.htm', 'Harmonic Mean', 'click to view the definition of the Harmonic Mean'),header=TRUE)
a<-table.element(a,har)
a<-table.element(a,'')
a<-table.row.end(a)
a<-table.row.start(a)
a<-table.element(a,hyperlink('quadratic_mean.htm', 'Quadratic Mean', 'click to view the definition of the Quadratic Mean'),header=TRUE)
a<-table.element(a,qua)
a<-table.element(a,'')
a<-table.row.end(a)
for (j in 1:length(win[,1])) {
a<-table.row.start(a)
mylabel <- paste('Winsorized Mean (',j)
mylabel <- paste(mylabel,'/')
mylabel <- paste(mylabel,length(win[,1]))
mylabel <- paste(mylabel,')')
a<-table.element(a,hyperlink('winsorized_mean.htm', mylabel, 'click to view the definition of the Winsorized Mean'),header=TRUE)
a<-table.element(a,win[j,1])
a<-table.element(a,win[j,2])
a<-table.element(a,win[j,1]/win[j,2])
a<-table.row.end(a)
}
for (j in 1:length(tri[,1])) {
a<-table.row.start(a)
mylabel <- paste('Trimmed Mean (',j)
mylabel <- paste(mylabel,'/')
mylabel <- paste(mylabel,length(tri[,1]))
mylabel <- paste(mylabel,')')
a<-table.element(a,hyperlink('arithmetic_mean.htm', mylabel, 'click to view the definition of the Trimmed Mean'),header=TRUE)
a<-table.element(a,tri[j,1])
a<-table.element(a,tri[j,2])
a<-table.element(a,tri[j,1]/tri[j,2])
a<-table.row.end(a)
}
a<-table.row.start(a)
a<-table.element(a,hyperlink('median_1.htm', 'Median', 'click to view the definition of the Median'),header=TRUE)
a<-table.element(a,median(x))
a<-table.element(a,'')
a<-table.row.end(a)
a<-table.row.start(a)
a<-table.element(a,hyperlink('midrange.htm', 'Midrange', 'click to view the definition of the Midrange'),header=TRUE)
a<-table.element(a,midr)
a<-table.element(a,'')
a<-table.row.end(a)
a<-table.row.start(a)
mymid <- hyperlink('midmean.htm', 'Midmean', 'click to view the definition of the Midmean')
mylabel <- paste(mymid,hyperlink('method_1.htm','Weighted Average at Xnp',''),sep=' - ')
a<-table.element(a,mylabel,header=TRUE)
a<-table.element(a,midm[1])
a<-table.element(a,'')
a<-table.row.end(a)
a<-table.row.start(a)
mymid <- hyperlink('midmean.htm', 'Midmean', 'click to view the definition of the Midmean')
mylabel <- paste(mymid,hyperlink('method_2.htm','Weighted Average at X(n+1)p',''),sep=' - ')
a<-table.element(a,mylabel,header=TRUE)
a<-table.element(a,midm[2])
a<-table.element(a,'')
a<-table.row.end(a)
a<-table.row.start(a)
mymid <- hyperlink('midmean.htm', 'Midmean', 'click to view the definition of the Midmean')
mylabel <- paste(mymid,hyperlink('method_3.htm','Empirical Distribution Function',''),sep=' - ')
a<-table.element(a,mylabel,header=TRUE)
a<-table.element(a,midm[3])
a<-table.element(a,'')
a<-table.row.end(a)
a<-table.row.start(a)
mymid <- hyperlink('midmean.htm', 'Midmean', 'click to view the definition of the Midmean')
mylabel <- paste(mymid,hyperlink('method_4.htm','Empirical Distribution Function - Averaging',''),sep=' - ')
a<-table.element(a,mylabel,header=TRUE)
a<-table.element(a,midm[4])
a<-table.element(a,'')
a<-table.row.end(a)
a<-table.row.start(a)
mymid <- hyperlink('midmean.htm', 'Midmean', 'click to view the definition of the Midmean')
mylabel <- paste(mymid,hyperlink('method_5.htm','Empirical Distribution Function - Interpolation',''),sep=' - ')
a<-table.element(a,mylabel,header=TRUE)
a<-table.element(a,midm[5])
a<-table.element(a,'')
a<-table.row.end(a)
a<-table.row.start(a)
mymid <- hyperlink('midmean.htm', 'Midmean', 'click to view the definition of the Midmean')
mylabel <- paste(mymid,hyperlink('method_6.htm','Closest Observation',''),sep=' - ')
a<-table.element(a,mylabel,header=TRUE)
a<-table.element(a,midm[6])
a<-table.element(a,'')
a<-table.row.end(a)
a<-table.row.start(a)
mymid <- hyperlink('midmean.htm', 'Midmean', 'click to view the definition of the Midmean')
mylabel <- paste(mymid,hyperlink('method_7.htm','True Basic - Statistics Graphics Toolkit',''),sep=' - ')
a<-table.element(a,mylabel,header=TRUE)
a<-table.element(a,midm[7])
a<-table.element(a,'')
a<-table.row.end(a)
a<-table.row.start(a)
mymid <- hyperlink('midmean.htm', 'Midmean', 'click to view the definition of the Midmean')
mylabel <- paste(mymid,hyperlink('method_8.htm','MS Excel (old versions)',''),sep=' - ')
a<-table.element(a,mylabel,header=TRUE)
a<-table.element(a,midm[8])
a<-table.element(a,'')
a<-table.row.end(a)
a<-table.row.start(a)
a<-table.element(a,'Number of observations',header=TRUE)
a<-table.element(a,length(x))
a<-table.element(a,'')
a<-table.row.end(a)
a<-table.end(a)
table.save(a,file='mytable.tab')