Free Statistics
of Irreproducible Research!
Description of Statistical Computation | |||||||||||||||||||||
|---|---|---|---|---|---|---|---|---|---|---|---|---|---|---|---|---|---|---|---|---|---|
| Author's title | |||||||||||||||||||||
| Author | *The author of this computation has been verified* | ||||||||||||||||||||
| R Software Module | rwasp_backtobackhist.wasp | ||||||||||||||||||||
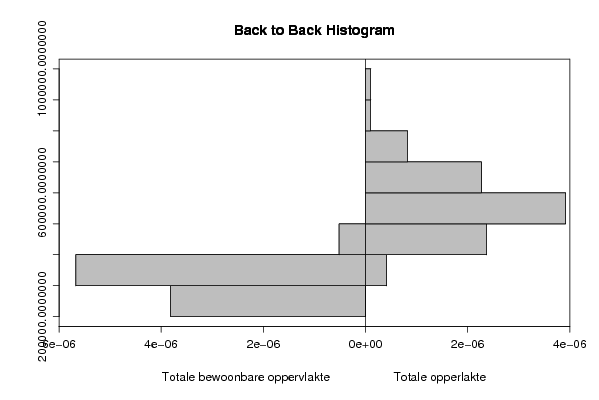
| Title produced by software | Back to Back Histogram | ||||||||||||||||||||
| Date of computation | Mon, 20 Oct 2008 12:09:25 -0600 | ||||||||||||||||||||
| Cite this page as follows | Statistical Computations at FreeStatistics.org, Office for Research Development and Education, URL https://freestatistics.org/blog/index.php?v=date/2008/Oct/20/t1224526212egej5l1qv6g8qcq.htm/, Retrieved Fri, 17 May 2024 05:45:20 +0000 | ||||||||||||||||||||
| Statistical Computations at FreeStatistics.org, Office for Research Development and Education, URL https://freestatistics.org/blog/index.php?pk=17824, Retrieved Fri, 17 May 2024 05:45:20 +0000 | |||||||||||||||||||||
| QR Codes: | |||||||||||||||||||||
|
| |||||||||||||||||||||
| Original text written by user: | |||||||||||||||||||||
| IsPrivate? | No (this computation is public) | ||||||||||||||||||||
| User-defined keywords | |||||||||||||||||||||
| Estimated Impact | 125 | ||||||||||||||||||||
Tree of Dependent Computations | |||||||||||||||||||||
| Family? (F = Feedback message, R = changed R code, M = changed R Module, P = changed Parameters, D = changed Data) | |||||||||||||||||||||
| F [Pearson Correlation] [Relatie aantal ge...] [2008-10-20 16:55:30] [c5a66f1c8528a963efc2b82a8519f117] - RMPD [Back to Back Histogram] [totale oppervlakt...] [2008-10-20 18:09:25] [b4fc5040f26b33db57f84cfb8d1d2b82] [Current] | |||||||||||||||||||||
| Feedback Forum | |||||||||||||||||||||
Post a new message | |||||||||||||||||||||
Dataset | |||||||||||||||||||||
| Dataseries X: | |||||||||||||||||||||
310301 308956 306337 300552 309661 315575 265784 260722 278629 311448 363932 362673 320253 273036 291047 239167 285034 331389 228493 205450 207203 287602 265812 262920 268006 292400 315810 269544 301433 280678 221915 263552 244831 245227 302493 280810 277643 292792 318530 276807 284524 290486 259355 383556 350488 318029 377740 293546 317460 401629 282854 275316 304680 349947 266543 329195 314626 338463 399338 339542 454688 396766 309465 365707 383677 352609 340011 425915 498938 391142 418962 342378 369674 391250 310589 335910 344448 361944 290274 327902 329809 324543 350735 320091 278048 381754 301833 318723 266695 381119 295943 266463 311750 359897 312936 339327 312658 | |||||||||||||||||||||
| Dataseries Y: | |||||||||||||||||||||
501852 500983 492092 471353 503961 519240 427730 426894 458031 512057 604919 589011 526981 450468 472746 395490 476078 545870 415570 380319 383600 505737 495066 472665 480579 536266 561722 475908 523232 507509 399927 466682 421751 442511 546678 499944 495574 524944 568106 484506 512235 523179 462411 685872 635902 573599 668826 520868 555680 727941 516959 489975 559687 630947 473994 583802 553061 604700 708101 617053 819858 736520 567696 666627 701749 647394 610231 777555 901319 707164 782859 652556 676064 707665 561515 645794 623482 673401 544890 605125 607570 578585 647408 574998 507468 695738 562270 585810 516493 691302 549560 496171 561565 671145 578514 623296 587012 | |||||||||||||||||||||
Tables (Output of Computation) | |||||||||||||||||||||
| |||||||||||||||||||||
Figures (Output of Computation) | |||||||||||||||||||||
Input Parameters & R Code | |||||||||||||||||||||
| Parameters (Session): | |||||||||||||||||||||
| par1 = grey ; par2 = grey ; par3 = TRUE ; par4 = Totale bewoonbare oppervlakte ; par5 = Totale opperlakte ; | |||||||||||||||||||||
| Parameters (R input): | |||||||||||||||||||||
| par1 = grey ; par2 = grey ; par3 = TRUE ; par4 = Totale bewoonbare oppervlakte ; par5 = Totale opperlakte ; | |||||||||||||||||||||
| R code (references can be found in the software module): | |||||||||||||||||||||
if (par3 == 'TRUE') par3 <- TRUE | |||||||||||||||||||||