Free Statistics
of Irreproducible Research!
Description of Statistical Computation | |||||||||||||||||||||
|---|---|---|---|---|---|---|---|---|---|---|---|---|---|---|---|---|---|---|---|---|---|
| Author's title | |||||||||||||||||||||
| Author | *Unverified author* | ||||||||||||||||||||
| R Software Module | rwasp_backtobackhist.wasp | ||||||||||||||||||||
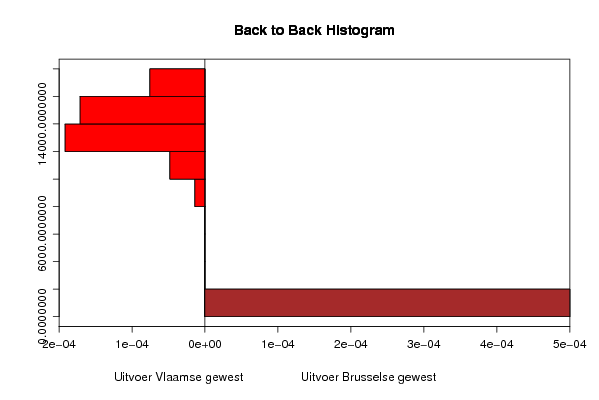
| Title produced by software | Back to Back Histogram | ||||||||||||||||||||
| Date of computation | Mon, 20 Oct 2008 16:16:43 -0600 | ||||||||||||||||||||
| Cite this page as follows | Statistical Computations at FreeStatistics.org, Office for Research Development and Education, URL https://freestatistics.org/blog/index.php?v=date/2008/Oct/21/t1224541046zes2h11ebgwi1r3.htm/, Retrieved Fri, 17 May 2024 02:42:26 +0000 | ||||||||||||||||||||
| Statistical Computations at FreeStatistics.org, Office for Research Development and Education, URL https://freestatistics.org/blog/index.php?pk=18251, Retrieved Fri, 17 May 2024 02:42:26 +0000 | |||||||||||||||||||||
| QR Codes: | |||||||||||||||||||||
|
| |||||||||||||||||||||
| Original text written by user: | |||||||||||||||||||||
| IsPrivate? | No (this computation is public) | ||||||||||||||||||||
| User-defined keywords | |||||||||||||||||||||
| Estimated Impact | 164 | ||||||||||||||||||||
Tree of Dependent Computations | |||||||||||||||||||||
| Family? (F = Feedback message, R = changed R code, M = changed R Module, P = changed Parameters, D = changed Data) | |||||||||||||||||||||
| - [Back to Back Histogram] [B2B Uitvoer Vlaam...] [2008-10-20 22:16:43] [2cd04a6a1efa7ed8c62c55b6a1308fc1] [Current] | |||||||||||||||||||||
| Feedback Forum | |||||||||||||||||||||
Post a new message | |||||||||||||||||||||
Dataset | |||||||||||||||||||||
| Dataseries X: | |||||||||||||||||||||
12710.3 12120.8 12469.5 12054.6 12112.9 9617.2 12645.8 13581.3 12162.3 10969.7 11880 11887.6 12926.9 12300 12092.8 12380.8 12196.9 9455 13168 13427.9 11980.5 11884.8 11691.7 12233.8 14341.4 13130.7 12421.1 14285.8 12864.6 11160.2 14316.2 14388.7 14013.9 13419 12769.6 13315.5 15332.9 14243 13824.4 14962.9 13202.9 12199 15508.9 14199.8 15169.6 14058 13786.2 14147.9 16541.7 13587.5 15582.4 15802.8 14130.5 12923.2 15612.2 16033.7 16036.6 14037.8 15330.6 15038.3 17401.8 14992.5 16043.7 16929.6 15921.3 14417.2 15961 17851.9 16483.9 14215.5 17429.7 17839.5 17629.2 | |||||||||||||||||||||
| Dataseries Y: | |||||||||||||||||||||
680,2 668,9 611,4 640,8 549,8 541,8 628,6 686,5 611,8 588,4 566,9 563,7 569,9 635,4 590,8 634,3 576,1 351,6 507,5 586,2 666,4 693,6 650,6 654,8 733,5 648,1 678,1 816,2 591 563,5 742,5 694,4 728,6 749 538,9 568,5 692,8 580,5 506,9 612,8 442,9 523,3 596,7 533,7 523,1 559,2 430,7 538,2 612,4 428 522,4 531,1 425,9 410,3 551 555,6 460,2 288,9 392,3 400,5 399 354,9 337,6 379,2 334,1 321,6 449,8 486,3 421,9 405,6 420 432,4 418,1 | |||||||||||||||||||||
Tables (Output of Computation) | |||||||||||||||||||||
| |||||||||||||||||||||
Figures (Output of Computation) | |||||||||||||||||||||
Input Parameters & R Code | |||||||||||||||||||||
| Parameters (Session): | |||||||||||||||||||||
| par1 = red ; par2 = brown ; par3 = TRUE ; par4 = Uitvoer Vlaamse gewest ; par5 = Uitvoer Brusselse gewest ; | |||||||||||||||||||||
| Parameters (R input): | |||||||||||||||||||||
| par1 = red ; par2 = brown ; par3 = TRUE ; par4 = Uitvoer Vlaamse gewest ; par5 = Uitvoer Brusselse gewest ; | |||||||||||||||||||||
| R code (references can be found in the software module): | |||||||||||||||||||||
if (par3 == 'TRUE') par3 <- TRUE | |||||||||||||||||||||