Free Statistics
of Irreproducible Research!
Description of Statistical Computation | |||||||||||||||||||||
|---|---|---|---|---|---|---|---|---|---|---|---|---|---|---|---|---|---|---|---|---|---|
| Author's title | |||||||||||||||||||||
| Author | *The author of this computation has been verified* | ||||||||||||||||||||
| R Software Module | rwasp_backtobackhist.wasp | ||||||||||||||||||||
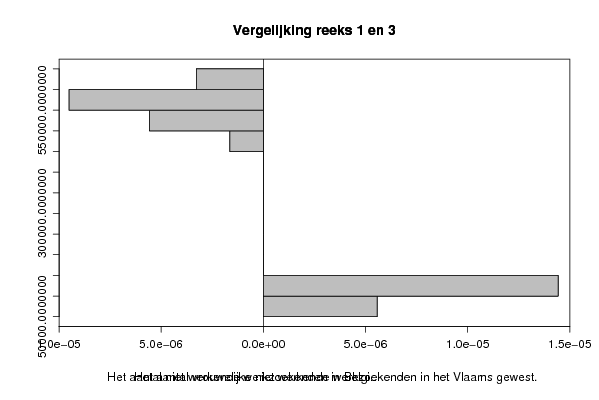
| Title produced by software | Back to Back Histogram | ||||||||||||||||||||
| Date of computation | Tue, 21 Oct 2008 01:39:27 -0600 | ||||||||||||||||||||
| Cite this page as follows | Statistical Computations at FreeStatistics.org, Office for Research Development and Education, URL https://freestatistics.org/blog/index.php?v=date/2008/Oct/21/t12245748055gevt64e6c04pmx.htm/, Retrieved Fri, 17 May 2024 02:43:17 +0000 | ||||||||||||||||||||
| Statistical Computations at FreeStatistics.org, Office for Research Development and Education, URL https://freestatistics.org/blog/index.php?pk=18366, Retrieved Fri, 17 May 2024 02:43:17 +0000 | |||||||||||||||||||||
| QR Codes: | |||||||||||||||||||||
|
| |||||||||||||||||||||
| Original text written by user: | |||||||||||||||||||||
| IsPrivate? | No (this computation is public) | ||||||||||||||||||||
| User-defined keywords | |||||||||||||||||||||
| Estimated Impact | 149 | ||||||||||||||||||||
Tree of Dependent Computations | |||||||||||||||||||||
| Family? (F = Feedback message, R = changed R code, M = changed R Module, P = changed Parameters, D = changed Data) | |||||||||||||||||||||
| F [Univariate Data Series] [Niet werkende wer...] [2008-10-13 17:23:56] [91d2608132ba5d00ecce3524d8276757] - RMPD [Back to Back Histogram] [Vergelijking reek...] [2008-10-21 07:37:01] [deb3c14ac9e4607a6d84fc9d0e0e6cc2] - PD [Back to Back Histogram] [Vergelijking reek...] [2008-10-21 07:39:27] [5e9e099b83e50415d7642e10d74756e4] [Current] - PD [Back to Back Histogram] [Vergelijking reek...] [2008-10-21 07:41:25] [deb3c14ac9e4607a6d84fc9d0e0e6cc2] - PD [Back to Back Histogram] [Vergelijking reek...] [2008-10-21 07:44:07] [deb3c14ac9e4607a6d84fc9d0e0e6cc2] | |||||||||||||||||||||
| Feedback Forum | |||||||||||||||||||||
Post a new message | |||||||||||||||||||||
Dataset | |||||||||||||||||||||
| Dataseries X: | |||||||||||||||||||||
577992 565464 547344 554788 562325 560854 555332 543599 536662 542722 593530 610763 612613 611324 594167 595454 590865 589379 584428 573100 567456 569028 620735 628884 628232 612117 595404 597141 593408 590072 579799 574205 572775 572942 619567 625809 619916 587625 565742 557274 560576 548854 531673 525919 511038 498662 555362 564591 541657 527070 509846 514258 516922 507561 492622 490243 469357 477580 528379 533590 517945 | |||||||||||||||||||||
| Dataseries Y: | |||||||||||||||||||||
121148 114624 109822 112081 113534 112110 109826 107423 105540 108573 128591 139145 129700 132828 126868 128390 126830 124105 122323 119296 116822 119224 139357 144322 133676 128283 121640 122877 117284 116463 112685 113235 111692 113152 129889 131153 123770 112516 105940 104320 103582 99064 94989 92241 89752 90610 109456 110213 97694 91844 87572 89812 89050 85990 85070 83277 79586 84215 99708 100698 90861 | |||||||||||||||||||||
Tables (Output of Computation) | |||||||||||||||||||||
| |||||||||||||||||||||
Figures (Output of Computation) | |||||||||||||||||||||
Input Parameters & R Code | |||||||||||||||||||||
| Parameters (Session): | |||||||||||||||||||||
| par1 = Niet werkende werkzoekenden, totaal, Belgi� ; par2 = http://www.nbb.be/belgostat/PublicatieSelectieLinker?LinkID=117000046|910000082&Lang=N ; | |||||||||||||||||||||
| Parameters (R input): | |||||||||||||||||||||
| par1 = grey ; par2 = grey ; par3 = TRUE ; par4 = Het aantal niet werkende werkzoekenden in Belgi�. ; par5 = Het aantal vrouwelijke niet werkende werkzoekenden in het Vlaams gewest. ; | |||||||||||||||||||||
| R code (references can be found in the software module): | |||||||||||||||||||||
if (par3 == 'TRUE') par3 <- TRUE | |||||||||||||||||||||