Free Statistics

of Irreproducible Research!

Author's title

Author*The author of this computation has been verified*
R Software Modulerwasp_tukeylambda.wasp
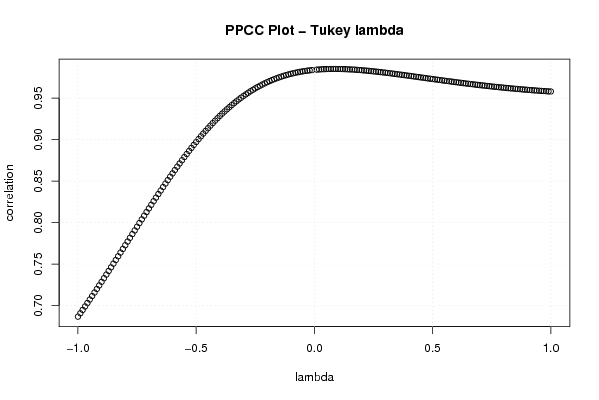
Title produced by softwareTukey lambda PPCC Plot
Date of computationMon, 27 Oct 2008 12:57:35 -0600
Cite this page as followsStatistical Computations at FreeStatistics.org, Office for Research Development and Education, URL https://freestatistics.org/blog/index.php?v=date/2008/Oct/27/t12251339787zd43a7pkdq9u1s.htm/, Retrieved Fri, 17 May 2024 10:08:15 +0000
Statistical Computations at FreeStatistics.org, Office for Research Development and Education, URL https://freestatistics.org/blog/index.php?pk=19413, Retrieved Fri, 17 May 2024 10:08:15 +0000
QR Codes:

Original text written by user:
IsPrivate?No (this computation is public)
User-defined keywords
Estimated Impact154
Family? (F = Feedback message, R = changed R code, M = changed R Module, P = changed Parameters, D = changed Data)
F     [Tukey lambda PPCC Plot] [Investigating Dis...] [2007-10-21 16:01:20] [b9964c45117f7aac638ab9056d451faa]
F    D  [Tukey lambda PPCC Plot] [] [2008-10-23 08:27:13] [2a30350413961f11db13c46be07a5f73]
F    D      [Tukey lambda PPCC Plot] [Investigating dis...] [2008-10-27 18:57:35] [c577d4c76516de948d1234ed72fcf120] [Current]
Feedback Forum
2008-11-02 21:24:08 [Bernard Femont] [reply
De maximale correlatie vinden we terug bij lambda = 0,14. In de tabel zien we dat de correlatie het grootst is bij lamda 0,14 namelijk: 0.984781652777975. Correcte benadering van de vraagstelling
  2008-11-04 06:27:48 [Nilay Erdogdu] [reply
volledig mee eens.
2008-11-03 11:30:00 [Michael Van Spaandonck] [reply
We zien inderdaad een maximale correlatiewaarde bij een lamba-waarde van 0,14.
Dit betekent dat de normaalverdeling de best benaderende verdeling is en dat diens implicaties op dit model mogen worden toegepast.
2008-11-04 07:50:44 [Evelyne Slegers] [reply
Er is inderdaad een maximale correlatiewaarde bij een lamba-waarde van 0.14.
Er is dus sprake van een min of meer normale verdeling.

Post a new message
Dataseries X:
93.5
94.7
112.9
99.2
105.6
113
83.1
81.1
96.9
104.3
97.7
102.6
89.9
96
112.7
107.1
106.2
121
101.2
83.2
105.1
113.3
99.1
100.3
93.5
98.8
106.2
98.3
102.1
117.1
101.5
80.5
105.9
109.5
97.2
114.5
93.5
100.9
121.1
116.5
109.3
118.1
108.3
105.4
116.2
111.2
105.8
122.7
99.5
107.9
124.6
115
110.3
132.7
99.7
96.5
118.7
112.9
130.5
137.9
115
116.8
140.9
120.7
134.2
147.3
112.4
107.1
128.4
137.7
135
151


Summary of computational transaction
Raw Inputview raw input (R code)
Raw Outputview raw output of R engine
Computing time3 seconds
R Server'Herman Ole Andreas Wold' @ 193.190.124.10:1001

\begin{tabular}{lllllllll}
\hline
Summary of computational transaction \tabularnewline
Raw Input & view raw input (R code)  \tabularnewline
Raw Output & view raw output of R engine  \tabularnewline
Computing time & 3 seconds \tabularnewline
R Server & 'Herman Ole Andreas Wold' @ 193.190.124.10:1001 \tabularnewline
\hline
\end{tabular}
%Source: https://freestatistics.org/blog/index.php?pk=19413&T=0

[TABLE]
[ROW][C]Summary of computational transaction[/C][/ROW]
[ROW][C]Raw Input[/C][C]view raw input (R code) [/C][/ROW]
[ROW][C]Raw Output[/C][C]view raw output of R engine [/C][/ROW]
[ROW][C]Computing time[/C][C]3 seconds[/C][/ROW]
[ROW][C]R Server[/C][C]'Herman Ole Andreas Wold' @ 193.190.124.10:1001[/C][/ROW]
[/TABLE]
Source: https://freestatistics.org/blog/index.php?pk=19413&T=0

Globally Unique Identifier (entire table): ba.freestatistics.org/blog/index.php?pk=19413&T=0

As an alternative you can also use a QR Code:  

The GUIDs for individual cells are displayed in the table below:

Summary of computational transaction
Raw Inputview raw input (R code)
Raw Outputview raw output of R engine
Computing time3 seconds
R Server'Herman Ole Andreas Wold' @ 193.190.124.10:1001


Tukey Lambda - Key Values
Distribution (lambda)Correlation
Approx. Cauchy (lambda=-1)0.686656811353184
Exact Logistic (lambda=0)0.984079992059653
Approx. Normal (lambda=0.14)0.984781652777975
U-shaped (lambda=0.5)0.972992313600855
Exactly Uniform (lambda=1)0.95797010458093

\begin{tabular}{lllllllll}
\hline
Tukey Lambda - Key Values \tabularnewline
Distribution (lambda) & Correlation \tabularnewline
Approx. Cauchy (lambda=-1) & 0.686656811353184 \tabularnewline
Exact Logistic (lambda=0) & 0.984079992059653 \tabularnewline
Approx. Normal (lambda=0.14) & 0.984781652777975 \tabularnewline
U-shaped (lambda=0.5) & 0.972992313600855 \tabularnewline
Exactly Uniform (lambda=1) & 0.95797010458093 \tabularnewline
\hline
\end{tabular}
%Source: https://freestatistics.org/blog/index.php?pk=19413&T=1

[TABLE]
[ROW][C]Tukey Lambda - Key Values[/C][/ROW]
[ROW][C]Distribution (lambda)[/C][C]Correlation[/C][/ROW]
[ROW][C]Approx. Cauchy (lambda=-1)[/C][C]0.686656811353184[/C][/ROW]
[ROW][C]Exact Logistic (lambda=0)[/C][C]0.984079992059653[/C][/ROW]
[ROW][C]Approx. Normal (lambda=0.14)[/C][C]0.984781652777975[/C][/ROW]
[ROW][C]U-shaped (lambda=0.5)[/C][C]0.972992313600855[/C][/ROW]
[ROW][C]Exactly Uniform (lambda=1)[/C][C]0.95797010458093[/C][/ROW]
[/TABLE]
Source: https://freestatistics.org/blog/index.php?pk=19413&T=1

Globally Unique Identifier (entire table): ba.freestatistics.org/blog/index.php?pk=19413&T=1

As an alternative you can also use a QR Code:  

The GUIDs for individual cells are displayed in the table below:

Tukey Lambda - Key Values
Distribution (lambda)Correlation
Approx. Cauchy (lambda=-1)0.686656811353184
Exact Logistic (lambda=0)0.984079992059653
Approx. Normal (lambda=0.14)0.984781652777975
U-shaped (lambda=0.5)0.972992313600855
Exactly Uniform (lambda=1)0.95797010458093


Parameters (Session):
Parameters (R input):
R code (references can be found in the software module):
gp <- function(lambda, p)
{
(p^lambda-(1-p)^lambda)/lambda
}
sortx <- sort(x)
c <- array(NA,dim=c(201))
for (i in 1:201)
{
if (i != 101) c[i] <- cor(gp(ppoints(x), lambda=(i-101)/100),sortx)
}
bitmap(file='test1.png')
plot((-100:100)/100,c[1:201],xlab='lambda',ylab='correlation',main='PPCC Plot - Tukey lambda')
grid()
dev.off()
load(file='createtable')
a<-table.start()
a<-table.row.start(a)
a<-table.element(a,'Tukey Lambda - Key Values',2,TRUE)
a<-table.row.end(a)
a<-table.row.start(a)
a<-table.element(a,'Distribution (lambda)',1,TRUE)
a<-table.element(a,'Correlation',1,TRUE)
a<-table.row.end(a)
a<-table.row.start(a)
a<-table.element(a,'Approx. Cauchy (lambda=-1)',header=TRUE)
a<-table.element(a,c[1])
a<-table.row.end(a)
a<-table.row.start(a)
a<-table.element(a,'Exact Logistic (lambda=0)',header=TRUE)
a<-table.element(a,(c[100]+c[102])/2)
a<-table.row.end(a)
a<-table.row.start(a)
a<-table.element(a,'Approx. Normal (lambda=0.14)',header=TRUE)
a<-table.element(a,c[115])
a<-table.row.end(a)
a<-table.row.start(a)
a<-table.element(a,'U-shaped (lambda=0.5)',header=TRUE)
a<-table.element(a,c[151])
a<-table.row.end(a)
a<-table.row.start(a)
a<-table.element(a,'Exactly Uniform (lambda=1)',header=TRUE)
a<-table.element(a,c[201])
a<-table.row.end(a)
a<-table.end(a)
table.save(a,file='mytable.tab')