Free Statistics
of Irreproducible Research!
Description of Statistical Computation | |||||||||||||||||||||||||||||||||||||||||
|---|---|---|---|---|---|---|---|---|---|---|---|---|---|---|---|---|---|---|---|---|---|---|---|---|---|---|---|---|---|---|---|---|---|---|---|---|---|---|---|---|---|
| Author's title | |||||||||||||||||||||||||||||||||||||||||
| Author | *The author of this computation has been verified* | ||||||||||||||||||||||||||||||||||||||||
| R Software Module | rwasp_univariatedataseries.wasp | ||||||||||||||||||||||||||||||||||||||||
| Title produced by software | Univariate Data Series | ||||||||||||||||||||||||||||||||||||||||
| Date of computation | Mon, 27 Oct 2008 15:45:45 -0600 | ||||||||||||||||||||||||||||||||||||||||
| Cite this page as follows | Statistical Computations at FreeStatistics.org, Office for Research Development and Education, URL https://freestatistics.org/blog/index.php?v=date/2008/Oct/27/t12251440127no2yn1k1hn0y8d.htm/, Retrieved Fri, 17 May 2024 03:07:56 +0000 | ||||||||||||||||||||||||||||||||||||||||
| Statistical Computations at FreeStatistics.org, Office for Research Development and Education, URL https://freestatistics.org/blog/index.php?pk=19659, Retrieved Fri, 17 May 2024 03:07:56 +0000 | |||||||||||||||||||||||||||||||||||||||||
| QR Codes: | |||||||||||||||||||||||||||||||||||||||||
|
| |||||||||||||||||||||||||||||||||||||||||
| Original text written by user: | |||||||||||||||||||||||||||||||||||||||||
| IsPrivate? | No (this computation is public) | ||||||||||||||||||||||||||||||||||||||||
| User-defined keywords | |||||||||||||||||||||||||||||||||||||||||
| Estimated Impact | 144 | ||||||||||||||||||||||||||||||||||||||||
Tree of Dependent Computations | |||||||||||||||||||||||||||||||||||||||||
| Family? (F = Feedback message, R = changed R code, M = changed R Module, P = changed Parameters, D = changed Data) | |||||||||||||||||||||||||||||||||||||||||
| F [Univariate Data Series] [Arbeidsinkomens] [2008-10-13 18:39:11] [87cabf13a90315c7085b765dcebb7412] - PD [Univariate Data Series] [Tijdreeks: Totaal...] [2008-10-19 18:19:54] [87cabf13a90315c7085b765dcebb7412] F P [Univariate Data Series] [Totaal aantal wer...] [2008-10-27 21:45:45] [f6a332ba2d530c028d935c5a5bbb53af] [Current] | |||||||||||||||||||||||||||||||||||||||||
| Feedback Forum | |||||||||||||||||||||||||||||||||||||||||
Post a new message | |||||||||||||||||||||||||||||||||||||||||
Dataset | |||||||||||||||||||||||||||||||||||||||||
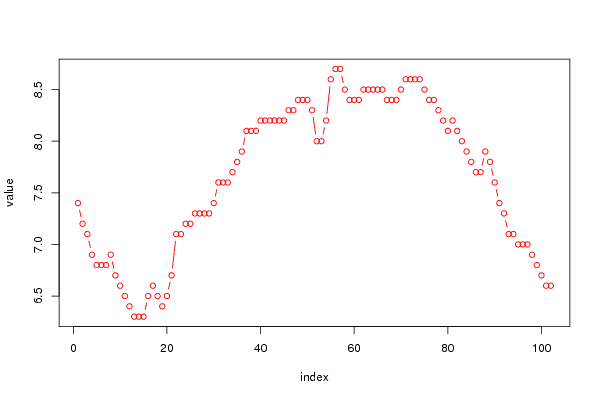
| Dataseries X: | |||||||||||||||||||||||||||||||||||||||||
7.4 7.2 7.1 6.9 6.8 6.8 6.8 6.9 6.7 6.6 6.5 6.4 6.3 6.3 6.3 6.5 6.6 6.5 6.4 6.5 6.7 7.1 7.1 7.2 7.2 7.3 7.3 7.3 7.3 7.4 7.6 7.6 7.6 7.7 7.8 7.9 8.1 8.1 8.1 8.2 8.2 8.2 8.2 8.2 8.2 8.3 8.3 8.4 8.4 8.4 8.3 8.0 8.0 8.2 8.6 8.7 8.7 8.5 8.4 8.4 8.4 8.5 8.5 8.5 8.5 8.5 8.4 8.4 8.4 8.5 8.6 8.6 8.6 8.6 8.5 8.4 8.4 8.3 8.2 8.1 8.2 8.1 8.0 7.9 7.8 7.7 7.7 7.9 7.8 7.6 7.4 7.3 7.1 7.1 7.0 7.0 7.0 6.9 6.8 6.7 6.6 6.6 | |||||||||||||||||||||||||||||||||||||||||
Tables (Output of Computation) | |||||||||||||||||||||||||||||||||||||||||
| |||||||||||||||||||||||||||||||||||||||||
Figures (Output of Computation) | |||||||||||||||||||||||||||||||||||||||||
Input Parameters & R Code | |||||||||||||||||||||||||||||||||||||||||
| Parameters (Session): | |||||||||||||||||||||||||||||||||||||||||
| par1 = Tijdreeks: Totaal aantal werkzoekenden in percenten van de beroepsbevolking ; par2 = http://www.nbb.be/belgostat/PublicatieSelectieLinker?LinkID=410000092|910000082&Lang=N ; par3 = Tijdreeks: Totaal aantal werkzoekenden in percenten van de beroepsbevolking ; | |||||||||||||||||||||||||||||||||||||||||
| Parameters (R input): | |||||||||||||||||||||||||||||||||||||||||
| par1 = Tijdreeks: Totaal aantal werkzoekenden in percenten van de beroepsbevolking ; par2 = http://www.nbb.be/belgostat/PublicatieSelectieLinker?LinkID=410000092|910000082&Lang=N ; par3 = Tijdreeks: Totaal aantal werkzoekenden in percenten van de beroepsbevolking ; | |||||||||||||||||||||||||||||||||||||||||
| R code (references can be found in the software module): | |||||||||||||||||||||||||||||||||||||||||
bitmap(file='test1.png') | |||||||||||||||||||||||||||||||||||||||||