Free Statistics
of Irreproducible Research!
Description of Statistical Computation | |||||||||||||||||||||||||||||||||||||||||
|---|---|---|---|---|---|---|---|---|---|---|---|---|---|---|---|---|---|---|---|---|---|---|---|---|---|---|---|---|---|---|---|---|---|---|---|---|---|---|---|---|---|
| Author's title | |||||||||||||||||||||||||||||||||||||||||
| Author | *The author of this computation has been verified* | ||||||||||||||||||||||||||||||||||||||||
| R Software Module | rwasp_univariatedataseries.wasp | ||||||||||||||||||||||||||||||||||||||||
| Title produced by software | Univariate Data Series | ||||||||||||||||||||||||||||||||||||||||
| Date of computation | Tue, 28 Oct 2008 01:28:46 -0600 | ||||||||||||||||||||||||||||||||||||||||
| Cite this page as follows | Statistical Computations at FreeStatistics.org, Office for Research Development and Education, URL https://freestatistics.org/blog/index.php?v=date/2008/Oct/28/t1225178961au4plru9jxbzzmz.htm/, Retrieved Wed, 15 May 2024 18:59:00 +0000 | ||||||||||||||||||||||||||||||||||||||||
| Statistical Computations at FreeStatistics.org, Office for Research Development and Education, URL https://freestatistics.org/blog/index.php?pk=19751, Retrieved Wed, 15 May 2024 18:59:00 +0000 | |||||||||||||||||||||||||||||||||||||||||
| QR Codes: | |||||||||||||||||||||||||||||||||||||||||
|
| |||||||||||||||||||||||||||||||||||||||||
| Original text written by user: | |||||||||||||||||||||||||||||||||||||||||
| IsPrivate? | No (this computation is public) | ||||||||||||||||||||||||||||||||||||||||
| User-defined keywords | |||||||||||||||||||||||||||||||||||||||||
| Estimated Impact | 190 | ||||||||||||||||||||||||||||||||||||||||
Tree of Dependent Computations | |||||||||||||||||||||||||||||||||||||||||
| Family? (F = Feedback message, R = changed R code, M = changed R Module, P = changed Parameters, D = changed Data) | |||||||||||||||||||||||||||||||||||||||||
| F [Univariate Data Series] [Prijsindexcijfer ...] [2008-10-13 23:09:34] [2f3410588adf1243d1e1cac6ff48a9c9] - PD [Univariate Data Series] [Bouwproductie] [2008-10-28 07:22:13] [f5709eefd05c649ca6dad46019ffd879] - PD [Univariate Data Series] [Bouwvergunningen] [2008-10-28 07:26:05] [f5709eefd05c649ca6dad46019ffd879] - PD [Univariate Data Series] [Werkloosheid] [2008-10-28 07:28:46] [28deb8481dba3cc87d2d53a86e0e0d0b] [Current] - PD [Univariate Data Series] [L.T.-rente] [2008-10-28 07:32:10] [f5709eefd05c649ca6dad46019ffd879] F RMPD [Tukey lambda PPCC Plot] [totale industriel...] [2008-10-28 07:37:41] [f5709eefd05c649ca6dad46019ffd879] F RMPD [Univariate Explorative Data Analysis] [Kledingproductie] [2008-10-28 07:43:38] [f5709eefd05c649ca6dad46019ffd879] - PD [Univariate Explorative Data Analysis] [Productie Kleding] [2008-10-28 15:31:05] [f5709eefd05c649ca6dad46019ffd879] - RMP [Central Tendency] [kleding productie...] [2008-10-28 15:58:15] [f5709eefd05c649ca6dad46019ffd879] F D [Univariate Explorative Data Analysis] [kledingproductie/...] [2008-10-28 16:22:17] [f5709eefd05c649ca6dad46019ffd879] - RMP [Harrell-Davis Quantiles] [q3 harrel davis] [2008-10-28 16:41:47] [f5709eefd05c649ca6dad46019ffd879] - RMP [Central Tendency] [central tendency,...] [2008-10-29 14:00:39] [f5709eefd05c649ca6dad46019ffd879] | |||||||||||||||||||||||||||||||||||||||||
| Feedback Forum | |||||||||||||||||||||||||||||||||||||||||
Post a new message | |||||||||||||||||||||||||||||||||||||||||
Dataset | |||||||||||||||||||||||||||||||||||||||||
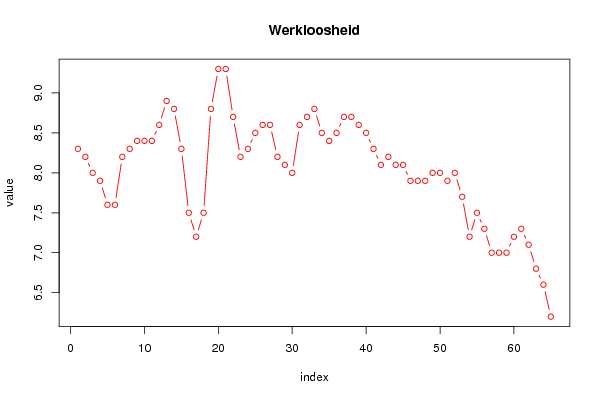
| Dataseries X: | |||||||||||||||||||||||||||||||||||||||||
8.3 8.2 8 7.9 7.6 7.6 8.2 8.3 8.4 8.4 8.4 8.6 8.9 8.8 8.3 7.5 7.2 7.5 8.8 9.3 9.3 8.7 8.2 8.3 8.5 8.6 8.6 8.2 8.1 8 8.6 8.7 8.8 8.5 8.4 8.5 8.7 8.7 8.6 8.5 8.3 8.1 8.2 8.1 8.1 7.9 7.9 7.9 8 8 7.9 8 7.7 7.2 7.5 7.3 7 7 7 7.2 7.3 7.1 6.8 6.6 6.2 | |||||||||||||||||||||||||||||||||||||||||
Tables (Output of Computation) | |||||||||||||||||||||||||||||||||||||||||
| |||||||||||||||||||||||||||||||||||||||||
Figures (Output of Computation) | |||||||||||||||||||||||||||||||||||||||||
Input Parameters & R Code | |||||||||||||||||||||||||||||||||||||||||
| Parameters (Session): | |||||||||||||||||||||||||||||||||||||||||
| par1 = Werkloosheid ; par2 = http://www.nbb.be/belgostat/PresentationLinker?Order=true&TableId=410000092&Lang=N&prop=null ; par3 = Werkloosheid in % ; | |||||||||||||||||||||||||||||||||||||||||
| Parameters (R input): | |||||||||||||||||||||||||||||||||||||||||
| par1 = Werkloosheid ; par2 = http://www.nbb.be/belgostat/PresentationLinker?Order=true&TableId=410000092&Lang=N&prop=null ; par3 = Werkloosheid in % ; | |||||||||||||||||||||||||||||||||||||||||
| R code (references can be found in the software module): | |||||||||||||||||||||||||||||||||||||||||
bitmap(file='test1.png') | |||||||||||||||||||||||||||||||||||||||||