Free Statistics

of Irreproducible Research!

Author's title

Author*The author of this computation has been verified*
R Software Modulerwasp_centraltendency.wasp
Title produced by softwareCentral Tendency
Date of computationWed, 29 Oct 2008 13:48:42 -0600
Cite this page as followsStatistical Computations at FreeStatistics.org, Office for Research Development and Education, URL https://freestatistics.org/blog/index.php?v=date/2008/Oct/29/t1225309779uv7p55imxgvze3o.htm/, Retrieved Fri, 17 May 2024 02:44:25 +0000
Statistical Computations at FreeStatistics.org, Office for Research Development and Education, URL https://freestatistics.org/blog/index.php?pk=19948, Retrieved Fri, 17 May 2024 02:44:25 +0000
QR Codes:

Original text written by user:
IsPrivate?No (this computation is public)
User-defined keywords
Estimated Impact164
Family? (F = Feedback message, R = changed R code, M = changed R Module, P = changed Parameters, D = changed Data)
F     [Univariate Explorative Data Analysis] [Q7] [2008-10-25 15:25:05] [57850c80fd59ccfb28f882be994e814e]
-   P   [Univariate Explorative Data Analysis] [Q7 bob] [2008-10-29 19:41:06] [ed2ba3b6182103c15c0ab511ae4e6284]
- RMP       [Central Tendency] [central tend bob] [2008-10-29 19:48:42] [a8228479d4547a92e2d3f176a5299609] [Current]
Feedback Forum

Post a new message
Dataseries X:
0.797974
0.806243
0.795912
0.80236
0.80157
0.807034
0.803075
0.804388
0.807334
0.808039
0.800208
0.808518
0.800323
0.807641
0.807843
0.808647
0.802774
0.800387
0.799744
0.801755
0.799294
0.800994
0.801697
0.805512
0.799396
0.808458
0.804788
0.803232
0.805114
0.804385
0.803292
0.798574
0.802943
0.801767
0.798419
0.803301
0.805025
0.812093
0.80564
0.807676
0.800135
0.794657
0.779268
0.787052
0.796981
0.784986
0.79138
0.801543
0.798333
0.80404
0.799443
0.802055
0.804435
0.803417
0.809433
0.810135
0.809626
0.815044
0.806292
0.809363
0.812224
0.810642
0.812912
0.805542
0.802734
0.797022
0.7978
0.796909
0.806619
0.806229


Summary of computational transaction
Raw Inputview raw input (R code)
Raw Outputview raw output of R engine
Computing time2 seconds
R Server'Sir Ronald Aylmer Fisher' @ 193.190.124.24

\begin{tabular}{lllllllll}
\hline
Summary of computational transaction \tabularnewline
Raw Input & view raw input (R code)  \tabularnewline
Raw Output & view raw output of R engine  \tabularnewline
Computing time & 2 seconds \tabularnewline
R Server & 'Sir Ronald Aylmer Fisher' @ 193.190.124.24 \tabularnewline
\hline
\end{tabular}
%Source: https://freestatistics.org/blog/index.php?pk=19948&T=0

[TABLE]
[ROW][C]Summary of computational transaction[/C][/ROW]
[ROW][C]Raw Input[/C][C]view raw input (R code) [/C][/ROW]
[ROW][C]Raw Output[/C][C]view raw output of R engine [/C][/ROW]
[ROW][C]Computing time[/C][C]2 seconds[/C][/ROW]
[ROW][C]R Server[/C][C]'Sir Ronald Aylmer Fisher' @ 193.190.124.24[/C][/ROW]
[/TABLE]
Source: https://freestatistics.org/blog/index.php?pk=19948&T=0

Globally Unique Identifier (entire table): ba.freestatistics.org/blog/index.php?pk=19948&T=0

As an alternative you can also use a QR Code:  

The GUIDs for individual cells are displayed in the table below:

Summary of computational transaction
Raw Inputview raw input (R code)
Raw Outputview raw output of R engine
Computing time2 seconds
R Server'Sir Ronald Aylmer Fisher' @ 193.190.124.24


Central Tendency - Ungrouped Data
MeasureValueS.E.Value/S.E.
Arithmetic Mean0.8028517142857140.0007425033933161991081.27682851385
Geometric Mean0.80282788043578
Harmonic Mean0.802803901291459
Quadratic Mean0.802875404786108
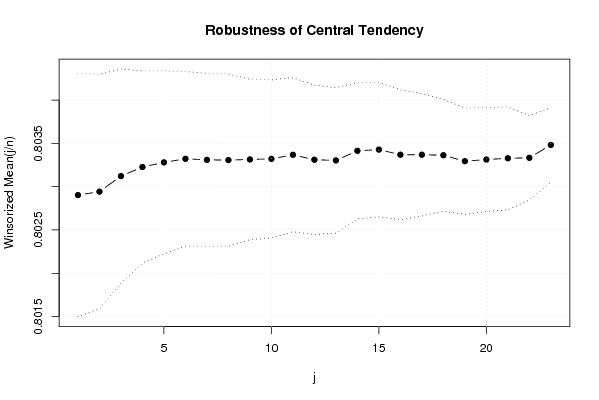
Winsorized Mean ( 1 / 23 )0.8029029428571430.0007016985464258831144.22774130964
Winsorized Mean ( 2 / 23 )0.8029423142857140.0006767300285104291186.50315555391
Winsorized Mean ( 3 / 23 )0.8031221857142860.0006182206224394851299.08669585492
Winsorized Mean ( 4 / 23 )0.8032265285714290.0005544210214591341448.76636614082
Winsorized Mean ( 5 / 23 )0.8032799571428570.0005283818053940911520.26422738712
Winsorized Mean ( 6 / 23 )0.8033217857142860.0005037848549528441594.57311552067
Winsorized Mean ( 7 / 23 )0.8033096857142860.0004989925143900761609.86319944334
Winsorized Mean ( 8 / 23 )0.8033063714285720.0004967140256318441617.24116891350
Winsorized Mean ( 9 / 23 )0.8033143428571430.00046306069292881734.79277149671
Winsorized Mean ( 10 / 23 )0.8033207714285710.0004557413477559631762.66817874670
Winsorized Mean ( 11 / 23 )0.8033677571428570.0004447544424196981806.31755530561
Winsorized Mean ( 12 / 23 )0.8033106714285710.0004306559134932171865.31903141096
Winsorized Mean ( 13 / 23 )0.8033030571428570.0004201922777291781911.75111899748
Winsorized Mean ( 14 / 23 )0.8034136571428570.0003922165877579772048.39285797523
Winsorized Mean ( 15 / 23 )0.8034280142857140.0003877246624457612072.16123219427
Winsorized Mean ( 16 / 23 )0.8033685857142860.0003751989073542962141.18050444021
Winsorized Mean ( 17 / 23 )0.8033688285714290.0003531543823790852274.83748937051
Winsorized Mean ( 18 / 23 )0.8033626571428570.0003225341299196522490.78340125737
Winsorized Mean ( 19 / 23 )0.8032937142857140.0003068708923515092617.69276365766
Winsorized Mean ( 20 / 23 )0.8033125714285710.0003001230145108872676.61103143902
Winsorized Mean ( 21 / 23 )0.8033275714285710.0002967637351873222706.96003647985
Winsorized Mean ( 22 / 23 )0.8033332285714290.0002439230720562073293.38763159852
Winsorized Mean ( 23 / 23 )0.8034814142857140.0002151217898519153735.0071084794
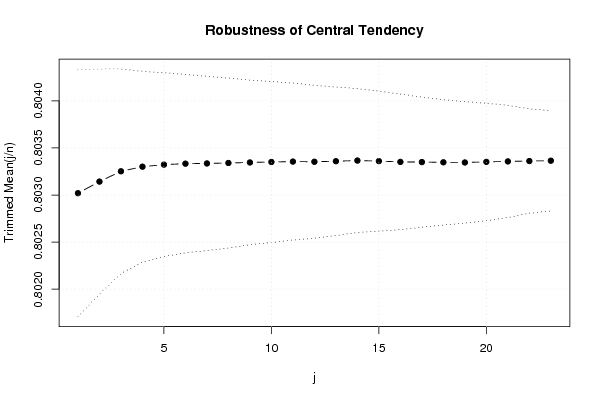
Trimmed Mean ( 1 / 23 )0.8030192352941180.0006552418831429961225.53099237533
Trimmed Mean ( 2 / 23 )0.8031425757575760.0005975890555242241343.97136013984
Trimmed Mean ( 3 / 23 )0.803252093750.0005432364778733451478.64167166123
Trimmed Mean ( 4 / 23 )0.8033009838709680.0005065959547724621585.68377086977
Trimmed Mean ( 5 / 23 )0.80332270.0004876940936520061647.18562405476
Trimmed Mean ( 6 / 23 )0.803333017241380.0004733174080026191697.23953452592
Trimmed Mean ( 7 / 23 )0.8033353571428570.0004628297900567851735.70365261989
Trimmed Mean ( 8 / 23 )0.8033401111111110.0004510298927207041781.1238768792
Trimmed Mean ( 9 / 23 )0.8033457884615380.0004368125664429971839.10869369728
Trimmed Mean ( 10 / 23 )0.803350680.0004272148190122551880.43729816628
Trimmed Mean ( 11 / 23 )0.8033550416666670.0004166018559080601928.35204710168
Trimmed Mean ( 12 / 23 )0.8033532826086960.0004054481645872771981.39578070717
Trimmed Mean ( 13 / 23 )0.8033589318181820.0003941827971734052038.03650889609
Trimmed Mean ( 14 / 23 )0.8033660952380950.0003817668682674862104.33686632863
Trimmed Mean ( 15 / 23 )0.803360150.0003719455597571742159.88638370754
Trimmed Mean ( 16 / 23 )0.8033518157894740.0003595605996625292234.25986201901
Trimmed Mean ( 17 / 23 )0.8033497777777780.0003457637924600652323.40631175418
Trimmed Mean ( 18 / 23 )0.8033474705882350.0003325225904306232415.91847804351
Trimmed Mean ( 19 / 23 )0.8033456250.0003222870444372492492.64014444867
Trimmed Mean ( 20 / 23 )0.8033520.000311671341780662577.56133563721
Trimmed Mean ( 21 / 23 )0.8033569285714290.0002976485220325792699.01198596745
Trimmed Mean ( 22 / 23 )0.8033606923076920.0002770945729653762899.22925487276
Trimmed Mean ( 23 / 23 )0.8033643333333330.0002661831576752213018.08852351787
Median0.803262
Midrange0.797156
Midmean - Weighted Average at Xnp0.803244514285714
Midmean - Weighted Average at X(n+1)p0.803349777777778
Midmean - Empirical Distribution Function0.803349777777778
Midmean - Empirical Distribution Function - Averaging0.803349777777778
Midmean - Empirical Distribution Function - Interpolation0.803347470588235
Midmean - Closest Observation0.803349777777778
Midmean - True Basic - Statistics Graphics Toolkit0.803349777777778
Midmean - MS Excel (old versions)0.803349777777778
Number of observations70

\begin{tabular}{lllllllll}
\hline
Central Tendency - Ungrouped Data \tabularnewline
Measure & Value & S.E. & Value/S.E. \tabularnewline
Arithmetic Mean & 0.802851714285714 & 0.000742503393316199 & 1081.27682851385 \tabularnewline
Geometric Mean & 0.80282788043578 &  &  \tabularnewline
Harmonic Mean & 0.802803901291459 &  &  \tabularnewline
Quadratic Mean & 0.802875404786108 &  &  \tabularnewline
Winsorized Mean ( 1 / 23 ) & 0.802902942857143 & 0.000701698546425883 & 1144.22774130964 \tabularnewline
Winsorized Mean ( 2 / 23 ) & 0.802942314285714 & 0.000676730028510429 & 1186.50315555391 \tabularnewline
Winsorized Mean ( 3 / 23 ) & 0.803122185714286 & 0.000618220622439485 & 1299.08669585492 \tabularnewline
Winsorized Mean ( 4 / 23 ) & 0.803226528571429 & 0.000554421021459134 & 1448.76636614082 \tabularnewline
Winsorized Mean ( 5 / 23 ) & 0.803279957142857 & 0.000528381805394091 & 1520.26422738712 \tabularnewline
Winsorized Mean ( 6 / 23 ) & 0.803321785714286 & 0.000503784854952844 & 1594.57311552067 \tabularnewline
Winsorized Mean ( 7 / 23 ) & 0.803309685714286 & 0.000498992514390076 & 1609.86319944334 \tabularnewline
Winsorized Mean ( 8 / 23 ) & 0.803306371428572 & 0.000496714025631844 & 1617.24116891350 \tabularnewline
Winsorized Mean ( 9 / 23 ) & 0.803314342857143 & 0.0004630606929288 & 1734.79277149671 \tabularnewline
Winsorized Mean ( 10 / 23 ) & 0.803320771428571 & 0.000455741347755963 & 1762.66817874670 \tabularnewline
Winsorized Mean ( 11 / 23 ) & 0.803367757142857 & 0.000444754442419698 & 1806.31755530561 \tabularnewline
Winsorized Mean ( 12 / 23 ) & 0.803310671428571 & 0.000430655913493217 & 1865.31903141096 \tabularnewline
Winsorized Mean ( 13 / 23 ) & 0.803303057142857 & 0.000420192277729178 & 1911.75111899748 \tabularnewline
Winsorized Mean ( 14 / 23 ) & 0.803413657142857 & 0.000392216587757977 & 2048.39285797523 \tabularnewline
Winsorized Mean ( 15 / 23 ) & 0.803428014285714 & 0.000387724662445761 & 2072.16123219427 \tabularnewline
Winsorized Mean ( 16 / 23 ) & 0.803368585714286 & 0.000375198907354296 & 2141.18050444021 \tabularnewline
Winsorized Mean ( 17 / 23 ) & 0.803368828571429 & 0.000353154382379085 & 2274.83748937051 \tabularnewline
Winsorized Mean ( 18 / 23 ) & 0.803362657142857 & 0.000322534129919652 & 2490.78340125737 \tabularnewline
Winsorized Mean ( 19 / 23 ) & 0.803293714285714 & 0.000306870892351509 & 2617.69276365766 \tabularnewline
Winsorized Mean ( 20 / 23 ) & 0.803312571428571 & 0.000300123014510887 & 2676.61103143902 \tabularnewline
Winsorized Mean ( 21 / 23 ) & 0.803327571428571 & 0.000296763735187322 & 2706.96003647985 \tabularnewline
Winsorized Mean ( 22 / 23 ) & 0.803333228571429 & 0.000243923072056207 & 3293.38763159852 \tabularnewline
Winsorized Mean ( 23 / 23 ) & 0.803481414285714 & 0.000215121789851915 & 3735.0071084794 \tabularnewline
Trimmed Mean ( 1 / 23 ) & 0.803019235294118 & 0.000655241883142996 & 1225.53099237533 \tabularnewline
Trimmed Mean ( 2 / 23 ) & 0.803142575757576 & 0.000597589055524224 & 1343.97136013984 \tabularnewline
Trimmed Mean ( 3 / 23 ) & 0.80325209375 & 0.000543236477873345 & 1478.64167166123 \tabularnewline
Trimmed Mean ( 4 / 23 ) & 0.803300983870968 & 0.000506595954772462 & 1585.68377086977 \tabularnewline
Trimmed Mean ( 5 / 23 ) & 0.8033227 & 0.000487694093652006 & 1647.18562405476 \tabularnewline
Trimmed Mean ( 6 / 23 ) & 0.80333301724138 & 0.000473317408002619 & 1697.23953452592 \tabularnewline
Trimmed Mean ( 7 / 23 ) & 0.803335357142857 & 0.000462829790056785 & 1735.70365261989 \tabularnewline
Trimmed Mean ( 8 / 23 ) & 0.803340111111111 & 0.000451029892720704 & 1781.1238768792 \tabularnewline
Trimmed Mean ( 9 / 23 ) & 0.803345788461538 & 0.000436812566442997 & 1839.10869369728 \tabularnewline
Trimmed Mean ( 10 / 23 ) & 0.80335068 & 0.000427214819012255 & 1880.43729816628 \tabularnewline
Trimmed Mean ( 11 / 23 ) & 0.803355041666667 & 0.000416601855908060 & 1928.35204710168 \tabularnewline
Trimmed Mean ( 12 / 23 ) & 0.803353282608696 & 0.000405448164587277 & 1981.39578070717 \tabularnewline
Trimmed Mean ( 13 / 23 ) & 0.803358931818182 & 0.000394182797173405 & 2038.03650889609 \tabularnewline
Trimmed Mean ( 14 / 23 ) & 0.803366095238095 & 0.000381766868267486 & 2104.33686632863 \tabularnewline
Trimmed Mean ( 15 / 23 ) & 0.80336015 & 0.000371945559757174 & 2159.88638370754 \tabularnewline
Trimmed Mean ( 16 / 23 ) & 0.803351815789474 & 0.000359560599662529 & 2234.25986201901 \tabularnewline
Trimmed Mean ( 17 / 23 ) & 0.803349777777778 & 0.000345763792460065 & 2323.40631175418 \tabularnewline
Trimmed Mean ( 18 / 23 ) & 0.803347470588235 & 0.000332522590430623 & 2415.91847804351 \tabularnewline
Trimmed Mean ( 19 / 23 ) & 0.803345625 & 0.000322287044437249 & 2492.64014444867 \tabularnewline
Trimmed Mean ( 20 / 23 ) & 0.803352 & 0.00031167134178066 & 2577.56133563721 \tabularnewline
Trimmed Mean ( 21 / 23 ) & 0.803356928571429 & 0.000297648522032579 & 2699.01198596745 \tabularnewline
Trimmed Mean ( 22 / 23 ) & 0.803360692307692 & 0.000277094572965376 & 2899.22925487276 \tabularnewline
Trimmed Mean ( 23 / 23 ) & 0.803364333333333 & 0.000266183157675221 & 3018.08852351787 \tabularnewline
Median & 0.803262 &  &  \tabularnewline
Midrange & 0.797156 &  &  \tabularnewline
Midmean - Weighted Average at Xnp & 0.803244514285714 &  &  \tabularnewline
Midmean - Weighted Average at X(n+1)p & 0.803349777777778 &  &  \tabularnewline
Midmean - Empirical Distribution Function & 0.803349777777778 &  &  \tabularnewline
Midmean - Empirical Distribution Function - Averaging & 0.803349777777778 &  &  \tabularnewline
Midmean - Empirical Distribution Function - Interpolation & 0.803347470588235 &  &  \tabularnewline
Midmean - Closest Observation & 0.803349777777778 &  &  \tabularnewline
Midmean - True Basic - Statistics Graphics Toolkit & 0.803349777777778 &  &  \tabularnewline
Midmean - MS Excel (old versions) & 0.803349777777778 &  &  \tabularnewline
Number of observations & 70 &  &  \tabularnewline
\hline
\end{tabular}
%Source: https://freestatistics.org/blog/index.php?pk=19948&T=1

[TABLE]
[ROW][C]Central Tendency - Ungrouped Data[/C][/ROW]
[ROW][C]Measure[/C][C]Value[/C][C]S.E.[/C][C]Value/S.E.[/C][/ROW]
[ROW][C]Arithmetic Mean[/C][C]0.802851714285714[/C][C]0.000742503393316199[/C][C]1081.27682851385[/C][/ROW]
[ROW][C]Geometric Mean[/C][C]0.80282788043578[/C][C][/C][C][/C][/ROW]
[ROW][C]Harmonic Mean[/C][C]0.802803901291459[/C][C][/C][C][/C][/ROW]
[ROW][C]Quadratic Mean[/C][C]0.802875404786108[/C][C][/C][C][/C][/ROW]
[ROW][C]Winsorized Mean ( 1 / 23 )[/C][C]0.802902942857143[/C][C]0.000701698546425883[/C][C]1144.22774130964[/C][/ROW]
[ROW][C]Winsorized Mean ( 2 / 23 )[/C][C]0.802942314285714[/C][C]0.000676730028510429[/C][C]1186.50315555391[/C][/ROW]
[ROW][C]Winsorized Mean ( 3 / 23 )[/C][C]0.803122185714286[/C][C]0.000618220622439485[/C][C]1299.08669585492[/C][/ROW]
[ROW][C]Winsorized Mean ( 4 / 23 )[/C][C]0.803226528571429[/C][C]0.000554421021459134[/C][C]1448.76636614082[/C][/ROW]
[ROW][C]Winsorized Mean ( 5 / 23 )[/C][C]0.803279957142857[/C][C]0.000528381805394091[/C][C]1520.26422738712[/C][/ROW]
[ROW][C]Winsorized Mean ( 6 / 23 )[/C][C]0.803321785714286[/C][C]0.000503784854952844[/C][C]1594.57311552067[/C][/ROW]
[ROW][C]Winsorized Mean ( 7 / 23 )[/C][C]0.803309685714286[/C][C]0.000498992514390076[/C][C]1609.86319944334[/C][/ROW]
[ROW][C]Winsorized Mean ( 8 / 23 )[/C][C]0.803306371428572[/C][C]0.000496714025631844[/C][C]1617.24116891350[/C][/ROW]
[ROW][C]Winsorized Mean ( 9 / 23 )[/C][C]0.803314342857143[/C][C]0.0004630606929288[/C][C]1734.79277149671[/C][/ROW]
[ROW][C]Winsorized Mean ( 10 / 23 )[/C][C]0.803320771428571[/C][C]0.000455741347755963[/C][C]1762.66817874670[/C][/ROW]
[ROW][C]Winsorized Mean ( 11 / 23 )[/C][C]0.803367757142857[/C][C]0.000444754442419698[/C][C]1806.31755530561[/C][/ROW]
[ROW][C]Winsorized Mean ( 12 / 23 )[/C][C]0.803310671428571[/C][C]0.000430655913493217[/C][C]1865.31903141096[/C][/ROW]
[ROW][C]Winsorized Mean ( 13 / 23 )[/C][C]0.803303057142857[/C][C]0.000420192277729178[/C][C]1911.75111899748[/C][/ROW]
[ROW][C]Winsorized Mean ( 14 / 23 )[/C][C]0.803413657142857[/C][C]0.000392216587757977[/C][C]2048.39285797523[/C][/ROW]
[ROW][C]Winsorized Mean ( 15 / 23 )[/C][C]0.803428014285714[/C][C]0.000387724662445761[/C][C]2072.16123219427[/C][/ROW]
[ROW][C]Winsorized Mean ( 16 / 23 )[/C][C]0.803368585714286[/C][C]0.000375198907354296[/C][C]2141.18050444021[/C][/ROW]
[ROW][C]Winsorized Mean ( 17 / 23 )[/C][C]0.803368828571429[/C][C]0.000353154382379085[/C][C]2274.83748937051[/C][/ROW]
[ROW][C]Winsorized Mean ( 18 / 23 )[/C][C]0.803362657142857[/C][C]0.000322534129919652[/C][C]2490.78340125737[/C][/ROW]
[ROW][C]Winsorized Mean ( 19 / 23 )[/C][C]0.803293714285714[/C][C]0.000306870892351509[/C][C]2617.69276365766[/C][/ROW]
[ROW][C]Winsorized Mean ( 20 / 23 )[/C][C]0.803312571428571[/C][C]0.000300123014510887[/C][C]2676.61103143902[/C][/ROW]
[ROW][C]Winsorized Mean ( 21 / 23 )[/C][C]0.803327571428571[/C][C]0.000296763735187322[/C][C]2706.96003647985[/C][/ROW]
[ROW][C]Winsorized Mean ( 22 / 23 )[/C][C]0.803333228571429[/C][C]0.000243923072056207[/C][C]3293.38763159852[/C][/ROW]
[ROW][C]Winsorized Mean ( 23 / 23 )[/C][C]0.803481414285714[/C][C]0.000215121789851915[/C][C]3735.0071084794[/C][/ROW]
[ROW][C]Trimmed Mean ( 1 / 23 )[/C][C]0.803019235294118[/C][C]0.000655241883142996[/C][C]1225.53099237533[/C][/ROW]
[ROW][C]Trimmed Mean ( 2 / 23 )[/C][C]0.803142575757576[/C][C]0.000597589055524224[/C][C]1343.97136013984[/C][/ROW]
[ROW][C]Trimmed Mean ( 3 / 23 )[/C][C]0.80325209375[/C][C]0.000543236477873345[/C][C]1478.64167166123[/C][/ROW]
[ROW][C]Trimmed Mean ( 4 / 23 )[/C][C]0.803300983870968[/C][C]0.000506595954772462[/C][C]1585.68377086977[/C][/ROW]
[ROW][C]Trimmed Mean ( 5 / 23 )[/C][C]0.8033227[/C][C]0.000487694093652006[/C][C]1647.18562405476[/C][/ROW]
[ROW][C]Trimmed Mean ( 6 / 23 )[/C][C]0.80333301724138[/C][C]0.000473317408002619[/C][C]1697.23953452592[/C][/ROW]
[ROW][C]Trimmed Mean ( 7 / 23 )[/C][C]0.803335357142857[/C][C]0.000462829790056785[/C][C]1735.70365261989[/C][/ROW]
[ROW][C]Trimmed Mean ( 8 / 23 )[/C][C]0.803340111111111[/C][C]0.000451029892720704[/C][C]1781.1238768792[/C][/ROW]
[ROW][C]Trimmed Mean ( 9 / 23 )[/C][C]0.803345788461538[/C][C]0.000436812566442997[/C][C]1839.10869369728[/C][/ROW]
[ROW][C]Trimmed Mean ( 10 / 23 )[/C][C]0.80335068[/C][C]0.000427214819012255[/C][C]1880.43729816628[/C][/ROW]
[ROW][C]Trimmed Mean ( 11 / 23 )[/C][C]0.803355041666667[/C][C]0.000416601855908060[/C][C]1928.35204710168[/C][/ROW]
[ROW][C]Trimmed Mean ( 12 / 23 )[/C][C]0.803353282608696[/C][C]0.000405448164587277[/C][C]1981.39578070717[/C][/ROW]
[ROW][C]Trimmed Mean ( 13 / 23 )[/C][C]0.803358931818182[/C][C]0.000394182797173405[/C][C]2038.03650889609[/C][/ROW]
[ROW][C]Trimmed Mean ( 14 / 23 )[/C][C]0.803366095238095[/C][C]0.000381766868267486[/C][C]2104.33686632863[/C][/ROW]
[ROW][C]Trimmed Mean ( 15 / 23 )[/C][C]0.80336015[/C][C]0.000371945559757174[/C][C]2159.88638370754[/C][/ROW]
[ROW][C]Trimmed Mean ( 16 / 23 )[/C][C]0.803351815789474[/C][C]0.000359560599662529[/C][C]2234.25986201901[/C][/ROW]
[ROW][C]Trimmed Mean ( 17 / 23 )[/C][C]0.803349777777778[/C][C]0.000345763792460065[/C][C]2323.40631175418[/C][/ROW]
[ROW][C]Trimmed Mean ( 18 / 23 )[/C][C]0.803347470588235[/C][C]0.000332522590430623[/C][C]2415.91847804351[/C][/ROW]
[ROW][C]Trimmed Mean ( 19 / 23 )[/C][C]0.803345625[/C][C]0.000322287044437249[/C][C]2492.64014444867[/C][/ROW]
[ROW][C]Trimmed Mean ( 20 / 23 )[/C][C]0.803352[/C][C]0.00031167134178066[/C][C]2577.56133563721[/C][/ROW]
[ROW][C]Trimmed Mean ( 21 / 23 )[/C][C]0.803356928571429[/C][C]0.000297648522032579[/C][C]2699.01198596745[/C][/ROW]
[ROW][C]Trimmed Mean ( 22 / 23 )[/C][C]0.803360692307692[/C][C]0.000277094572965376[/C][C]2899.22925487276[/C][/ROW]
[ROW][C]Trimmed Mean ( 23 / 23 )[/C][C]0.803364333333333[/C][C]0.000266183157675221[/C][C]3018.08852351787[/C][/ROW]
[ROW][C]Median[/C][C]0.803262[/C][C][/C][C][/C][/ROW]
[ROW][C]Midrange[/C][C]0.797156[/C][C][/C][C][/C][/ROW]
[ROW][C]Midmean - Weighted Average at Xnp[/C][C]0.803244514285714[/C][C][/C][C][/C][/ROW]
[ROW][C]Midmean - Weighted Average at X(n+1)p[/C][C]0.803349777777778[/C][C][/C][C][/C][/ROW]
[ROW][C]Midmean - Empirical Distribution Function[/C][C]0.803349777777778[/C][C][/C][C][/C][/ROW]
[ROW][C]Midmean - Empirical Distribution Function - Averaging[/C][C]0.803349777777778[/C][C][/C][C][/C][/ROW]
[ROW][C]Midmean - Empirical Distribution Function - Interpolation[/C][C]0.803347470588235[/C][C][/C][C][/C][/ROW]
[ROW][C]Midmean - Closest Observation[/C][C]0.803349777777778[/C][C][/C][C][/C][/ROW]
[ROW][C]Midmean - True Basic - Statistics Graphics Toolkit[/C][C]0.803349777777778[/C][C][/C][C][/C][/ROW]
[ROW][C]Midmean - MS Excel (old versions)[/C][C]0.803349777777778[/C][C][/C][C][/C][/ROW]
[ROW][C]Number of observations[/C][C]70[/C][C][/C][C][/C][/ROW]
[/TABLE]
Source: https://freestatistics.org/blog/index.php?pk=19948&T=1

Globally Unique Identifier (entire table): ba.freestatistics.org/blog/index.php?pk=19948&T=1

As an alternative you can also use a QR Code:  

The GUIDs for individual cells are displayed in the table below:

Central Tendency - Ungrouped Data
MeasureValueS.E.Value/S.E.
Arithmetic Mean0.8028517142857140.0007425033933161991081.27682851385
Geometric Mean0.80282788043578
Harmonic Mean0.802803901291459
Quadratic Mean0.802875404786108
Winsorized Mean ( 1 / 23 )0.8029029428571430.0007016985464258831144.22774130964
Winsorized Mean ( 2 / 23 )0.8029423142857140.0006767300285104291186.50315555391
Winsorized Mean ( 3 / 23 )0.8031221857142860.0006182206224394851299.08669585492
Winsorized Mean ( 4 / 23 )0.8032265285714290.0005544210214591341448.76636614082
Winsorized Mean ( 5 / 23 )0.8032799571428570.0005283818053940911520.26422738712
Winsorized Mean ( 6 / 23 )0.8033217857142860.0005037848549528441594.57311552067
Winsorized Mean ( 7 / 23 )0.8033096857142860.0004989925143900761609.86319944334
Winsorized Mean ( 8 / 23 )0.8033063714285720.0004967140256318441617.24116891350
Winsorized Mean ( 9 / 23 )0.8033143428571430.00046306069292881734.79277149671
Winsorized Mean ( 10 / 23 )0.8033207714285710.0004557413477559631762.66817874670
Winsorized Mean ( 11 / 23 )0.8033677571428570.0004447544424196981806.31755530561
Winsorized Mean ( 12 / 23 )0.8033106714285710.0004306559134932171865.31903141096
Winsorized Mean ( 13 / 23 )0.8033030571428570.0004201922777291781911.75111899748
Winsorized Mean ( 14 / 23 )0.8034136571428570.0003922165877579772048.39285797523
Winsorized Mean ( 15 / 23 )0.8034280142857140.0003877246624457612072.16123219427
Winsorized Mean ( 16 / 23 )0.8033685857142860.0003751989073542962141.18050444021
Winsorized Mean ( 17 / 23 )0.8033688285714290.0003531543823790852274.83748937051
Winsorized Mean ( 18 / 23 )0.8033626571428570.0003225341299196522490.78340125737
Winsorized Mean ( 19 / 23 )0.8032937142857140.0003068708923515092617.69276365766
Winsorized Mean ( 20 / 23 )0.8033125714285710.0003001230145108872676.61103143902
Winsorized Mean ( 21 / 23 )0.8033275714285710.0002967637351873222706.96003647985
Winsorized Mean ( 22 / 23 )0.8033332285714290.0002439230720562073293.38763159852
Winsorized Mean ( 23 / 23 )0.8034814142857140.0002151217898519153735.0071084794
Trimmed Mean ( 1 / 23 )0.8030192352941180.0006552418831429961225.53099237533
Trimmed Mean ( 2 / 23 )0.8031425757575760.0005975890555242241343.97136013984
Trimmed Mean ( 3 / 23 )0.803252093750.0005432364778733451478.64167166123
Trimmed Mean ( 4 / 23 )0.8033009838709680.0005065959547724621585.68377086977
Trimmed Mean ( 5 / 23 )0.80332270.0004876940936520061647.18562405476
Trimmed Mean ( 6 / 23 )0.803333017241380.0004733174080026191697.23953452592
Trimmed Mean ( 7 / 23 )0.8033353571428570.0004628297900567851735.70365261989
Trimmed Mean ( 8 / 23 )0.8033401111111110.0004510298927207041781.1238768792
Trimmed Mean ( 9 / 23 )0.8033457884615380.0004368125664429971839.10869369728
Trimmed Mean ( 10 / 23 )0.803350680.0004272148190122551880.43729816628
Trimmed Mean ( 11 / 23 )0.8033550416666670.0004166018559080601928.35204710168
Trimmed Mean ( 12 / 23 )0.8033532826086960.0004054481645872771981.39578070717
Trimmed Mean ( 13 / 23 )0.8033589318181820.0003941827971734052038.03650889609
Trimmed Mean ( 14 / 23 )0.8033660952380950.0003817668682674862104.33686632863
Trimmed Mean ( 15 / 23 )0.803360150.0003719455597571742159.88638370754
Trimmed Mean ( 16 / 23 )0.8033518157894740.0003595605996625292234.25986201901
Trimmed Mean ( 17 / 23 )0.8033497777777780.0003457637924600652323.40631175418
Trimmed Mean ( 18 / 23 )0.8033474705882350.0003325225904306232415.91847804351
Trimmed Mean ( 19 / 23 )0.8033456250.0003222870444372492492.64014444867
Trimmed Mean ( 20 / 23 )0.8033520.000311671341780662577.56133563721
Trimmed Mean ( 21 / 23 )0.8033569285714290.0002976485220325792699.01198596745
Trimmed Mean ( 22 / 23 )0.8033606923076920.0002770945729653762899.22925487276
Trimmed Mean ( 23 / 23 )0.8033643333333330.0002661831576752213018.08852351787
Median0.803262
Midrange0.797156
Midmean - Weighted Average at Xnp0.803244514285714
Midmean - Weighted Average at X(n+1)p0.803349777777778
Midmean - Empirical Distribution Function0.803349777777778
Midmean - Empirical Distribution Function - Averaging0.803349777777778
Midmean - Empirical Distribution Function - Interpolation0.803347470588235
Midmean - Closest Observation0.803349777777778
Midmean - True Basic - Statistics Graphics Toolkit0.803349777777778
Midmean - MS Excel (old versions)0.803349777777778
Number of observations70


Parameters (Session):
Parameters (R input):
R code (references can be found in the software module):
geomean <- function(x) {
return(exp(mean(log(x))))
}
harmean <- function(x) {
return(1/mean(1/x))
}
quamean <- function(x) {
return(sqrt(mean(x*x)))
}
winmean <- function(x) {
x <-sort(x[!is.na(x)])
n<-length(x)
denom <- 3
nodenom <- n/denom
if (nodenom>40) denom <- n/40
sqrtn = sqrt(n)
roundnodenom = floor(nodenom)
win <- array(NA,dim=c(roundnodenom,2))
for (j in 1:roundnodenom) {
win[j,1] <- (j*x[j+1]+sum(x[(j+1):(n-j)])+j*x[n-j])/n
win[j,2] <- sd(c(rep(x[j+1],j),x[(j+1):(n-j)],rep(x[n-j],j)))/sqrtn
}
return(win)
}
trimean <- function(x) {
x <-sort(x[!is.na(x)])
n<-length(x)
denom <- 3
nodenom <- n/denom
if (nodenom>40) denom <- n/40
sqrtn = sqrt(n)
roundnodenom = floor(nodenom)
tri <- array(NA,dim=c(roundnodenom,2))
for (j in 1:roundnodenom) {
tri[j,1] <- mean(x,trim=j/n)
tri[j,2] <- sd(x[(j+1):(n-j)]) / sqrt(n-j*2)
}
return(tri)
}
midrange <- function(x) {
return((max(x)+min(x))/2)
}
q1 <- function(data,n,p,i,f) {
np <- n*p;
i <<- floor(np)
f <<- np - i
qvalue <- (1-f)*data[i] + f*data[i+1]
}
q2 <- function(data,n,p,i,f) {
np <- (n+1)*p
i <<- floor(np)
f <<- np - i
qvalue <- (1-f)*data[i] + f*data[i+1]
}
q3 <- function(data,n,p,i,f) {
np <- n*p
i <<- floor(np)
f <<- np - i
if (f==0) {
qvalue <- data[i]
} else {
qvalue <- data[i+1]
}
}
q4 <- function(data,n,p,i,f) {
np <- n*p
i <<- floor(np)
f <<- np - i
if (f==0) {
qvalue <- (data[i]+data[i+1])/2
} else {
qvalue <- data[i+1]
}
}
q5 <- function(data,n,p,i,f) {
np <- (n-1)*p
i <<- floor(np)
f <<- np - i
if (f==0) {
qvalue <- data[i+1]
} else {
qvalue <- data[i+1] + f*(data[i+2]-data[i+1])
}
}
q6 <- function(data,n,p,i,f) {
np <- n*p+0.5
i <<- floor(np)
f <<- np - i
qvalue <- data[i]
}
q7 <- function(data,n,p,i,f) {
np <- (n+1)*p
i <<- floor(np)
f <<- np - i
if (f==0) {
qvalue <- data[i]
} else {
qvalue <- f*data[i] + (1-f)*data[i+1]
}
}
q8 <- function(data,n,p,i,f) {
np <- (n+1)*p
i <<- floor(np)
f <<- np - i
if (f==0) {
qvalue <- data[i]
} else {
if (f == 0.5) {
qvalue <- (data[i]+data[i+1])/2
} else {
if (f < 0.5) {
qvalue <- data[i]
} else {
qvalue <- data[i+1]
}
}
}
}
midmean <- function(x,def) {
x <-sort(x[!is.na(x)])
n<-length(x)
if (def==1) {
qvalue1 <- q1(x,n,0.25,i,f)
qvalue3 <- q1(x,n,0.75,i,f)
}
if (def==2) {
qvalue1 <- q2(x,n,0.25,i,f)
qvalue3 <- q2(x,n,0.75,i,f)
}
if (def==3) {
qvalue1 <- q3(x,n,0.25,i,f)
qvalue3 <- q3(x,n,0.75,i,f)
}
if (def==4) {
qvalue1 <- q4(x,n,0.25,i,f)
qvalue3 <- q4(x,n,0.75,i,f)
}
if (def==5) {
qvalue1 <- q5(x,n,0.25,i,f)
qvalue3 <- q5(x,n,0.75,i,f)
}
if (def==6) {
qvalue1 <- q6(x,n,0.25,i,f)
qvalue3 <- q6(x,n,0.75,i,f)
}
if (def==7) {
qvalue1 <- q7(x,n,0.25,i,f)
qvalue3 <- q7(x,n,0.75,i,f)
}
if (def==8) {
qvalue1 <- q8(x,n,0.25,i,f)
qvalue3 <- q8(x,n,0.75,i,f)
}
midm <- 0
myn <- 0
roundno4 <- round(n/4)
round3no4 <- round(3*n/4)
for (i in 1:n) {
if ((x[i]>=qvalue1) & (x[i]<=qvalue3)){
midm = midm + x[i]
myn = myn + 1
}
}
midm = midm / myn
return(midm)
}
(arm <- mean(x))
sqrtn <- sqrt(length(x))
(armse <- sd(x) / sqrtn)
(armose <- arm / armse)
(geo <- geomean(x))
(har <- harmean(x))
(qua <- quamean(x))
(win <- winmean(x))
(tri <- trimean(x))
(midr <- midrange(x))
midm <- array(NA,dim=8)
for (j in 1:8) midm[j] <- midmean(x,j)
midm
bitmap(file='test1.png')
lb <- win[,1] - 2*win[,2]
ub <- win[,1] + 2*win[,2]
if ((ylimmin == '') | (ylimmax == '')) plot(win[,1],type='b',main=main, xlab='j', pch=19, ylab='Winsorized Mean(j/n)', ylim=c(min(lb),max(ub))) else plot(win[,1],type='l',main=main, xlab='j', pch=19, ylab='Winsorized Mean(j/n)', ylim=c(ylimmin,ylimmax))
lines(ub,lty=3)
lines(lb,lty=3)
grid()
dev.off()
bitmap(file='test2.png')
lb <- tri[,1] - 2*tri[,2]
ub <- tri[,1] + 2*tri[,2]
if ((ylimmin == '') | (ylimmax == '')) plot(tri[,1],type='b',main=main, xlab='j', pch=19, ylab='Trimmed Mean(j/n)', ylim=c(min(lb),max(ub))) else plot(tri[,1],type='l',main=main, xlab='j', pch=19, ylab='Trimmed Mean(j/n)', ylim=c(ylimmin,ylimmax))
lines(ub,lty=3)
lines(lb,lty=3)
grid()
dev.off()
load(file='createtable')
a<-table.start()
a<-table.row.start(a)
a<-table.element(a,'Central Tendency - Ungrouped Data',4,TRUE)
a<-table.row.end(a)
a<-table.row.start(a)
a<-table.element(a,'Measure',header=TRUE)
a<-table.element(a,'Value',header=TRUE)
a<-table.element(a,'S.E.',header=TRUE)
a<-table.element(a,'Value/S.E.',header=TRUE)
a<-table.row.end(a)
a<-table.row.start(a)
a<-table.element(a,hyperlink('arithmetic_mean.htm', 'Arithmetic Mean', 'click to view the definition of the Arithmetic Mean'),header=TRUE)
a<-table.element(a,arm)
a<-table.element(a,hyperlink('arithmetic_mean_standard_error.htm', armse, 'click to view the definition of the Standard Error of the Arithmetic Mean'))
a<-table.element(a,armose)
a<-table.row.end(a)
a<-table.row.start(a)
a<-table.element(a,hyperlink('geometric_mean.htm', 'Geometric Mean', 'click to view the definition of the Geometric Mean'),header=TRUE)
a<-table.element(a,geo)
a<-table.element(a,'')
a<-table.row.end(a)
a<-table.row.start(a)
a<-table.element(a,hyperlink('harmonic_mean.htm', 'Harmonic Mean', 'click to view the definition of the Harmonic Mean'),header=TRUE)
a<-table.element(a,har)
a<-table.element(a,'')
a<-table.row.end(a)
a<-table.row.start(a)
a<-table.element(a,hyperlink('quadratic_mean.htm', 'Quadratic Mean', 'click to view the definition of the Quadratic Mean'),header=TRUE)
a<-table.element(a,qua)
a<-table.element(a,'')
a<-table.row.end(a)
for (j in 1:length(win[,1])) {
a<-table.row.start(a)
mylabel <- paste('Winsorized Mean (',j)
mylabel <- paste(mylabel,'/')
mylabel <- paste(mylabel,length(win[,1]))
mylabel <- paste(mylabel,')')
a<-table.element(a,hyperlink('winsorized_mean.htm', mylabel, 'click to view the definition of the Winsorized Mean'),header=TRUE)
a<-table.element(a,win[j,1])
a<-table.element(a,win[j,2])
a<-table.element(a,win[j,1]/win[j,2])
a<-table.row.end(a)
}
for (j in 1:length(tri[,1])) {
a<-table.row.start(a)
mylabel <- paste('Trimmed Mean (',j)
mylabel <- paste(mylabel,'/')
mylabel <- paste(mylabel,length(tri[,1]))
mylabel <- paste(mylabel,')')
a<-table.element(a,hyperlink('arithmetic_mean.htm', mylabel, 'click to view the definition of the Trimmed Mean'),header=TRUE)
a<-table.element(a,tri[j,1])
a<-table.element(a,tri[j,2])
a<-table.element(a,tri[j,1]/tri[j,2])
a<-table.row.end(a)
}
a<-table.row.start(a)
a<-table.element(a,hyperlink('median_1.htm', 'Median', 'click to view the definition of the Median'),header=TRUE)
a<-table.element(a,median(x))
a<-table.element(a,'')
a<-table.row.end(a)
a<-table.row.start(a)
a<-table.element(a,hyperlink('midrange.htm', 'Midrange', 'click to view the definition of the Midrange'),header=TRUE)
a<-table.element(a,midr)
a<-table.element(a,'')
a<-table.row.end(a)
a<-table.row.start(a)
mymid <- hyperlink('midmean.htm', 'Midmean', 'click to view the definition of the Midmean')
mylabel <- paste(mymid,hyperlink('method_1.htm','Weighted Average at Xnp',''),sep=' - ')
a<-table.element(a,mylabel,header=TRUE)
a<-table.element(a,midm[1])
a<-table.element(a,'')
a<-table.row.end(a)
a<-table.row.start(a)
mymid <- hyperlink('midmean.htm', 'Midmean', 'click to view the definition of the Midmean')
mylabel <- paste(mymid,hyperlink('method_2.htm','Weighted Average at X(n+1)p',''),sep=' - ')
a<-table.element(a,mylabel,header=TRUE)
a<-table.element(a,midm[2])
a<-table.element(a,'')
a<-table.row.end(a)
a<-table.row.start(a)
mymid <- hyperlink('midmean.htm', 'Midmean', 'click to view the definition of the Midmean')
mylabel <- paste(mymid,hyperlink('method_3.htm','Empirical Distribution Function',''),sep=' - ')
a<-table.element(a,mylabel,header=TRUE)
a<-table.element(a,midm[3])
a<-table.element(a,'')
a<-table.row.end(a)
a<-table.row.start(a)
mymid <- hyperlink('midmean.htm', 'Midmean', 'click to view the definition of the Midmean')
mylabel <- paste(mymid,hyperlink('method_4.htm','Empirical Distribution Function - Averaging',''),sep=' - ')
a<-table.element(a,mylabel,header=TRUE)
a<-table.element(a,midm[4])
a<-table.element(a,'')
a<-table.row.end(a)
a<-table.row.start(a)
mymid <- hyperlink('midmean.htm', 'Midmean', 'click to view the definition of the Midmean')
mylabel <- paste(mymid,hyperlink('method_5.htm','Empirical Distribution Function - Interpolation',''),sep=' - ')
a<-table.element(a,mylabel,header=TRUE)
a<-table.element(a,midm[5])
a<-table.element(a,'')
a<-table.row.end(a)
a<-table.row.start(a)
mymid <- hyperlink('midmean.htm', 'Midmean', 'click to view the definition of the Midmean')
mylabel <- paste(mymid,hyperlink('method_6.htm','Closest Observation',''),sep=' - ')
a<-table.element(a,mylabel,header=TRUE)
a<-table.element(a,midm[6])
a<-table.element(a,'')
a<-table.row.end(a)
a<-table.row.start(a)
mymid <- hyperlink('midmean.htm', 'Midmean', 'click to view the definition of the Midmean')
mylabel <- paste(mymid,hyperlink('method_7.htm','True Basic - Statistics Graphics Toolkit',''),sep=' - ')
a<-table.element(a,mylabel,header=TRUE)
a<-table.element(a,midm[7])
a<-table.element(a,'')
a<-table.row.end(a)
a<-table.row.start(a)
mymid <- hyperlink('midmean.htm', 'Midmean', 'click to view the definition of the Midmean')
mylabel <- paste(mymid,hyperlink('method_8.htm','MS Excel (old versions)',''),sep=' - ')
a<-table.element(a,mylabel,header=TRUE)
a<-table.element(a,midm[8])
a<-table.element(a,'')
a<-table.row.end(a)
a<-table.row.start(a)
a<-table.element(a,'Number of observations',header=TRUE)
a<-table.element(a,length(x))
a<-table.element(a,'')
a<-table.row.end(a)
a<-table.end(a)
table.save(a,file='mytable.tab')