Free Statistics

of Irreproducible Research!

Author's title

Author*The author of this computation has been verified*
R Software Modulerwasp_notchedbox1.wasp
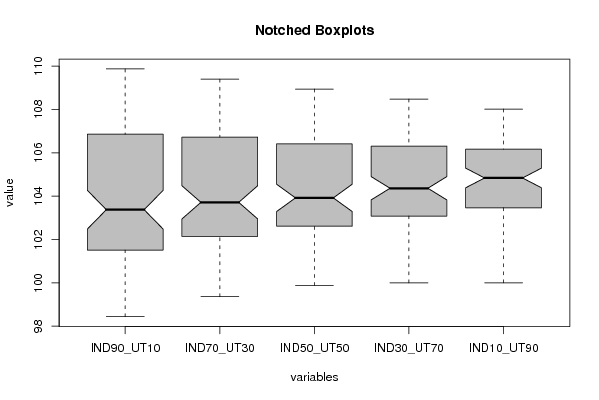
Title produced by softwareNotched Boxplots
Date of computationFri, 31 Oct 2008 05:46:32 -0600
Cite this page as followsStatistical Computations at FreeStatistics.org, Office for Research Development and Education, URL https://freestatistics.org/blog/index.php?v=date/2008/Oct/31/t1225453871ex7mplwtvgbhzr8.htm/, Retrieved Wed, 15 May 2024 18:39:39 +0000
Statistical Computations at FreeStatistics.org, Office for Research Development and Education, URL https://freestatistics.org/blog/index.php?pk=20219, Retrieved Wed, 15 May 2024 18:39:39 +0000
QR Codes:

Original text written by user:
IsPrivate?No (this computation is public)
User-defined keywords
Estimated Impact184
Family? (F = Feedback message, R = changed R code, M = changed R Module, P = changed Parameters, D = changed Data)
F       [Notched Boxplots] [] [2008-10-31 11:46:32] [8758b22b4a10c08c31202f233362e983] [Current]
F         [Notched Boxplots] [Q3] [2008-11-03 22:21:52] [76963dc1903f0f612b6153510a3818cf]
Feedback Forum
2008-11-06 15:42:43 [Nathalie Koulouris] [reply
De student heeft deze vraag correct beantwoord. De laatste plot is duidelijk de beste, want de mediaan van de laatste box plot ligt hoger dan al de andere boxen (104.84). Bovendien is de spreiding bij de laatste kolom gelijk. Deze belegging is dus aan te raden aangezien ook het rendement boven de vooropgestelde 3.8% ligt.
2008-11-10 18:06:39 [Matthieu Blondeau] [reply
Dit is inderdaad de correcte oplossing. De IND10_UT90 is de beste investering. Het betrouwbaarheidsinterval van de box moet boven de 103,8 vallen aangezien we een winst van 3,8% willen hebben.

De spreiding van deze investering is ook de kleinste, wat wil zeggen dat de waarden vrij dicht bij elkaar liggen. De waarden fluctueren dus minder hoog/laag, de waarden zijn constanter en dus stabieler.
2008-11-11 12:11:11 [Inge Meelberghs] [reply
IND10_UT90 is inderdaad de beste inverstering die men kan doen. Dit kunnen we ten eerste afleiden uit de Notched box plot grafiek. De mediaan van deze investering ligt het hoogtst t.o.v. de andere 4. Maar dit zou niet voldoende zijn.

In de opgave staat ook dat de investeerder een rendement wil dat hoger ligt dan 3,8%. Als we terug naar de laatste boxplot kijken, dan kunnen we zien dat de mediaan van IND10_90 ook boven deze waarde ligt (103,8). In de tabel zie je de exacte waarde van de lower bound van IND10_UT90. Deze bedraagt 104,388 en ligt beduidend hoger dan de lower bound van de drie andere investeringen. Hierdoor kunnen we dus effectief vaststellen dat deze dan ook de beste investering is.

Post a new message
Dataseries X:
100,00	100,00	100,00	100,00	100,00
100,39	100,37	100,35	100,33	100,31
100,15	100,26	100,38	100,50	100,61
100,21	100,37	100,52	100,68	100,84
100,03	100,18	100,34	100,49	100,64
99,58	99,78	99,97	100,17	100,36
99,40	99,64	99,88	100,13	100,37
99,77	100,01	100,26	100,50	100,75
100,41	100,67	100,93	101,19	101,45
100,12	100,50	100,88	101,25	101,63
99,83	100,28	100,73	101,18	101,63
99,73	100,24	100,74	101,25	101,75
98,74	99,49	100,25	101,00	101,76
98,44	99,36	100,29	101,22	102,14
98,79	99,68	100,57	101,46	102,35
99,60	100,42	101,24	102,05	102,87
99,82	100,75	101,69	102,62	103,55
99,85	100,87	101,89	102,90	103,92
100,01	101,04	102,07	103,10	104,13
100,28	101,36	102,43	103,51	104,58
100,63	101,57	102,51	103,45	104,39
101,14	101,93	102,71	103,50	104,29
101,51	102,37	103,22	104,08	104,93
102,41	103,10	103,79	104,48	105,17
102,46	103,22	103,99	104,75	105,52
102,09	102,96	103,83	104,70	105,57
101,99	102,77	103,55	104,33	105,11
101,52	102,38	103,24	104,11	104,97
102,44	103,10	103,77	104,43	105,09
103,42	103,90	104,37	104,85	105,33
103,63	104,12	104,61	105,11	105,60
103,28	103,75	104,21	104,68	105,14
103,98	104,37	104,77	105,16	105,56
103,56	103,94	104,33	104,71	105,09
103,42	103,78	104,14	104,51	104,87
103,92	104,15	104,37	104,59	104,81
103,81	104,01	104,20	104,40	104,60
103,09	103,33	103,58	103,83	104,07
102,60	103,05	103,51	103,96	104,41
102,77	103,08	103,39	103,71	104,02
102,60	102,86	103,11	103,37	103,62
102,88	103,08	103,28	103,48	103,68
102,17	102,50	102,83	103,15	103,48
101,85	102,20	102,56	102,91	103,27
101,66	102,14	102,62	103,10	103,58
101,91	102,28	102,66	103,03	103,41
102,13	102,43	102,72	103,02	103,31
102,71	102,82	102,92	103,02	103,13
103,17	103,22	103,26	103,31	103,36
102,89	102,95	103,02	103,08	103,14
102,94	103,14	103,33	103,53	103,73
103,33	103,45	103,57	103,68	103,80
103,75	103,68	103,61	103,54	103,46
104,11	103,98	103,85	103,72	103,60
104,77	104,49	104,22	103,94	103,67
104,62	104,39	104,15	103,92	103,68
105,00	104,76	104,52	104,28	104,04
105,74	105,51	105,27	105,03	104,79
105,94	105,77	105,60	105,43	105,26
106,37	106,18	105,99	105,80	105,62
106,65	106,44	106,23	106,03	105,82
107,08	106,74	106,40	106,05	105,71
106,77	106,51	106,25	106,00	105,74
107,21	106,97	106,74	106,50	106,26
107,34	107,15	106,96	106,78	106,59
107,12	106,93	106,74	106,55	106,36
106,86	106,73	106,59	106,46	106,33
106,92	106,78	106,65	106,51	106,37
106,95	106,75	106,56	106,36	106,17
107,23	106,96	106,69	106,42	106,16
106,94	106,80	106,66	106,51	106,37
106,62	106,51	106,40	106,29	106,18
105,94	105,97	105,99	106,01	106,03
105,91	105,95	105,99	106,03	106,08
106,52	106,45	106,38	106,31	106,24
106,85	106,63	106,41	106,19	105,97
107,22	106,99	106,75	106,52	106,28
107,28	107,09	106,90	106,71	106,52
107,86	107,57	107,29	107,00	106,72
107,68	107,46	107,24	107,02	106,80
108,07	107,82	107,56	107,31	107,06
107,87	107,66	107,45	107,23	107,02
107,65	107,50	107,35	107,19	107,04
108,16	107,89	107,63	107,36	107,09
108,60	108,24	107,88	107,51	107,15
108,92	108,57	108,21	107,86	107,50
109,66	109,22	108,78	108,34	107,90
109,87	109,40	108,94	108,48	108,02
109,54	109,10	108,66	108,22	107,78
109,06	108,72	108,38	108,04	107,70


Summary of computational transaction
Raw Inputview raw input (R code)
Raw Outputview raw output of R engine
Computing time1 seconds
R Server'Gwilym Jenkins' @ 72.249.127.135

\begin{tabular}{lllllllll}
\hline
Summary of computational transaction \tabularnewline
Raw Input & view raw input (R code)  \tabularnewline
Raw Output & view raw output of R engine  \tabularnewline
Computing time & 1 seconds \tabularnewline
R Server & 'Gwilym Jenkins' @ 72.249.127.135 \tabularnewline
\hline
\end{tabular}
%Source: https://freestatistics.org/blog/index.php?pk=20219&T=0

[TABLE]
[ROW][C]Summary of computational transaction[/C][/ROW]
[ROW][C]Raw Input[/C][C]view raw input (R code) [/C][/ROW]
[ROW][C]Raw Output[/C][C]view raw output of R engine [/C][/ROW]
[ROW][C]Computing time[/C][C]1 seconds[/C][/ROW]
[ROW][C]R Server[/C][C]'Gwilym Jenkins' @ 72.249.127.135[/C][/ROW]
[/TABLE]
Source: https://freestatistics.org/blog/index.php?pk=20219&T=0

Globally Unique Identifier (entire table): ba.freestatistics.org/blog/index.php?pk=20219&T=0

As an alternative you can also use a QR Code:  

The GUIDs for individual cells are displayed in the table below:

Summary of computational transaction
Raw Inputview raw input (R code)
Raw Outputview raw output of R engine
Computing time1 seconds
R Server'Gwilym Jenkins' @ 72.249.127.135


Boxplot statistics
Variablelower whiskerlower hingemedianupper hingeupper whisker
IND90_UT1098.44101.51103.375106.86109.87
IND70_UT3099.36102.14103.715106.73109.4
IND50_UT5099.88102.62103.92106.41108.94
IND30_UT70100103.08104.365106.31108.48
IND10_UT90100103.46104.84106.17108.02

\begin{tabular}{lllllllll}
\hline
Boxplot statistics \tabularnewline
Variable & lower whisker & lower hinge & median & upper hinge & upper whisker \tabularnewline
IND90_UT10 & 98.44 & 101.51 & 103.375 & 106.86 & 109.87 \tabularnewline
IND70_UT30 & 99.36 & 102.14 & 103.715 & 106.73 & 109.4 \tabularnewline
IND50_UT50 & 99.88 & 102.62 & 103.92 & 106.41 & 108.94 \tabularnewline
IND30_UT70 & 100 & 103.08 & 104.365 & 106.31 & 108.48 \tabularnewline
IND10_UT90 & 100 & 103.46 & 104.84 & 106.17 & 108.02 \tabularnewline
\hline
\end{tabular}
%Source: https://freestatistics.org/blog/index.php?pk=20219&T=1

[TABLE]
[ROW][C]Boxplot statistics[/C][/ROW]
[ROW][C]Variable[/C][C]lower whisker[/C][C]lower hinge[/C][C]median[/C][C]upper hinge[/C][C]upper whisker[/C][/ROW]
[ROW][C]IND90_UT10[/C][C]98.44[/C][C]101.51[/C][C]103.375[/C][C]106.86[/C][C]109.87[/C][/ROW]
[ROW][C]IND70_UT30[/C][C]99.36[/C][C]102.14[/C][C]103.715[/C][C]106.73[/C][C]109.4[/C][/ROW]
[ROW][C]IND50_UT50[/C][C]99.88[/C][C]102.62[/C][C]103.92[/C][C]106.41[/C][C]108.94[/C][/ROW]
[ROW][C]IND30_UT70[/C][C]100[/C][C]103.08[/C][C]104.365[/C][C]106.31[/C][C]108.48[/C][/ROW]
[ROW][C]IND10_UT90[/C][C]100[/C][C]103.46[/C][C]104.84[/C][C]106.17[/C][C]108.02[/C][/ROW]
[/TABLE]
Source: https://freestatistics.org/blog/index.php?pk=20219&T=1

Globally Unique Identifier (entire table): ba.freestatistics.org/blog/index.php?pk=20219&T=1

As an alternative you can also use a QR Code:  

The GUIDs for individual cells are displayed in the table below:

Boxplot statistics
Variablelower whiskerlower hingemedianupper hingeupper whisker
IND90_UT1098.44101.51103.375106.86109.87
IND70_UT3099.36102.14103.715106.73109.4
IND50_UT5099.88102.62103.92106.41108.94
IND30_UT70100103.08104.365106.31108.48
IND10_UT90100103.46104.84106.17108.02


Boxplot Notches
Variablelower boundmedianupper bound
IND90_UT10102.483975564620103.375104.266024435380
IND70_UT30102.950550998431103.715104.479449001569
IND50_UT50103.288788297179103.92104.551211702821
IND30_UT70103.827054406303104.365104.902945593697
IND10_UT90104.388658650490104.84105.291341349510

\begin{tabular}{lllllllll}
\hline
Boxplot Notches \tabularnewline
Variable & lower bound & median & upper bound \tabularnewline
IND90_UT10 & 102.483975564620 & 103.375 & 104.266024435380 \tabularnewline
IND70_UT30 & 102.950550998431 & 103.715 & 104.479449001569 \tabularnewline
IND50_UT50 & 103.288788297179 & 103.92 & 104.551211702821 \tabularnewline
IND30_UT70 & 103.827054406303 & 104.365 & 104.902945593697 \tabularnewline
IND10_UT90 & 104.388658650490 & 104.84 & 105.291341349510 \tabularnewline
\hline
\end{tabular}
%Source: https://freestatistics.org/blog/index.php?pk=20219&T=2

[TABLE]
[ROW][C]Boxplot Notches[/C][/ROW]
[ROW][C]Variable[/C][C]lower bound[/C][C]median[/C][C]upper bound[/C][/ROW]
[ROW][C]IND90_UT10[/C][C]102.483975564620[/C][C]103.375[/C][C]104.266024435380[/C][/ROW]
[ROW][C]IND70_UT30[/C][C]102.950550998431[/C][C]103.715[/C][C]104.479449001569[/C][/ROW]
[ROW][C]IND50_UT50[/C][C]103.288788297179[/C][C]103.92[/C][C]104.551211702821[/C][/ROW]
[ROW][C]IND30_UT70[/C][C]103.827054406303[/C][C]104.365[/C][C]104.902945593697[/C][/ROW]
[ROW][C]IND10_UT90[/C][C]104.388658650490[/C][C]104.84[/C][C]105.291341349510[/C][/ROW]
[/TABLE]
Source: https://freestatistics.org/blog/index.php?pk=20219&T=2

Globally Unique Identifier (entire table): ba.freestatistics.org/blog/index.php?pk=20219&T=2

As an alternative you can also use a QR Code:  

The GUIDs for individual cells are displayed in the table below:

Boxplot Notches
Variablelower boundmedianupper bound
IND90_UT10102.483975564620103.375104.266024435380
IND70_UT30102.950550998431103.715104.479449001569
IND50_UT50103.288788297179103.92104.551211702821
IND30_UT70103.827054406303104.365104.902945593697
IND10_UT90104.388658650490104.84105.291341349510


Parameters (Session):
par1 = grey ;
Parameters (R input):
par1 = grey ;
R code (references can be found in the software module):
z <- as.data.frame(t(y))
bitmap(file='test1.png')
(r<-boxplot(z ,xlab=xlab,ylab=ylab,main=main,notch=TRUE,col=par1))
dev.off()
load(file='createtable')
a<-table.start()
a<-table.row.start(a)
a<-table.element(a,hyperlink('overview.htm','Boxplot statistics','Boxplot overview'),6,TRUE)
a<-table.row.end(a)
a<-table.row.start(a)
a<-table.element(a,'Variable',1,TRUE)
a<-table.element(a,hyperlink('lower_whisker.htm','lower whisker','definition of lower whisker'),1,TRUE)
a<-table.element(a,hyperlink('lower_hinge.htm','lower hinge','definition of lower hinge'),1,TRUE)
a<-table.element(a,hyperlink('central_tendency.htm','median','definitions about measures of central tendency'),1,TRUE)
a<-table.element(a,hyperlink('upper_hinge.htm','upper hinge','definition of upper hinge'),1,TRUE)
a<-table.element(a,hyperlink('upper_whisker.htm','upper whisker','definition of upper whisker'),1,TRUE)
a<-table.row.end(a)
for (i in 1:length(y[,1]))
{
a<-table.row.start(a)
a<-table.element(a,dimnames(t(x))[[2]][i],1,TRUE)
for (j in 1:5)
{
a<-table.element(a,r$stats[j,i])
}
a<-table.row.end(a)
}
a<-table.end(a)
table.save(a,file='mytable.tab')
a<-table.start()
a<-table.row.start(a)
a<-table.element(a,'Boxplot Notches',4,TRUE)
a<-table.row.end(a)
a<-table.row.start(a)
a<-table.element(a,'Variable',1,TRUE)
a<-table.element(a,'lower bound',1,TRUE)
a<-table.element(a,'median',1,TRUE)
a<-table.element(a,'upper bound',1,TRUE)
a<-table.row.end(a)
for (i in 1:length(y[,1]))
{
a<-table.row.start(a)
a<-table.element(a,dimnames(t(x))[[2]][i],1,TRUE)
a<-table.element(a,r$conf[1,i])
a<-table.element(a,r$stats[3,i])
a<-table.element(a,r$conf[2,i])
a<-table.row.end(a)
}
a<-table.end(a)
table.save(a,file='mytable1.tab')