Free Statistics
of Irreproducible Research!
Description of Statistical Computation | |||||||||||||||||||||||||||||||||||||||||
|---|---|---|---|---|---|---|---|---|---|---|---|---|---|---|---|---|---|---|---|---|---|---|---|---|---|---|---|---|---|---|---|---|---|---|---|---|---|---|---|---|---|
| Author's title | |||||||||||||||||||||||||||||||||||||||||
| Author | *The author of this computation has been verified* | ||||||||||||||||||||||||||||||||||||||||
| R Software Module | rwasp_univariatedataseries.wasp | ||||||||||||||||||||||||||||||||||||||||
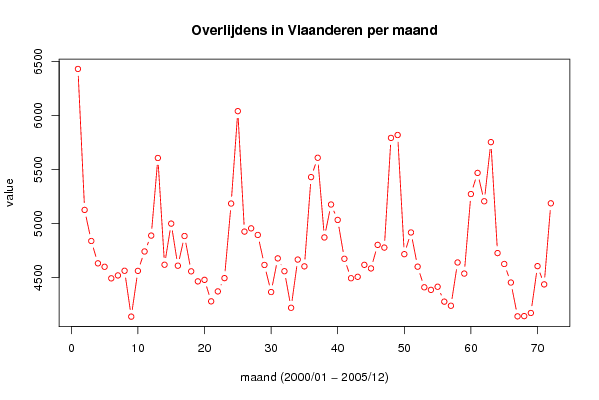
| Title produced by software | Univariate Data Series | ||||||||||||||||||||||||||||||||||||||||
| Date of computation | Tue, 07 Apr 2009 11:15:40 -0600 | ||||||||||||||||||||||||||||||||||||||||
| Cite this page as follows | Statistical Computations at FreeStatistics.org, Office for Research Development and Education, URL https://freestatistics.org/blog/index.php?v=date/2009/Apr/07/t123912459620rrvr9mrrl0lpf.htm/, Retrieved Sun, 12 May 2024 02:55:04 +0000 | ||||||||||||||||||||||||||||||||||||||||
| Statistical Computations at FreeStatistics.org, Office for Research Development and Education, URL https://freestatistics.org/blog/index.php?pk=39238, Retrieved Sun, 12 May 2024 02:55:04 +0000 | |||||||||||||||||||||||||||||||||||||||||
| QR Codes: | |||||||||||||||||||||||||||||||||||||||||
|
| |||||||||||||||||||||||||||||||||||||||||
| Original text written by user: | |||||||||||||||||||||||||||||||||||||||||
| IsPrivate? | No (this computation is public) | ||||||||||||||||||||||||||||||||||||||||
| User-defined keywords | |||||||||||||||||||||||||||||||||||||||||
| Estimated Impact | 312 | ||||||||||||||||||||||||||||||||||||||||
Tree of Dependent Computations | |||||||||||||||||||||||||||||||||||||||||
| Family? (F = Feedback message, R = changed R code, M = changed R Module, P = changed Parameters, D = changed Data) | |||||||||||||||||||||||||||||||||||||||||
| - [Univariate Data Series] [Tijdreeks Overlij...] [2009-04-07 17:15:40] [d76b387543b13b5e3afd8ff9e5fdc89f] [Current] - RMP [Histogram] [Histogram overlei...] [2009-07-25 09:05:13] [3277f4fd1367f73c9bc433502ffbb1d3] - P [Histogram] [] [2009-07-25 16:00:26] [f85cc8f00ef4b762f0a6fdfddc793773] | |||||||||||||||||||||||||||||||||||||||||
| Feedback Forum | |||||||||||||||||||||||||||||||||||||||||
Post a new message | |||||||||||||||||||||||||||||||||||||||||
Dataset | |||||||||||||||||||||||||||||||||||||||||
| Dataseries X: | |||||||||||||||||||||||||||||||||||||||||
6430 5124 4836 4629 4597 4490 4517 4560 4135 4559 4739 4886 5605 4616 4997 4607 4882 4555 4462 4476 4277 4369 4492 5183 6039 4923 4953 4892 4614 4363 4675 4556 4217 4664 4601 5428 5607 4869 5174 5031 4671 4491 4504 4615 4582 4800 4775 5791 5818 4714 4915 4598 4407 4383 4412 4274 4236 4637 4534 5271 5467 5204 5752 4724 4623 4451 4138 4140 4169 4603 4434 5185 | |||||||||||||||||||||||||||||||||||||||||
Tables (Output of Computation) | |||||||||||||||||||||||||||||||||||||||||
| |||||||||||||||||||||||||||||||||||||||||
Figures (Output of Computation) | |||||||||||||||||||||||||||||||||||||||||
Input Parameters & R Code | |||||||||||||||||||||||||||||||||||||||||
| Parameters (Session): | |||||||||||||||||||||||||||||||||||||||||
| par1 = Overlijdens Vl. ; par2 = Rijksregister ; par3 = Overlijdens Vlaams Gewest per maand (2000-2005) ; | |||||||||||||||||||||||||||||||||||||||||
| Parameters (R input): | |||||||||||||||||||||||||||||||||||||||||
| par1 = Overlijdens Vl. ; par2 = Rijksregister ; par3 = Overlijdens Vlaams Gewest per maand (2000-2005) ; | |||||||||||||||||||||||||||||||||||||||||
| R code (references can be found in the software module): | |||||||||||||||||||||||||||||||||||||||||
bitmap(file='test1.png') | |||||||||||||||||||||||||||||||||||||||||