Free Statistics

of Irreproducible Research!

Author's title

Author*The author of this computation has been verified*
R Software Modulerwasp_arimabackwardselection.wasp
Title produced by softwareARIMA Backward Selection
Date of computationTue, 01 Dec 2009 11:12:25 -0700
Cite this page as followsStatistical Computations at FreeStatistics.org, Office for Research Development and Education, URL https://freestatistics.org/blog/index.php?v=date/2009/Dec/01/t1259691219im3p8j8hxrapvy2.htm/, Retrieved Fri, 03 May 2024 18:21:27 +0000
Statistical Computations at FreeStatistics.org, Office for Research Development and Education, URL https://freestatistics.org/blog/index.php?pk=62154, Retrieved Fri, 03 May 2024 18:21:27 +0000
QR Codes:

Original text written by user:
IsPrivate?No (this computation is public)
User-defined keywords
Estimated Impact148
Family? (F = Feedback message, R = changed R code, M = changed R Module, P = changed Parameters, D = changed Data)
-     [Univariate Data Series] [data set] [2008-12-01 19:54:57] [b98453cac15ba1066b407e146608df68]
- RMP   [ARIMA Backward Selection] [] [2009-11-27 14:53:14] [b98453cac15ba1066b407e146608df68]
- R PD      [ARIMA Backward Selection] [] [2009-12-01 18:12:25] [7dd0431c761b876151627bfbf92230c8] [Current]
Feedback Forum

Post a new message
Dataseries X:
90398
90269
90390
88219
87032
87175
92603
93571
94118
92159
89528
89955
89587
89488
88521
86587
85159
84915
91378
92729
92194
89664
86285
86858
87184
86629
85220
84816
84831
84957
90951
92134
91790
86625
83324
82719
83614
81640
78665
77828
75728
72187
79357
81329
77304
75576
72932
74291
74988
73302
70483
69848
66466
67610
75091
76207
73454
72008
71362
74250


Summary of computational transaction
Raw Inputview raw input (R code)
Raw Outputview raw output of R engine
Computing time10 seconds
R Server'Gwilym Jenkins' @ 72.249.127.135

\begin{tabular}{lllllllll}
\hline
Summary of computational transaction \tabularnewline
Raw Input & view raw input (R code)  \tabularnewline
Raw Output & view raw output of R engine  \tabularnewline
Computing time & 10 seconds \tabularnewline
R Server & 'Gwilym Jenkins' @ 72.249.127.135 \tabularnewline
\hline
\end{tabular}
%Source: https://freestatistics.org/blog/index.php?pk=62154&T=0

[TABLE]
[ROW][C]Summary of computational transaction[/C][/ROW]
[ROW][C]Raw Input[/C][C]view raw input (R code) [/C][/ROW]
[ROW][C]Raw Output[/C][C]view raw output of R engine [/C][/ROW]
[ROW][C]Computing time[/C][C]10 seconds[/C][/ROW]
[ROW][C]R Server[/C][C]'Gwilym Jenkins' @ 72.249.127.135[/C][/ROW]
[/TABLE]
Source: https://freestatistics.org/blog/index.php?pk=62154&T=0

Globally Unique Identifier (entire table): ba.freestatistics.org/blog/index.php?pk=62154&T=0

As an alternative you can also use a QR Code:  

The GUIDs for individual cells are displayed in the table below:

Summary of computational transaction
Raw Inputview raw input (R code)
Raw Outputview raw output of R engine
Computing time10 seconds
R Server'Gwilym Jenkins' @ 72.249.127.135


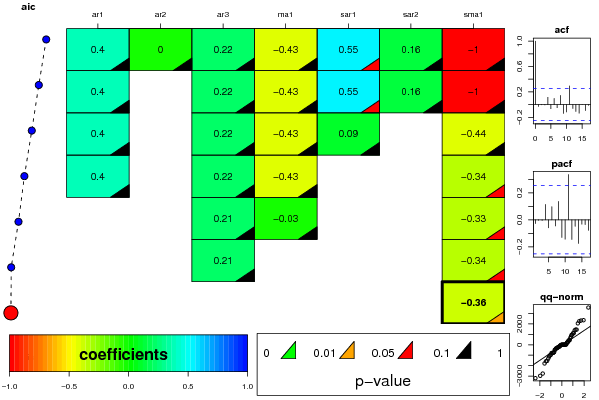
ARIMA Parameter Estimation and Backward Selection
Iterationar1ar2ar3ma1sar1sar2sma1
Estimates ( 1 )0.3991-0.00370.2188-0.43290.55040.1561-0.9957
(p-val)(0.4792 )(0.9822 )(0.1588 )(0.4522 )(0.0595 )(0.5537 )(0.33 )
Estimates ( 2 )0.397300.2179-0.43230.55160.1556-0.9968
(p-val)(0.4787 )(NA )(0.1418 )(0.4531 )(0.0523 )(0.5536 )(0.3391 )
Estimates ( 3 )0.396800.2217-0.43260.09130-0.4371
(p-val)(0.4734 )(NA )(0.1363 )(0.448 )(0.899 )(NA )(0.569 )
Estimates ( 4 )0.39500.2217-0.425200-0.3424
(p-val)(0.4672 )(NA )(0.1385 )(0.4441 )(NA )(NA )(0.0602 )
Estimates ( 5 )000.2125-0.029600-0.3311
(p-val)(NA )(NA )(0.1623 )(0.8455 )(NA )(NA )(0.0683 )
Estimates ( 6 )000.2101000-0.3369
(p-val)(NA )(NA )(0.1647 )(NA )(NA )(NA )(0.0591 )
Estimates ( 7 )000000-0.3645
(p-val)(NA )(NA )(NA )(NA )(NA )(NA )(0.0383 )
Estimates ( 8 )NANANANANANANA
(p-val)(NA )(NA )(NA )(NA )(NA )(NA )(NA )
Estimates ( 9 )NANANANANANANA
(p-val)(NA )(NA )(NA )(NA )(NA )(NA )(NA )
Estimates ( 10 )NANANANANANANA
(p-val)(NA )(NA )(NA )(NA )(NA )(NA )(NA )
Estimates ( 11 )NANANANANANANA
(p-val)(NA )(NA )(NA )(NA )(NA )(NA )(NA )
Estimates ( 12 )NANANANANANANA
(p-val)(NA )(NA )(NA )(NA )(NA )(NA )(NA )
Estimates ( 13 )NANANANANANANA
(p-val)(NA )(NA )(NA )(NA )(NA )(NA )(NA )

\begin{tabular}{lllllllll}
\hline
ARIMA Parameter Estimation and Backward Selection \tabularnewline
Iteration & ar1 & ar2 & ar3 & ma1 & sar1 & sar2 & sma1 \tabularnewline
Estimates ( 1 ) & 0.3991 & -0.0037 & 0.2188 & -0.4329 & 0.5504 & 0.1561 & -0.9957 \tabularnewline
(p-val) & (0.4792 ) & (0.9822 ) & (0.1588 ) & (0.4522 ) & (0.0595 ) & (0.5537 ) & (0.33 ) \tabularnewline
Estimates ( 2 ) & 0.3973 & 0 & 0.2179 & -0.4323 & 0.5516 & 0.1556 & -0.9968 \tabularnewline
(p-val) & (0.4787 ) & (NA ) & (0.1418 ) & (0.4531 ) & (0.0523 ) & (0.5536 ) & (0.3391 ) \tabularnewline
Estimates ( 3 ) & 0.3968 & 0 & 0.2217 & -0.4326 & 0.0913 & 0 & -0.4371 \tabularnewline
(p-val) & (0.4734 ) & (NA ) & (0.1363 ) & (0.448 ) & (0.899 ) & (NA ) & (0.569 ) \tabularnewline
Estimates ( 4 ) & 0.395 & 0 & 0.2217 & -0.4252 & 0 & 0 & -0.3424 \tabularnewline
(p-val) & (0.4672 ) & (NA ) & (0.1385 ) & (0.4441 ) & (NA ) & (NA ) & (0.0602 ) \tabularnewline
Estimates ( 5 ) & 0 & 0 & 0.2125 & -0.0296 & 0 & 0 & -0.3311 \tabularnewline
(p-val) & (NA ) & (NA ) & (0.1623 ) & (0.8455 ) & (NA ) & (NA ) & (0.0683 ) \tabularnewline
Estimates ( 6 ) & 0 & 0 & 0.2101 & 0 & 0 & 0 & -0.3369 \tabularnewline
(p-val) & (NA ) & (NA ) & (0.1647 ) & (NA ) & (NA ) & (NA ) & (0.0591 ) \tabularnewline
Estimates ( 7 ) & 0 & 0 & 0 & 0 & 0 & 0 & -0.3645 \tabularnewline
(p-val) & (NA ) & (NA ) & (NA ) & (NA ) & (NA ) & (NA ) & (0.0383 ) \tabularnewline
Estimates ( 8 ) & NA & NA & NA & NA & NA & NA & NA \tabularnewline
(p-val) & (NA ) & (NA ) & (NA ) & (NA ) & (NA ) & (NA ) & (NA ) \tabularnewline
Estimates ( 9 ) & NA & NA & NA & NA & NA & NA & NA \tabularnewline
(p-val) & (NA ) & (NA ) & (NA ) & (NA ) & (NA ) & (NA ) & (NA ) \tabularnewline
Estimates ( 10 ) & NA & NA & NA & NA & NA & NA & NA \tabularnewline
(p-val) & (NA ) & (NA ) & (NA ) & (NA ) & (NA ) & (NA ) & (NA ) \tabularnewline
Estimates ( 11 ) & NA & NA & NA & NA & NA & NA & NA \tabularnewline
(p-val) & (NA ) & (NA ) & (NA ) & (NA ) & (NA ) & (NA ) & (NA ) \tabularnewline
Estimates ( 12 ) & NA & NA & NA & NA & NA & NA & NA \tabularnewline
(p-val) & (NA ) & (NA ) & (NA ) & (NA ) & (NA ) & (NA ) & (NA ) \tabularnewline
Estimates ( 13 ) & NA & NA & NA & NA & NA & NA & NA \tabularnewline
(p-val) & (NA ) & (NA ) & (NA ) & (NA ) & (NA ) & (NA ) & (NA ) \tabularnewline
\hline
\end{tabular}
%Source: https://freestatistics.org/blog/index.php?pk=62154&T=1

[TABLE]
[ROW][C]ARIMA Parameter Estimation and Backward Selection[/C][/ROW]
[ROW][C]Iteration[/C][C]ar1[/C][C]ar2[/C][C]ar3[/C][C]ma1[/C][C]sar1[/C][C]sar2[/C][C]sma1[/C][/ROW]
[ROW][C]Estimates ( 1 )[/C][C]0.3991[/C][C]-0.0037[/C][C]0.2188[/C][C]-0.4329[/C][C]0.5504[/C][C]0.1561[/C][C]-0.9957[/C][/ROW]
[ROW][C](p-val)[/C][C](0.4792 )[/C][C](0.9822 )[/C][C](0.1588 )[/C][C](0.4522 )[/C][C](0.0595 )[/C][C](0.5537 )[/C][C](0.33 )[/C][/ROW]
[ROW][C]Estimates ( 2 )[/C][C]0.3973[/C][C]0[/C][C]0.2179[/C][C]-0.4323[/C][C]0.5516[/C][C]0.1556[/C][C]-0.9968[/C][/ROW]
[ROW][C](p-val)[/C][C](0.4787 )[/C][C](NA )[/C][C](0.1418 )[/C][C](0.4531 )[/C][C](0.0523 )[/C][C](0.5536 )[/C][C](0.3391 )[/C][/ROW]
[ROW][C]Estimates ( 3 )[/C][C]0.3968[/C][C]0[/C][C]0.2217[/C][C]-0.4326[/C][C]0.0913[/C][C]0[/C][C]-0.4371[/C][/ROW]
[ROW][C](p-val)[/C][C](0.4734 )[/C][C](NA )[/C][C](0.1363 )[/C][C](0.448 )[/C][C](0.899 )[/C][C](NA )[/C][C](0.569 )[/C][/ROW]
[ROW][C]Estimates ( 4 )[/C][C]0.395[/C][C]0[/C][C]0.2217[/C][C]-0.4252[/C][C]0[/C][C]0[/C][C]-0.3424[/C][/ROW]
[ROW][C](p-val)[/C][C](0.4672 )[/C][C](NA )[/C][C](0.1385 )[/C][C](0.4441 )[/C][C](NA )[/C][C](NA )[/C][C](0.0602 )[/C][/ROW]
[ROW][C]Estimates ( 5 )[/C][C]0[/C][C]0[/C][C]0.2125[/C][C]-0.0296[/C][C]0[/C][C]0[/C][C]-0.3311[/C][/ROW]
[ROW][C](p-val)[/C][C](NA )[/C][C](NA )[/C][C](0.1623 )[/C][C](0.8455 )[/C][C](NA )[/C][C](NA )[/C][C](0.0683 )[/C][/ROW]
[ROW][C]Estimates ( 6 )[/C][C]0[/C][C]0[/C][C]0.2101[/C][C]0[/C][C]0[/C][C]0[/C][C]-0.3369[/C][/ROW]
[ROW][C](p-val)[/C][C](NA )[/C][C](NA )[/C][C](0.1647 )[/C][C](NA )[/C][C](NA )[/C][C](NA )[/C][C](0.0591 )[/C][/ROW]
[ROW][C]Estimates ( 7 )[/C][C]0[/C][C]0[/C][C]0[/C][C]0[/C][C]0[/C][C]0[/C][C]-0.3645[/C][/ROW]
[ROW][C](p-val)[/C][C](NA )[/C][C](NA )[/C][C](NA )[/C][C](NA )[/C][C](NA )[/C][C](NA )[/C][C](0.0383 )[/C][/ROW]
[ROW][C]Estimates ( 8 )[/C][C]NA[/C][C]NA[/C][C]NA[/C][C]NA[/C][C]NA[/C][C]NA[/C][C]NA[/C][/ROW]
[ROW][C](p-val)[/C][C](NA )[/C][C](NA )[/C][C](NA )[/C][C](NA )[/C][C](NA )[/C][C](NA )[/C][C](NA )[/C][/ROW]
[ROW][C]Estimates ( 9 )[/C][C]NA[/C][C]NA[/C][C]NA[/C][C]NA[/C][C]NA[/C][C]NA[/C][C]NA[/C][/ROW]
[ROW][C](p-val)[/C][C](NA )[/C][C](NA )[/C][C](NA )[/C][C](NA )[/C][C](NA )[/C][C](NA )[/C][C](NA )[/C][/ROW]
[ROW][C]Estimates ( 10 )[/C][C]NA[/C][C]NA[/C][C]NA[/C][C]NA[/C][C]NA[/C][C]NA[/C][C]NA[/C][/ROW]
[ROW][C](p-val)[/C][C](NA )[/C][C](NA )[/C][C](NA )[/C][C](NA )[/C][C](NA )[/C][C](NA )[/C][C](NA )[/C][/ROW]
[ROW][C]Estimates ( 11 )[/C][C]NA[/C][C]NA[/C][C]NA[/C][C]NA[/C][C]NA[/C][C]NA[/C][C]NA[/C][/ROW]
[ROW][C](p-val)[/C][C](NA )[/C][C](NA )[/C][C](NA )[/C][C](NA )[/C][C](NA )[/C][C](NA )[/C][C](NA )[/C][/ROW]
[ROW][C]Estimates ( 12 )[/C][C]NA[/C][C]NA[/C][C]NA[/C][C]NA[/C][C]NA[/C][C]NA[/C][C]NA[/C][/ROW]
[ROW][C](p-val)[/C][C](NA )[/C][C](NA )[/C][C](NA )[/C][C](NA )[/C][C](NA )[/C][C](NA )[/C][C](NA )[/C][/ROW]
[ROW][C]Estimates ( 13 )[/C][C]NA[/C][C]NA[/C][C]NA[/C][C]NA[/C][C]NA[/C][C]NA[/C][C]NA[/C][/ROW]
[ROW][C](p-val)[/C][C](NA )[/C][C](NA )[/C][C](NA )[/C][C](NA )[/C][C](NA )[/C][C](NA )[/C][C](NA )[/C][/ROW]
[/TABLE]
Source: https://freestatistics.org/blog/index.php?pk=62154&T=1

Globally Unique Identifier (entire table): ba.freestatistics.org/blog/index.php?pk=62154&T=1

As an alternative you can also use a QR Code:  

The GUIDs for individual cells are displayed in the table below:

ARIMA Parameter Estimation and Backward Selection
Iterationar1ar2ar3ma1sar1sar2sma1
Estimates ( 1 )0.3991-0.00370.2188-0.43290.55040.1561-0.9957
(p-val)(0.4792 )(0.9822 )(0.1588 )(0.4522 )(0.0595 )(0.5537 )(0.33 )
Estimates ( 2 )0.397300.2179-0.43230.55160.1556-0.9968
(p-val)(0.4787 )(NA )(0.1418 )(0.4531 )(0.0523 )(0.5536 )(0.3391 )
Estimates ( 3 )0.396800.2217-0.43260.09130-0.4371
(p-val)(0.4734 )(NA )(0.1363 )(0.448 )(0.899 )(NA )(0.569 )
Estimates ( 4 )0.39500.2217-0.425200-0.3424
(p-val)(0.4672 )(NA )(0.1385 )(0.4441 )(NA )(NA )(0.0602 )
Estimates ( 5 )000.2125-0.029600-0.3311
(p-val)(NA )(NA )(0.1623 )(0.8455 )(NA )(NA )(0.0683 )
Estimates ( 6 )000.2101000-0.3369
(p-val)(NA )(NA )(0.1647 )(NA )(NA )(NA )(0.0591 )
Estimates ( 7 )000000-0.3645
(p-val)(NA )(NA )(NA )(NA )(NA )(NA )(0.0383 )
Estimates ( 8 )NANANANANANANA
(p-val)(NA )(NA )(NA )(NA )(NA )(NA )(NA )
Estimates ( 9 )NANANANANANANA
(p-val)(NA )(NA )(NA )(NA )(NA )(NA )(NA )
Estimates ( 10 )NANANANANANANA
(p-val)(NA )(NA )(NA )(NA )(NA )(NA )(NA )
Estimates ( 11 )NANANANANANANA
(p-val)(NA )(NA )(NA )(NA )(NA )(NA )(NA )
Estimates ( 12 )NANANANANANANA
(p-val)(NA )(NA )(NA )(NA )(NA )(NA )(NA )
Estimates ( 13 )NANANANANANANA
(p-val)(NA )(NA )(NA )(NA )(NA )(NA )(NA )


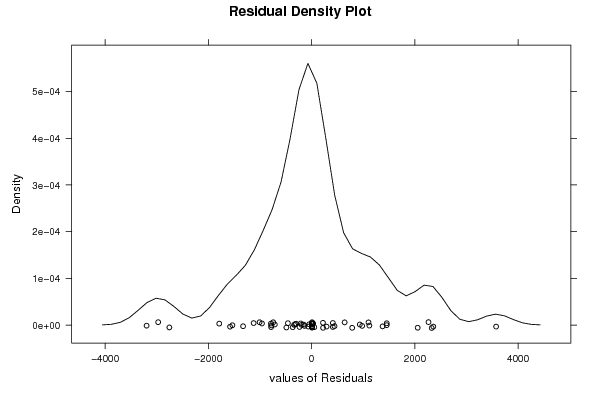
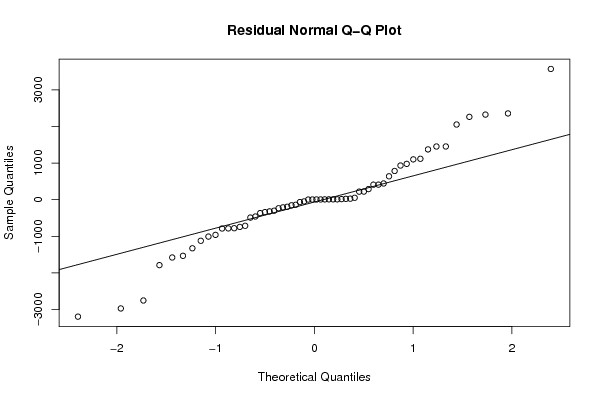
Estimated ARIMA Residuals
Value
-319.559557390785
27.9743410117227
-1008.46959533542
219.863126270784
-234.491311787668
-153.082960538935
933.953124451168
411.042384090291
-961.89720235503
-744.764396776115
-784.92892986467
290.509724746436
785.730745077288
-301.538747036842
-780.030839489239
1454.61282130082
1455.43851042382
411.425730256672
-489.069183914927
-338.63085750037
-193.728983946927
-2756.28930305837
-138.899095490555
-1123.79015926020
1375.20173898251
-1535.1755035624
-1580.22317024033
-64.5953189787947
-1328.41699726220
-3198.05965476559
1102.44538925562
1119.07222818829
-2973.61872170023
2265.07317206589
443.326906414096
2358.41463625693
-459.228166651762
-366.686092276445
-788.24933923038
221.857682470493
-1789.68439905851
3575.1307429011
639.708861362199
-209.773692601329
-713.751966817262
979.24918300219
2326.97019964138
2055.60615831213

\begin{tabular}{lllllllll}
\hline
Estimated ARIMA Residuals \tabularnewline
Value \tabularnewline
-319.559557390785 \tabularnewline
27.9743410117227 \tabularnewline
-1008.46959533542 \tabularnewline
219.863126270784 \tabularnewline
-234.491311787668 \tabularnewline
-153.082960538935 \tabularnewline
933.953124451168 \tabularnewline
411.042384090291 \tabularnewline
-961.89720235503 \tabularnewline
-744.764396776115 \tabularnewline
-784.92892986467 \tabularnewline
290.509724746436 \tabularnewline
785.730745077288 \tabularnewline
-301.538747036842 \tabularnewline
-780.030839489239 \tabularnewline
1454.61282130082 \tabularnewline
1455.43851042382 \tabularnewline
411.425730256672 \tabularnewline
-489.069183914927 \tabularnewline
-338.63085750037 \tabularnewline
-193.728983946927 \tabularnewline
-2756.28930305837 \tabularnewline
-138.899095490555 \tabularnewline
-1123.79015926020 \tabularnewline
1375.20173898251 \tabularnewline
-1535.1755035624 \tabularnewline
-1580.22317024033 \tabularnewline
-64.5953189787947 \tabularnewline
-1328.41699726220 \tabularnewline
-3198.05965476559 \tabularnewline
1102.44538925562 \tabularnewline
1119.07222818829 \tabularnewline
-2973.61872170023 \tabularnewline
2265.07317206589 \tabularnewline
443.326906414096 \tabularnewline
2358.41463625693 \tabularnewline
-459.228166651762 \tabularnewline
-366.686092276445 \tabularnewline
-788.24933923038 \tabularnewline
221.857682470493 \tabularnewline
-1789.68439905851 \tabularnewline
3575.1307429011 \tabularnewline
639.708861362199 \tabularnewline
-209.773692601329 \tabularnewline
-713.751966817262 \tabularnewline
979.24918300219 \tabularnewline
2326.97019964138 \tabularnewline
2055.60615831213 \tabularnewline
\hline
\end{tabular}
%Source: https://freestatistics.org/blog/index.php?pk=62154&T=2

[TABLE]
[ROW][C]Estimated ARIMA Residuals[/C][/ROW]
[ROW][C]Value[/C][/ROW]
[ROW][C]-319.559557390785[/C][/ROW]
[ROW][C]27.9743410117227[/C][/ROW]
[ROW][C]-1008.46959533542[/C][/ROW]
[ROW][C]219.863126270784[/C][/ROW]
[ROW][C]-234.491311787668[/C][/ROW]
[ROW][C]-153.082960538935[/C][/ROW]
[ROW][C]933.953124451168[/C][/ROW]
[ROW][C]411.042384090291[/C][/ROW]
[ROW][C]-961.89720235503[/C][/ROW]
[ROW][C]-744.764396776115[/C][/ROW]
[ROW][C]-784.92892986467[/C][/ROW]
[ROW][C]290.509724746436[/C][/ROW]
[ROW][C]785.730745077288[/C][/ROW]
[ROW][C]-301.538747036842[/C][/ROW]
[ROW][C]-780.030839489239[/C][/ROW]
[ROW][C]1454.61282130082[/C][/ROW]
[ROW][C]1455.43851042382[/C][/ROW]
[ROW][C]411.425730256672[/C][/ROW]
[ROW][C]-489.069183914927[/C][/ROW]
[ROW][C]-338.63085750037[/C][/ROW]
[ROW][C]-193.728983946927[/C][/ROW]
[ROW][C]-2756.28930305837[/C][/ROW]
[ROW][C]-138.899095490555[/C][/ROW]
[ROW][C]-1123.79015926020[/C][/ROW]
[ROW][C]1375.20173898251[/C][/ROW]
[ROW][C]-1535.1755035624[/C][/ROW]
[ROW][C]-1580.22317024033[/C][/ROW]
[ROW][C]-64.5953189787947[/C][/ROW]
[ROW][C]-1328.41699726220[/C][/ROW]
[ROW][C]-3198.05965476559[/C][/ROW]
[ROW][C]1102.44538925562[/C][/ROW]
[ROW][C]1119.07222818829[/C][/ROW]
[ROW][C]-2973.61872170023[/C][/ROW]
[ROW][C]2265.07317206589[/C][/ROW]
[ROW][C]443.326906414096[/C][/ROW]
[ROW][C]2358.41463625693[/C][/ROW]
[ROW][C]-459.228166651762[/C][/ROW]
[ROW][C]-366.686092276445[/C][/ROW]
[ROW][C]-788.24933923038[/C][/ROW]
[ROW][C]221.857682470493[/C][/ROW]
[ROW][C]-1789.68439905851[/C][/ROW]
[ROW][C]3575.1307429011[/C][/ROW]
[ROW][C]639.708861362199[/C][/ROW]
[ROW][C]-209.773692601329[/C][/ROW]
[ROW][C]-713.751966817262[/C][/ROW]
[ROW][C]979.24918300219[/C][/ROW]
[ROW][C]2326.97019964138[/C][/ROW]
[ROW][C]2055.60615831213[/C][/ROW]
[/TABLE]
Source: https://freestatistics.org/blog/index.php?pk=62154&T=2

Globally Unique Identifier (entire table): ba.freestatistics.org/blog/index.php?pk=62154&T=2

As an alternative you can also use a QR Code:  

The GUIDs for individual cells are displayed in the table below:

Estimated ARIMA Residuals
Value
-319.559557390785
27.9743410117227
-1008.46959533542
219.863126270784
-234.491311787668
-153.082960538935
933.953124451168
411.042384090291
-961.89720235503
-744.764396776115
-784.92892986467
290.509724746436
785.730745077288
-301.538747036842
-780.030839489239
1454.61282130082
1455.43851042382
411.425730256672
-489.069183914927
-338.63085750037
-193.728983946927
-2756.28930305837
-138.899095490555
-1123.79015926020
1375.20173898251
-1535.1755035624
-1580.22317024033
-64.5953189787947
-1328.41699726220
-3198.05965476559
1102.44538925562
1119.07222818829
-2973.61872170023
2265.07317206589
443.326906414096
2358.41463625693
-459.228166651762
-366.686092276445
-788.24933923038
221.857682470493
-1789.68439905851
3575.1307429011
639.708861362199
-209.773692601329
-713.751966817262
979.24918300219
2326.97019964138
2055.60615831213


Parameters (Session):
par1 = FALSE ; par2 = 1 ; par3 = 1 ; par4 = 1 ; par5 = 12 ; par6 = 3 ; par7 = 1 ; par8 = 2 ; par9 = 1 ;
Parameters (R input):
par1 = FALSE ; par2 = 1 ; par3 = 1 ; par4 = 1 ; par5 = 12 ; par6 = 3 ; par7 = 1 ; par8 = 2 ; par9 = 1 ;
R code (references can be found in the software module):
library(lattice)
if (par1 == 'TRUE') par1 <- TRUE
if (par1 == 'FALSE') par1 <- FALSE
par2 <- as.numeric(par2) #Box-Cox lambda transformation parameter
par3 <- as.numeric(par3) #degree of non-seasonal differencing
par4 <- as.numeric(par4) #degree of seasonal differencing
par5 <- as.numeric(par5) #seasonal period
par6 <- as.numeric(par6) #degree (p) of the non-seasonal AR(p) polynomial
par7 <- as.numeric(par7) #degree (q) of the non-seasonal MA(q) polynomial
par8 <- as.numeric(par8) #degree (P) of the seasonal AR(P) polynomial
par9 <- as.numeric(par9) #degree (Q) of the seasonal MA(Q) polynomial
armaGR <- function(arima.out, names, n){
try1 <- arima.out$coef
try2 <- sqrt(diag(arima.out$var.coef))
try.data.frame <- data.frame(matrix(NA,ncol=4,nrow=length(names)))
dimnames(try.data.frame) <- list(names,c('coef','std','tstat','pv'))
try.data.frame[,1] <- try1
for(i in 1:length(try2)) try.data.frame[which(rownames(try.data.frame)==names(try2)[i]),2] <- try2[i]
try.data.frame[,3] <- try.data.frame[,1] / try.data.frame[,2]
try.data.frame[,4] <- round((1-pt(abs(try.data.frame[,3]),df=n-(length(try2)+1)))*2,5)
vector <- rep(NA,length(names))
vector[is.na(try.data.frame[,4])] <- 0
maxi <- which.max(try.data.frame[,4])
continue <- max(try.data.frame[,4],na.rm=TRUE) > .05
vector[maxi] <- 0
list(summary=try.data.frame,next.vector=vector,continue=continue)
}
arimaSelect <- function(series, order=c(13,0,0), seasonal=list(order=c(2,0,0),period=12), include.mean=F){
nrc <- order[1]+order[3]+seasonal$order[1]+seasonal$order[3]
coeff <- matrix(NA, nrow=nrc*2, ncol=nrc)
pval <- matrix(NA, nrow=nrc*2, ncol=nrc)
mylist <- rep(list(NULL), nrc)
names <- NULL
if(order[1] > 0) names <- paste('ar',1:order[1],sep='')
if(order[3] > 0) names <- c( names , paste('ma',1:order[3],sep='') )
if(seasonal$order[1] > 0) names <- c(names, paste('sar',1:seasonal$order[1],sep=''))
if(seasonal$order[3] > 0) names <- c(names, paste('sma',1:seasonal$order[3],sep=''))
arima.out <- arima(series, order=order, seasonal=seasonal, include.mean=include.mean, method='ML')
mylist[[1]] <- arima.out
last.arma <- armaGR(arima.out, names, length(series))
mystop <- FALSE
i <- 1
coeff[i,] <- last.arma[[1]][,1]
pval [i,] <- last.arma[[1]][,4]
i <- 2
aic <- arima.out$aic
while(!mystop){
mylist[[i]] <- arima.out
arima.out <- arima(series, order=order, seasonal=seasonal, include.mean=include.mean, method='ML', fixed=last.arma$next.vector)
aic <- c(aic, arima.out$aic)
last.arma <- armaGR(arima.out, names, length(series))
mystop <- !last.arma$continue
coeff[i,] <- last.arma[[1]][,1]
pval [i,] <- last.arma[[1]][,4]
i <- i+1
}
list(coeff, pval, mylist, aic=aic)
}
arimaSelectplot <- function(arimaSelect.out,noms,choix){
noms <- names(arimaSelect.out[[3]][[1]]$coef)
coeff <- arimaSelect.out[[1]]
k <- min(which(is.na(coeff[,1])))-1
coeff <- coeff[1:k,]
pval <- arimaSelect.out[[2]][1:k,]
aic <- arimaSelect.out$aic[1:k]
coeff[coeff==0] <- NA
n <- ncol(coeff)
if(missing(choix)) choix <- k
layout(matrix(c(1,1,1,2,
3,3,3,2,
3,3,3,4,
5,6,7,7),nr=4),
widths=c(10,35,45,15),
heights=c(30,30,15,15))
couleurs <- rainbow(75)[1:50]#(50)
ticks <- pretty(coeff)
par(mar=c(1,1,3,1))
plot(aic,k:1-.5,type='o',pch=21,bg='blue',cex=2,axes=F,lty=2,xpd=NA)
points(aic[choix],k-choix+.5,pch=21,cex=4,bg=2,xpd=NA)
title('aic',line=2)
par(mar=c(3,0,0,0))
plot(0,axes=F,xlab='',ylab='',xlim=range(ticks),ylim=c(.1,1))
rect(xleft = min(ticks) + (0:49)/50*(max(ticks)-min(ticks)),
xright = min(ticks) + (1:50)/50*(max(ticks)-min(ticks)),
ytop = rep(1,50),
ybottom= rep(0,50),col=couleurs,border=NA)
axis(1,ticks)
rect(xleft=min(ticks),xright=max(ticks),ytop=1,ybottom=0)
text(mean(coeff,na.rm=T),.5,'coefficients',cex=2,font=2)
par(mar=c(1,1,3,1))
image(1:n,1:k,t(coeff[k:1,]),axes=F,col=couleurs,zlim=range(ticks))
for(i in 1:n) for(j in 1:k) if(!is.na(coeff[j,i])) {
if(pval[j,i]<.01) symb = 'green'
else if( (pval[j,i]<.05) & (pval[j,i]>=.01)) symb = 'orange'
else if( (pval[j,i]<.1) & (pval[j,i]>=.05)) symb = 'red'
else symb = 'black'
polygon(c(i+.5 ,i+.2 ,i+.5 ,i+.5),
c(k-j+0.5,k-j+0.5,k-j+0.8,k-j+0.5),
col=symb)
if(j==choix) {
rect(xleft=i-.5,
xright=i+.5,
ybottom=k-j+1.5,
ytop=k-j+.5,
lwd=4)
text(i,
k-j+1,
round(coeff[j,i],2),
cex=1.2,
font=2)
}
else{
rect(xleft=i-.5,xright=i+.5,ybottom=k-j+1.5,ytop=k-j+.5)
text(i,k-j+1,round(coeff[j,i],2),cex=1.2,font=1)
}
}
axis(3,1:n,noms)
par(mar=c(0.5,0,0,0.5))
plot(0,axes=F,xlab='',ylab='',type='n',xlim=c(0,8),ylim=c(-.2,.8))
cols <- c('green','orange','red','black')
niv <- c('0','0.01','0.05','0.1')
for(i in 0:3){
polygon(c(1+2*i ,1+2*i ,1+2*i-.5 ,1+2*i),
c(.4 ,.7 , .4 , .4),
col=cols[i+1])
text(2*i,0.5,niv[i+1],cex=1.5)
}
text(8,.5,1,cex=1.5)
text(4,0,'p-value',cex=2)
box()
residus <- arimaSelect.out[[3]][[choix]]$res
par(mar=c(1,2,4,1))
acf(residus,main='')
title('acf',line=.5)
par(mar=c(1,2,4,1))
pacf(residus,main='')
title('pacf',line=.5)
par(mar=c(2,2,4,1))
qqnorm(residus,main='')
title('qq-norm',line=.5)
qqline(residus)
residus
}
if (par2 == 0) x <- log(x)
if (par2 != 0) x <- x^par2
(selection <- arimaSelect(x, order=c(par6,par3,par7), seasonal=list(order=c(par8,par4,par9), period=par5)))
bitmap(file='test1.png')
resid <- arimaSelectplot(selection)
dev.off()
resid
bitmap(file='test2.png')
acf(resid,length(resid)/2, main='Residual Autocorrelation Function')
dev.off()
bitmap(file='test3.png')
pacf(resid,length(resid)/2, main='Residual Partial Autocorrelation Function')
dev.off()
bitmap(file='test4.png')
cpgram(resid, main='Residual Cumulative Periodogram')
dev.off()
bitmap(file='test5.png')
hist(resid, main='Residual Histogram', xlab='values of Residuals')
dev.off()
bitmap(file='test6.png')
densityplot(~resid,col='black',main='Residual Density Plot', xlab='values of Residuals')
dev.off()
bitmap(file='test7.png')
qqnorm(resid, main='Residual Normal Q-Q Plot')
qqline(resid)
dev.off()
ncols <- length(selection[[1]][1,])
nrows <- length(selection[[2]][,1])-1
load(file='createtable')
a<-table.start()
a<-table.row.start(a)
a<-table.element(a,'ARIMA Parameter Estimation and Backward Selection', ncols+1,TRUE)
a<-table.row.end(a)
a<-table.row.start(a)
a<-table.element(a,'Iteration', header=TRUE)
for (i in 1:ncols) {
a<-table.element(a,names(selection[[3]][[1]]$coef)[i],header=TRUE)
}
a<-table.row.end(a)
for (j in 1:nrows) {
a<-table.row.start(a)
mydum <- 'Estimates ('
mydum <- paste(mydum,j)
mydum <- paste(mydum,')')
a<-table.element(a,mydum, header=TRUE)
for (i in 1:ncols) {
a<-table.element(a,round(selection[[1]][j,i],4))
}
a<-table.row.end(a)
a<-table.row.start(a)
a<-table.element(a,'(p-val)', header=TRUE)
for (i in 1:ncols) {
mydum <- '('
mydum <- paste(mydum,round(selection[[2]][j,i],4),sep='')
mydum <- paste(mydum,')')
a<-table.element(a,mydum)
}
a<-table.row.end(a)
}
a<-table.end(a)
table.save(a,file='mytable.tab')
a<-table.start()
a<-table.row.start(a)
a<-table.element(a,'Estimated ARIMA Residuals', 1,TRUE)
a<-table.row.end(a)
a<-table.row.start(a)
a<-table.element(a,'Value', 1,TRUE)
a<-table.row.end(a)
for (i in (par4*par5+par3):length(resid)) {
a<-table.row.start(a)
a<-table.element(a,resid[i])
a<-table.row.end(a)
}
a<-table.end(a)
table.save(a,file='mytable1.tab')