Free Statistics

of Irreproducible Research!

Author's title

Author*The author of this computation has been verified*
R Software Modulerwasp_autocorrelation.wasp
Title produced by software(Partial) Autocorrelation Function
Date of computationWed, 02 Dec 2009 07:24:55 -0700
Cite this page as followsStatistical Computations at FreeStatistics.org, Office for Research Development and Education, URL https://freestatistics.org/blog/index.php?v=date/2009/Dec/02/t1259764043lf65f5r9e44j99j.htm/, Retrieved Sun, 28 Apr 2024 05:38:06 +0000
Statistical Computations at FreeStatistics.org, Office for Research Development and Education, URL https://freestatistics.org/blog/index.php?pk=62360, Retrieved Sun, 28 Apr 2024 05:38:06 +0000
QR Codes:

Original text written by user:
IsPrivate?No (this computation is public)
User-defined keywords
Estimated Impact149
Family? (F = Feedback message, R = changed R code, M = changed R Module, P = changed Parameters, D = changed Data)
-     [Univariate Data Series] [data set] [2008-12-01 19:54:57] [b98453cac15ba1066b407e146608df68]
- RMP   [(Partial) Autocorrelation Function] [] [2009-11-27 14:46:03] [b98453cac15ba1066b407e146608df68]
-   PD      [(Partial) Autocorrelation Function] [ACF(1)] [2009-12-02 14:24:55] [a93df6747c5c78315f2ee9914aea3ec6] [Current]
Feedback Forum

Post a new message
Dataseries X:
2.085
2.053
2.077
2.058
2.057
2.076
2.07
2.062
2.073
2.061
2.094
2.067
2.086
2.276
2.326
2.349
2.52
2.628
2.577
2.698
2.814
2.968
3.041
3.278
3.328
3.5
3.563
3.569
3.69
3.819
3.79
3.956
4.063
4.047
4.029
3.941
4.022
3.879
4.022
4.028
4.091
3.987
4.01
4.007
4.191
4.299
4.273
3.82
3.15
2.486
1.812
1.257
1.062
0.842
0.782
0.698
0.358
0.347
0.363
0.359
0.355


Summary of computational transaction
Raw Inputview raw input (R code)
Raw Outputview raw output of R engine
Computing time1 seconds
R Server'Gwilym Jenkins' @ 72.249.127.135

\begin{tabular}{lllllllll}
\hline
Summary of computational transaction \tabularnewline
Raw Input & view raw input (R code)  \tabularnewline
Raw Output & view raw output of R engine  \tabularnewline
Computing time & 1 seconds \tabularnewline
R Server & 'Gwilym Jenkins' @ 72.249.127.135 \tabularnewline
\hline
\end{tabular}
%Source: https://freestatistics.org/blog/index.php?pk=62360&T=0

[TABLE]
[ROW][C]Summary of computational transaction[/C][/ROW]
[ROW][C]Raw Input[/C][C]view raw input (R code) [/C][/ROW]
[ROW][C]Raw Output[/C][C]view raw output of R engine [/C][/ROW]
[ROW][C]Computing time[/C][C]1 seconds[/C][/ROW]
[ROW][C]R Server[/C][C]'Gwilym Jenkins' @ 72.249.127.135[/C][/ROW]
[/TABLE]
Source: https://freestatistics.org/blog/index.php?pk=62360&T=0

Globally Unique Identifier (entire table): ba.freestatistics.org/blog/index.php?pk=62360&T=0

As an alternative you can also use a QR Code:  

The GUIDs for individual cells are displayed in the table below:

Summary of computational transaction
Raw Inputview raw input (R code)
Raw Outputview raw output of R engine
Computing time1 seconds
R Server'Gwilym Jenkins' @ 72.249.127.135


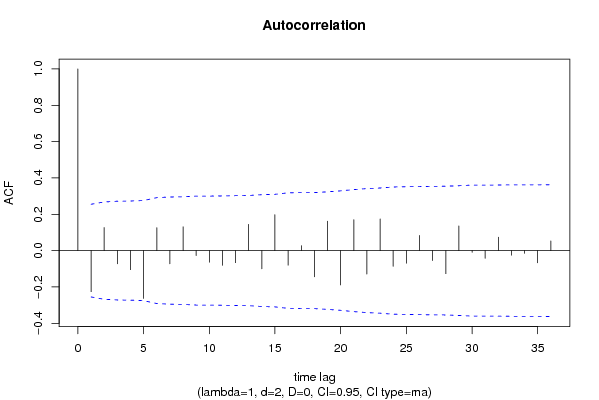
Autocorrelation Function
Time lag kACF(k)T-STATP-value
1-0.226212-1.73760.043752
20.1266660.97290.167277
3-0.072595-0.55760.289609
4-0.105093-0.80720.211386
5-0.263081-2.02080.023925
60.1260640.96830.16842
7-0.073087-0.56140.288328
80.131281.00840.158694
9-0.02755-0.21160.416567
10-0.064134-0.49260.312054
11-0.08106-0.62260.267963
12-0.06666-0.5120.305272
130.1444021.10920.135929
14-0.100127-0.76910.222455
150.1976961.51850.06711
16-0.08038-0.61740.26967
170.0267320.20530.419011
18-0.144539-1.11020.135703
190.1619631.24410.109199
20-0.188932-1.45120.076008
210.170021.3060.098319
22-0.129203-0.99240.162521
230.1740461.33690.093199
24-0.086856-0.66720.253638
25-0.069292-0.53220.298278
260.0834530.6410.261998
27-0.05494-0.4220.337278
28-0.127347-0.97820.165992
290.136071.04520.150104
30-0.00957-0.07350.470826
31-0.04227-0.32470.373286
320.0735790.56520.287051
33-0.025564-0.19640.4225
34-0.014652-0.11250.455387
35-0.067544-0.51880.302914
360.0531490.40820.342285

\begin{tabular}{lllllllll}
\hline
Autocorrelation Function \tabularnewline
Time lag k & ACF(k) & T-STAT & P-value \tabularnewline
1 & -0.226212 & -1.7376 & 0.043752 \tabularnewline
2 & 0.126666 & 0.9729 & 0.167277 \tabularnewline
3 & -0.072595 & -0.5576 & 0.289609 \tabularnewline
4 & -0.105093 & -0.8072 & 0.211386 \tabularnewline
5 & -0.263081 & -2.0208 & 0.023925 \tabularnewline
6 & 0.126064 & 0.9683 & 0.16842 \tabularnewline
7 & -0.073087 & -0.5614 & 0.288328 \tabularnewline
8 & 0.13128 & 1.0084 & 0.158694 \tabularnewline
9 & -0.02755 & -0.2116 & 0.416567 \tabularnewline
10 & -0.064134 & -0.4926 & 0.312054 \tabularnewline
11 & -0.08106 & -0.6226 & 0.267963 \tabularnewline
12 & -0.06666 & -0.512 & 0.305272 \tabularnewline
13 & 0.144402 & 1.1092 & 0.135929 \tabularnewline
14 & -0.100127 & -0.7691 & 0.222455 \tabularnewline
15 & 0.197696 & 1.5185 & 0.06711 \tabularnewline
16 & -0.08038 & -0.6174 & 0.26967 \tabularnewline
17 & 0.026732 & 0.2053 & 0.419011 \tabularnewline
18 & -0.144539 & -1.1102 & 0.135703 \tabularnewline
19 & 0.161963 & 1.2441 & 0.109199 \tabularnewline
20 & -0.188932 & -1.4512 & 0.076008 \tabularnewline
21 & 0.17002 & 1.306 & 0.098319 \tabularnewline
22 & -0.129203 & -0.9924 & 0.162521 \tabularnewline
23 & 0.174046 & 1.3369 & 0.093199 \tabularnewline
24 & -0.086856 & -0.6672 & 0.253638 \tabularnewline
25 & -0.069292 & -0.5322 & 0.298278 \tabularnewline
26 & 0.083453 & 0.641 & 0.261998 \tabularnewline
27 & -0.05494 & -0.422 & 0.337278 \tabularnewline
28 & -0.127347 & -0.9782 & 0.165992 \tabularnewline
29 & 0.13607 & 1.0452 & 0.150104 \tabularnewline
30 & -0.00957 & -0.0735 & 0.470826 \tabularnewline
31 & -0.04227 & -0.3247 & 0.373286 \tabularnewline
32 & 0.073579 & 0.5652 & 0.287051 \tabularnewline
33 & -0.025564 & -0.1964 & 0.4225 \tabularnewline
34 & -0.014652 & -0.1125 & 0.455387 \tabularnewline
35 & -0.067544 & -0.5188 & 0.302914 \tabularnewline
36 & 0.053149 & 0.4082 & 0.342285 \tabularnewline
\hline
\end{tabular}
%Source: https://freestatistics.org/blog/index.php?pk=62360&T=1

[TABLE]
[ROW][C]Autocorrelation Function[/C][/ROW]
[ROW][C]Time lag k[/C][C]ACF(k)[/C][C]T-STAT[/C][C]P-value[/C][/ROW]
[ROW][C]1[/C][C]-0.226212[/C][C]-1.7376[/C][C]0.043752[/C][/ROW]
[ROW][C]2[/C][C]0.126666[/C][C]0.9729[/C][C]0.167277[/C][/ROW]
[ROW][C]3[/C][C]-0.072595[/C][C]-0.5576[/C][C]0.289609[/C][/ROW]
[ROW][C]4[/C][C]-0.105093[/C][C]-0.8072[/C][C]0.211386[/C][/ROW]
[ROW][C]5[/C][C]-0.263081[/C][C]-2.0208[/C][C]0.023925[/C][/ROW]
[ROW][C]6[/C][C]0.126064[/C][C]0.9683[/C][C]0.16842[/C][/ROW]
[ROW][C]7[/C][C]-0.073087[/C][C]-0.5614[/C][C]0.288328[/C][/ROW]
[ROW][C]8[/C][C]0.13128[/C][C]1.0084[/C][C]0.158694[/C][/ROW]
[ROW][C]9[/C][C]-0.02755[/C][C]-0.2116[/C][C]0.416567[/C][/ROW]
[ROW][C]10[/C][C]-0.064134[/C][C]-0.4926[/C][C]0.312054[/C][/ROW]
[ROW][C]11[/C][C]-0.08106[/C][C]-0.6226[/C][C]0.267963[/C][/ROW]
[ROW][C]12[/C][C]-0.06666[/C][C]-0.512[/C][C]0.305272[/C][/ROW]
[ROW][C]13[/C][C]0.144402[/C][C]1.1092[/C][C]0.135929[/C][/ROW]
[ROW][C]14[/C][C]-0.100127[/C][C]-0.7691[/C][C]0.222455[/C][/ROW]
[ROW][C]15[/C][C]0.197696[/C][C]1.5185[/C][C]0.06711[/C][/ROW]
[ROW][C]16[/C][C]-0.08038[/C][C]-0.6174[/C][C]0.26967[/C][/ROW]
[ROW][C]17[/C][C]0.026732[/C][C]0.2053[/C][C]0.419011[/C][/ROW]
[ROW][C]18[/C][C]-0.144539[/C][C]-1.1102[/C][C]0.135703[/C][/ROW]
[ROW][C]19[/C][C]0.161963[/C][C]1.2441[/C][C]0.109199[/C][/ROW]
[ROW][C]20[/C][C]-0.188932[/C][C]-1.4512[/C][C]0.076008[/C][/ROW]
[ROW][C]21[/C][C]0.17002[/C][C]1.306[/C][C]0.098319[/C][/ROW]
[ROW][C]22[/C][C]-0.129203[/C][C]-0.9924[/C][C]0.162521[/C][/ROW]
[ROW][C]23[/C][C]0.174046[/C][C]1.3369[/C][C]0.093199[/C][/ROW]
[ROW][C]24[/C][C]-0.086856[/C][C]-0.6672[/C][C]0.253638[/C][/ROW]
[ROW][C]25[/C][C]-0.069292[/C][C]-0.5322[/C][C]0.298278[/C][/ROW]
[ROW][C]26[/C][C]0.083453[/C][C]0.641[/C][C]0.261998[/C][/ROW]
[ROW][C]27[/C][C]-0.05494[/C][C]-0.422[/C][C]0.337278[/C][/ROW]
[ROW][C]28[/C][C]-0.127347[/C][C]-0.9782[/C][C]0.165992[/C][/ROW]
[ROW][C]29[/C][C]0.13607[/C][C]1.0452[/C][C]0.150104[/C][/ROW]
[ROW][C]30[/C][C]-0.00957[/C][C]-0.0735[/C][C]0.470826[/C][/ROW]
[ROW][C]31[/C][C]-0.04227[/C][C]-0.3247[/C][C]0.373286[/C][/ROW]
[ROW][C]32[/C][C]0.073579[/C][C]0.5652[/C][C]0.287051[/C][/ROW]
[ROW][C]33[/C][C]-0.025564[/C][C]-0.1964[/C][C]0.4225[/C][/ROW]
[ROW][C]34[/C][C]-0.014652[/C][C]-0.1125[/C][C]0.455387[/C][/ROW]
[ROW][C]35[/C][C]-0.067544[/C][C]-0.5188[/C][C]0.302914[/C][/ROW]
[ROW][C]36[/C][C]0.053149[/C][C]0.4082[/C][C]0.342285[/C][/ROW]
[/TABLE]
Source: https://freestatistics.org/blog/index.php?pk=62360&T=1

Globally Unique Identifier (entire table): ba.freestatistics.org/blog/index.php?pk=62360&T=1

As an alternative you can also use a QR Code:  

The GUIDs for individual cells are displayed in the table below:

Autocorrelation Function
Time lag kACF(k)T-STATP-value
1-0.226212-1.73760.043752
20.1266660.97290.167277
3-0.072595-0.55760.289609
4-0.105093-0.80720.211386
5-0.263081-2.02080.023925
60.1260640.96830.16842
7-0.073087-0.56140.288328
80.131281.00840.158694
9-0.02755-0.21160.416567
10-0.064134-0.49260.312054
11-0.08106-0.62260.267963
12-0.06666-0.5120.305272
130.1444021.10920.135929
14-0.100127-0.76910.222455
150.1976961.51850.06711
16-0.08038-0.61740.26967
170.0267320.20530.419011
18-0.144539-1.11020.135703
190.1619631.24410.109199
20-0.188932-1.45120.076008
210.170021.3060.098319
22-0.129203-0.99240.162521
230.1740461.33690.093199
24-0.086856-0.66720.253638
25-0.069292-0.53220.298278
260.0834530.6410.261998
27-0.05494-0.4220.337278
28-0.127347-0.97820.165992
290.136071.04520.150104
30-0.00957-0.07350.470826
31-0.04227-0.32470.373286
320.0735790.56520.287051
33-0.025564-0.19640.4225
34-0.014652-0.11250.455387
35-0.067544-0.51880.302914
360.0531490.40820.342285


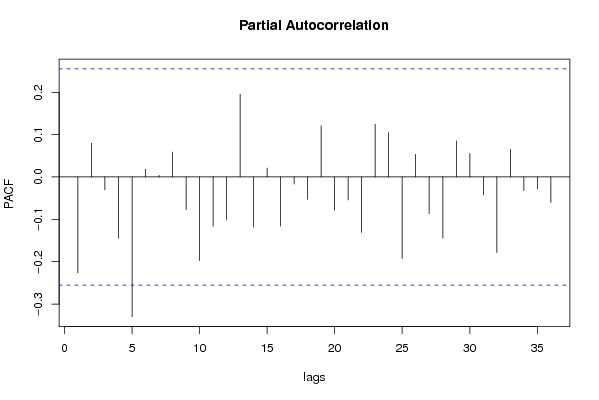
Partial Autocorrelation Function
Time lag kPACF(k)T-STATP-value
1-0.226212-1.73760.043752
20.0795660.61120.271722
3-0.029934-0.22990.40947
4-0.144479-1.10980.135801
5-0.329822-2.53340.006987
60.0184180.14150.44399
70.0036770.02820.488782
80.0587340.45110.32677
9-0.077154-0.59260.277846
10-0.197333-1.51570.067462
11-0.116078-0.89160.188111
12-0.101503-0.77970.219354
130.1955681.50220.069191
14-0.118163-0.90760.183884
150.0210910.1620.435927
16-0.115868-0.890.188541
17-0.016589-0.12740.44952
18-0.053029-0.40730.342621
190.1208280.92810.178569
20-0.078549-0.60330.274296
21-0.054045-0.41510.339779
22-0.130942-1.00580.159313
230.1250520.96050.170352
240.1049350.8060.211733
25-0.192236-1.47660.072552
260.0536060.41180.341005
27-0.086362-0.66340.254842
28-0.144154-1.10730.136336
290.0852710.6550.257512
300.0556530.42750.335292
31-0.042327-0.32510.37312
32-0.17818-1.36860.088152
330.0653360.50190.308818
34-0.031952-0.24540.403488
35-0.028634-0.21990.413337
36-0.060078-0.46150.32308

\begin{tabular}{lllllllll}
\hline
Partial Autocorrelation Function \tabularnewline
Time lag k & PACF(k) & T-STAT & P-value \tabularnewline
1 & -0.226212 & -1.7376 & 0.043752 \tabularnewline
2 & 0.079566 & 0.6112 & 0.271722 \tabularnewline
3 & -0.029934 & -0.2299 & 0.40947 \tabularnewline
4 & -0.144479 & -1.1098 & 0.135801 \tabularnewline
5 & -0.329822 & -2.5334 & 0.006987 \tabularnewline
6 & 0.018418 & 0.1415 & 0.44399 \tabularnewline
7 & 0.003677 & 0.0282 & 0.488782 \tabularnewline
8 & 0.058734 & 0.4511 & 0.32677 \tabularnewline
9 & -0.077154 & -0.5926 & 0.277846 \tabularnewline
10 & -0.197333 & -1.5157 & 0.067462 \tabularnewline
11 & -0.116078 & -0.8916 & 0.188111 \tabularnewline
12 & -0.101503 & -0.7797 & 0.219354 \tabularnewline
13 & 0.195568 & 1.5022 & 0.069191 \tabularnewline
14 & -0.118163 & -0.9076 & 0.183884 \tabularnewline
15 & 0.021091 & 0.162 & 0.435927 \tabularnewline
16 & -0.115868 & -0.89 & 0.188541 \tabularnewline
17 & -0.016589 & -0.1274 & 0.44952 \tabularnewline
18 & -0.053029 & -0.4073 & 0.342621 \tabularnewline
19 & 0.120828 & 0.9281 & 0.178569 \tabularnewline
20 & -0.078549 & -0.6033 & 0.274296 \tabularnewline
21 & -0.054045 & -0.4151 & 0.339779 \tabularnewline
22 & -0.130942 & -1.0058 & 0.159313 \tabularnewline
23 & 0.125052 & 0.9605 & 0.170352 \tabularnewline
24 & 0.104935 & 0.806 & 0.211733 \tabularnewline
25 & -0.192236 & -1.4766 & 0.072552 \tabularnewline
26 & 0.053606 & 0.4118 & 0.341005 \tabularnewline
27 & -0.086362 & -0.6634 & 0.254842 \tabularnewline
28 & -0.144154 & -1.1073 & 0.136336 \tabularnewline
29 & 0.085271 & 0.655 & 0.257512 \tabularnewline
30 & 0.055653 & 0.4275 & 0.335292 \tabularnewline
31 & -0.042327 & -0.3251 & 0.37312 \tabularnewline
32 & -0.17818 & -1.3686 & 0.088152 \tabularnewline
33 & 0.065336 & 0.5019 & 0.308818 \tabularnewline
34 & -0.031952 & -0.2454 & 0.403488 \tabularnewline
35 & -0.028634 & -0.2199 & 0.413337 \tabularnewline
36 & -0.060078 & -0.4615 & 0.32308 \tabularnewline
\hline
\end{tabular}
%Source: https://freestatistics.org/blog/index.php?pk=62360&T=2

[TABLE]
[ROW][C]Partial Autocorrelation Function[/C][/ROW]
[ROW][C]Time lag k[/C][C]PACF(k)[/C][C]T-STAT[/C][C]P-value[/C][/ROW]
[ROW][C]1[/C][C]-0.226212[/C][C]-1.7376[/C][C]0.043752[/C][/ROW]
[ROW][C]2[/C][C]0.079566[/C][C]0.6112[/C][C]0.271722[/C][/ROW]
[ROW][C]3[/C][C]-0.029934[/C][C]-0.2299[/C][C]0.40947[/C][/ROW]
[ROW][C]4[/C][C]-0.144479[/C][C]-1.1098[/C][C]0.135801[/C][/ROW]
[ROW][C]5[/C][C]-0.329822[/C][C]-2.5334[/C][C]0.006987[/C][/ROW]
[ROW][C]6[/C][C]0.018418[/C][C]0.1415[/C][C]0.44399[/C][/ROW]
[ROW][C]7[/C][C]0.003677[/C][C]0.0282[/C][C]0.488782[/C][/ROW]
[ROW][C]8[/C][C]0.058734[/C][C]0.4511[/C][C]0.32677[/C][/ROW]
[ROW][C]9[/C][C]-0.077154[/C][C]-0.5926[/C][C]0.277846[/C][/ROW]
[ROW][C]10[/C][C]-0.197333[/C][C]-1.5157[/C][C]0.067462[/C][/ROW]
[ROW][C]11[/C][C]-0.116078[/C][C]-0.8916[/C][C]0.188111[/C][/ROW]
[ROW][C]12[/C][C]-0.101503[/C][C]-0.7797[/C][C]0.219354[/C][/ROW]
[ROW][C]13[/C][C]0.195568[/C][C]1.5022[/C][C]0.069191[/C][/ROW]
[ROW][C]14[/C][C]-0.118163[/C][C]-0.9076[/C][C]0.183884[/C][/ROW]
[ROW][C]15[/C][C]0.021091[/C][C]0.162[/C][C]0.435927[/C][/ROW]
[ROW][C]16[/C][C]-0.115868[/C][C]-0.89[/C][C]0.188541[/C][/ROW]
[ROW][C]17[/C][C]-0.016589[/C][C]-0.1274[/C][C]0.44952[/C][/ROW]
[ROW][C]18[/C][C]-0.053029[/C][C]-0.4073[/C][C]0.342621[/C][/ROW]
[ROW][C]19[/C][C]0.120828[/C][C]0.9281[/C][C]0.178569[/C][/ROW]
[ROW][C]20[/C][C]-0.078549[/C][C]-0.6033[/C][C]0.274296[/C][/ROW]
[ROW][C]21[/C][C]-0.054045[/C][C]-0.4151[/C][C]0.339779[/C][/ROW]
[ROW][C]22[/C][C]-0.130942[/C][C]-1.0058[/C][C]0.159313[/C][/ROW]
[ROW][C]23[/C][C]0.125052[/C][C]0.9605[/C][C]0.170352[/C][/ROW]
[ROW][C]24[/C][C]0.104935[/C][C]0.806[/C][C]0.211733[/C][/ROW]
[ROW][C]25[/C][C]-0.192236[/C][C]-1.4766[/C][C]0.072552[/C][/ROW]
[ROW][C]26[/C][C]0.053606[/C][C]0.4118[/C][C]0.341005[/C][/ROW]
[ROW][C]27[/C][C]-0.086362[/C][C]-0.6634[/C][C]0.254842[/C][/ROW]
[ROW][C]28[/C][C]-0.144154[/C][C]-1.1073[/C][C]0.136336[/C][/ROW]
[ROW][C]29[/C][C]0.085271[/C][C]0.655[/C][C]0.257512[/C][/ROW]
[ROW][C]30[/C][C]0.055653[/C][C]0.4275[/C][C]0.335292[/C][/ROW]
[ROW][C]31[/C][C]-0.042327[/C][C]-0.3251[/C][C]0.37312[/C][/ROW]
[ROW][C]32[/C][C]-0.17818[/C][C]-1.3686[/C][C]0.088152[/C][/ROW]
[ROW][C]33[/C][C]0.065336[/C][C]0.5019[/C][C]0.308818[/C][/ROW]
[ROW][C]34[/C][C]-0.031952[/C][C]-0.2454[/C][C]0.403488[/C][/ROW]
[ROW][C]35[/C][C]-0.028634[/C][C]-0.2199[/C][C]0.413337[/C][/ROW]
[ROW][C]36[/C][C]-0.060078[/C][C]-0.4615[/C][C]0.32308[/C][/ROW]
[/TABLE]
Source: https://freestatistics.org/blog/index.php?pk=62360&T=2

Globally Unique Identifier (entire table): ba.freestatistics.org/blog/index.php?pk=62360&T=2

As an alternative you can also use a QR Code:  

The GUIDs for individual cells are displayed in the table below:

Partial Autocorrelation Function
Time lag kPACF(k)T-STATP-value
1-0.226212-1.73760.043752
20.0795660.61120.271722
3-0.029934-0.22990.40947
4-0.144479-1.10980.135801
5-0.329822-2.53340.006987
60.0184180.14150.44399
70.0036770.02820.488782
80.0587340.45110.32677
9-0.077154-0.59260.277846
10-0.197333-1.51570.067462
11-0.116078-0.89160.188111
12-0.101503-0.77970.219354
130.1955681.50220.069191
14-0.118163-0.90760.183884
150.0210910.1620.435927
16-0.115868-0.890.188541
17-0.016589-0.12740.44952
18-0.053029-0.40730.342621
190.1208280.92810.178569
20-0.078549-0.60330.274296
21-0.054045-0.41510.339779
22-0.130942-1.00580.159313
230.1250520.96050.170352
240.1049350.8060.211733
25-0.192236-1.47660.072552
260.0536060.41180.341005
27-0.086362-0.66340.254842
28-0.144154-1.10730.136336
290.0852710.6550.257512
300.0556530.42750.335292
31-0.042327-0.32510.37312
32-0.17818-1.36860.088152
330.0653360.50190.308818
34-0.031952-0.24540.403488
35-0.028634-0.21990.413337
36-0.060078-0.46150.32308


Parameters (Session):
par1 = 36 ; par2 = 1.0 ; par3 = 2 ; par4 = 0 ; par5 = 12 ; par6 = MA ; par7 = 0.95 ;
Parameters (R input):
par1 = 36 ; par2 = 1.0 ; par3 = 2 ; par4 = 0 ; par5 = 12 ; par6 = MA ; par7 = 0.95 ;
R code (references can be found in the software module):
if (par1 == 'Default') {
par1 = 10*log10(length(x))
} else {
par1 <- as.numeric(par1)
}
par2 <- as.numeric(par2)
par3 <- as.numeric(par3)
par4 <- as.numeric(par4)
par5 <- as.numeric(par5)
if (par6 == 'White Noise') par6 <- 'white' else par6 <- 'ma'
par7 <- as.numeric(par7)
if (par2 == 0) {
x <- log(x)
} else {
x <- (x ^ par2 - 1) / par2
}
if (par3 > 0) x <- diff(x,lag=1,difference=par3)
if (par4 > 0) x <- diff(x,lag=par5,difference=par4)
bitmap(file='pic1.png')
racf <- acf(x, par1, main='Autocorrelation', xlab='time lag', ylab='ACF', ci.type=par6, ci=par7, sub=paste('(lambda=',par2,', d=',par3,', D=',par4,', CI=', par7, ', CI type=',par6,')',sep=''))
dev.off()
bitmap(file='pic2.png')
rpacf <- pacf(x,par1,main='Partial Autocorrelation',xlab='lags',ylab='PACF')
dev.off()
(myacf <- c(racf$acf))
(mypacf <- c(rpacf$acf))
lengthx <- length(x)
sqrtn <- sqrt(lengthx)
load(file='createtable')
a<-table.start()
a<-table.row.start(a)
a<-table.element(a,'Autocorrelation Function',4,TRUE)
a<-table.row.end(a)
a<-table.row.start(a)
a<-table.element(a,'Time lag k',header=TRUE)
a<-table.element(a,hyperlink('basics.htm','ACF(k)','click here for more information about the Autocorrelation Function'),header=TRUE)
a<-table.element(a,'T-STAT',header=TRUE)
a<-table.element(a,'P-value',header=TRUE)
a<-table.row.end(a)
for (i in 2:(par1+1)) {
a<-table.row.start(a)
a<-table.element(a,i-1,header=TRUE)
a<-table.element(a,round(myacf[i],6))
mytstat <- myacf[i]*sqrtn
a<-table.element(a,round(mytstat,4))
a<-table.element(a,round(1-pt(abs(mytstat),lengthx),6))
a<-table.row.end(a)
}
a<-table.end(a)
table.save(a,file='mytable.tab')
a<-table.start()
a<-table.row.start(a)
a<-table.element(a,'Partial Autocorrelation Function',4,TRUE)
a<-table.row.end(a)
a<-table.row.start(a)
a<-table.element(a,'Time lag k',header=TRUE)
a<-table.element(a,hyperlink('basics.htm','PACF(k)','click here for more information about the Partial Autocorrelation Function'),header=TRUE)
a<-table.element(a,'T-STAT',header=TRUE)
a<-table.element(a,'P-value',header=TRUE)
a<-table.row.end(a)
for (i in 1:par1) {
a<-table.row.start(a)
a<-table.element(a,i,header=TRUE)
a<-table.element(a,round(mypacf[i],6))
mytstat <- mypacf[i]*sqrtn
a<-table.element(a,round(mytstat,4))
a<-table.element(a,round(1-pt(abs(mytstat),lengthx),6))
a<-table.row.end(a)
}
a<-table.end(a)
table.save(a,file='mytable1.tab')