Free Statistics

of Irreproducible Research!

Author's title

Author*The author of this computation has been verified*
R Software Modulerwasp_autocorrelation.wasp
Title produced by software(Partial) Autocorrelation Function
Date of computationWed, 02 Dec 2009 07:30:15 -0700
Cite this page as followsStatistical Computations at FreeStatistics.org, Office for Research Development and Education, URL https://freestatistics.org/blog/index.php?v=date/2009/Dec/02/t1259764472finbn9cb8qeixt1.htm/, Retrieved Sun, 28 Apr 2024 04:36:04 +0000
Statistical Computations at FreeStatistics.org, Office for Research Development and Education, URL https://freestatistics.org/blog/index.php?pk=62361, Retrieved Sun, 28 Apr 2024 04:36:04 +0000
QR Codes:

Original text written by user:
IsPrivate?No (this computation is public)
User-defined keywords
Estimated Impact144
Family? (F = Feedback message, R = changed R code, M = changed R Module, P = changed Parameters, D = changed Data)
-     [Univariate Data Series] [data set] [2008-12-01 19:54:57] [b98453cac15ba1066b407e146608df68]
- RMP   [(Partial) Autocorrelation Function] [] [2009-11-27 14:46:03] [b98453cac15ba1066b407e146608df68]
-    D      [(Partial) Autocorrelation Function] [ACF(2)] [2009-12-02 14:30:15] [a93df6747c5c78315f2ee9914aea3ec6] [Current]
Feedback Forum

Post a new message
Dataseries X:
2.085
2.053
2.077
2.058
2.057
2.076
2.07
2.062
2.073
2.061
2.094
2.067
2.086
2.276
2.326
2.349
2.52
2.628
2.577
2.698
2.814
2.968
3.041
3.278
3.328
3.5
3.563
3.569
3.69
3.819
3.79
3.956
4.063
4.047
4.029
3.941
4.022
3.879
4.022
4.028
4.091
3.987
4.01
4.007
4.191
4.299
4.273
3.82
3.15
2.486
1.812
1.257
1.062
0.842
0.782
0.698
0.358
0.347
0.363
0.359
0.355


Summary of computational transaction
Raw Inputview raw input (R code)
Raw Outputview raw output of R engine
Computing time1 seconds
R Server'Gwilym Jenkins' @ 72.249.127.135

\begin{tabular}{lllllllll}
\hline
Summary of computational transaction \tabularnewline
Raw Input & view raw input (R code)  \tabularnewline
Raw Output & view raw output of R engine  \tabularnewline
Computing time & 1 seconds \tabularnewline
R Server & 'Gwilym Jenkins' @ 72.249.127.135 \tabularnewline
\hline
\end{tabular}
%Source: https://freestatistics.org/blog/index.php?pk=62361&T=0

[TABLE]
[ROW][C]Summary of computational transaction[/C][/ROW]
[ROW][C]Raw Input[/C][C]view raw input (R code) [/C][/ROW]
[ROW][C]Raw Output[/C][C]view raw output of R engine [/C][/ROW]
[ROW][C]Computing time[/C][C]1 seconds[/C][/ROW]
[ROW][C]R Server[/C][C]'Gwilym Jenkins' @ 72.249.127.135[/C][/ROW]
[/TABLE]
Source: https://freestatistics.org/blog/index.php?pk=62361&T=0

Globally Unique Identifier (entire table): ba.freestatistics.org/blog/index.php?pk=62361&T=0

As an alternative you can also use a QR Code:  

The GUIDs for individual cells are displayed in the table below:

Summary of computational transaction
Raw Inputview raw input (R code)
Raw Outputview raw output of R engine
Computing time1 seconds
R Server'Gwilym Jenkins' @ 72.249.127.135


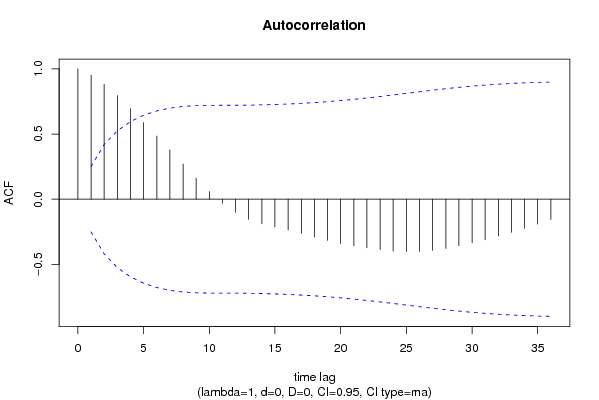
Autocorrelation Function
Time lag kACF(k)T-STATP-value
10.9523087.43780
20.8828176.8950
30.7956846.21450
40.6956095.43291e-06
50.5879674.59221.1e-05
60.4847843.78630.000176
70.3784742.9560.002213
80.2695612.10530.019693
90.1626341.27020.104416
100.0588550.45970.323693
11-0.030216-0.2360.407113
12-0.101065-0.78930.216486
13-0.154034-1.2030.116805
14-0.189158-1.47740.072361
15-0.212571-1.66020.051
16-0.236637-1.84820.034712
17-0.261987-2.04620.022528
18-0.290257-2.2670.013474
19-0.316272-2.47020.008159
20-0.340319-2.6580.005012
21-0.357577-2.79280.003486
22-0.37343-2.91660.002473
23-0.385709-3.01250.001884
24-0.39759-3.10530.001441
25-0.400876-3.13090.001337
26-0.400134-3.12510.00136
27-0.391925-3.0610.001639
28-0.377676-2.94970.002253
29-0.3566-2.78510.003559
30-0.333663-2.6060.005748
31-0.311332-2.43160.008992
32-0.283019-2.21050.015417
33-0.25392-1.98320.025927
34-0.224168-1.75080.042503
35-0.190539-1.48820.07093
36-0.155064-1.21110.115267

\begin{tabular}{lllllllll}
\hline
Autocorrelation Function \tabularnewline
Time lag k & ACF(k) & T-STAT & P-value \tabularnewline
1 & 0.952308 & 7.4378 & 0 \tabularnewline
2 & 0.882817 & 6.895 & 0 \tabularnewline
3 & 0.795684 & 6.2145 & 0 \tabularnewline
4 & 0.695609 & 5.4329 & 1e-06 \tabularnewline
5 & 0.587967 & 4.5922 & 1.1e-05 \tabularnewline
6 & 0.484784 & 3.7863 & 0.000176 \tabularnewline
7 & 0.378474 & 2.956 & 0.002213 \tabularnewline
8 & 0.269561 & 2.1053 & 0.019693 \tabularnewline
9 & 0.162634 & 1.2702 & 0.104416 \tabularnewline
10 & 0.058855 & 0.4597 & 0.323693 \tabularnewline
11 & -0.030216 & -0.236 & 0.407113 \tabularnewline
12 & -0.101065 & -0.7893 & 0.216486 \tabularnewline
13 & -0.154034 & -1.203 & 0.116805 \tabularnewline
14 & -0.189158 & -1.4774 & 0.072361 \tabularnewline
15 & -0.212571 & -1.6602 & 0.051 \tabularnewline
16 & -0.236637 & -1.8482 & 0.034712 \tabularnewline
17 & -0.261987 & -2.0462 & 0.022528 \tabularnewline
18 & -0.290257 & -2.267 & 0.013474 \tabularnewline
19 & -0.316272 & -2.4702 & 0.008159 \tabularnewline
20 & -0.340319 & -2.658 & 0.005012 \tabularnewline
21 & -0.357577 & -2.7928 & 0.003486 \tabularnewline
22 & -0.37343 & -2.9166 & 0.002473 \tabularnewline
23 & -0.385709 & -3.0125 & 0.001884 \tabularnewline
24 & -0.39759 & -3.1053 & 0.001441 \tabularnewline
25 & -0.400876 & -3.1309 & 0.001337 \tabularnewline
26 & -0.400134 & -3.1251 & 0.00136 \tabularnewline
27 & -0.391925 & -3.061 & 0.001639 \tabularnewline
28 & -0.377676 & -2.9497 & 0.002253 \tabularnewline
29 & -0.3566 & -2.7851 & 0.003559 \tabularnewline
30 & -0.333663 & -2.606 & 0.005748 \tabularnewline
31 & -0.311332 & -2.4316 & 0.008992 \tabularnewline
32 & -0.283019 & -2.2105 & 0.015417 \tabularnewline
33 & -0.25392 & -1.9832 & 0.025927 \tabularnewline
34 & -0.224168 & -1.7508 & 0.042503 \tabularnewline
35 & -0.190539 & -1.4882 & 0.07093 \tabularnewline
36 & -0.155064 & -1.2111 & 0.115267 \tabularnewline
\hline
\end{tabular}
%Source: https://freestatistics.org/blog/index.php?pk=62361&T=1

[TABLE]
[ROW][C]Autocorrelation Function[/C][/ROW]
[ROW][C]Time lag k[/C][C]ACF(k)[/C][C]T-STAT[/C][C]P-value[/C][/ROW]
[ROW][C]1[/C][C]0.952308[/C][C]7.4378[/C][C]0[/C][/ROW]
[ROW][C]2[/C][C]0.882817[/C][C]6.895[/C][C]0[/C][/ROW]
[ROW][C]3[/C][C]0.795684[/C][C]6.2145[/C][C]0[/C][/ROW]
[ROW][C]4[/C][C]0.695609[/C][C]5.4329[/C][C]1e-06[/C][/ROW]
[ROW][C]5[/C][C]0.587967[/C][C]4.5922[/C][C]1.1e-05[/C][/ROW]
[ROW][C]6[/C][C]0.484784[/C][C]3.7863[/C][C]0.000176[/C][/ROW]
[ROW][C]7[/C][C]0.378474[/C][C]2.956[/C][C]0.002213[/C][/ROW]
[ROW][C]8[/C][C]0.269561[/C][C]2.1053[/C][C]0.019693[/C][/ROW]
[ROW][C]9[/C][C]0.162634[/C][C]1.2702[/C][C]0.104416[/C][/ROW]
[ROW][C]10[/C][C]0.058855[/C][C]0.4597[/C][C]0.323693[/C][/ROW]
[ROW][C]11[/C][C]-0.030216[/C][C]-0.236[/C][C]0.407113[/C][/ROW]
[ROW][C]12[/C][C]-0.101065[/C][C]-0.7893[/C][C]0.216486[/C][/ROW]
[ROW][C]13[/C][C]-0.154034[/C][C]-1.203[/C][C]0.116805[/C][/ROW]
[ROW][C]14[/C][C]-0.189158[/C][C]-1.4774[/C][C]0.072361[/C][/ROW]
[ROW][C]15[/C][C]-0.212571[/C][C]-1.6602[/C][C]0.051[/C][/ROW]
[ROW][C]16[/C][C]-0.236637[/C][C]-1.8482[/C][C]0.034712[/C][/ROW]
[ROW][C]17[/C][C]-0.261987[/C][C]-2.0462[/C][C]0.022528[/C][/ROW]
[ROW][C]18[/C][C]-0.290257[/C][C]-2.267[/C][C]0.013474[/C][/ROW]
[ROW][C]19[/C][C]-0.316272[/C][C]-2.4702[/C][C]0.008159[/C][/ROW]
[ROW][C]20[/C][C]-0.340319[/C][C]-2.658[/C][C]0.005012[/C][/ROW]
[ROW][C]21[/C][C]-0.357577[/C][C]-2.7928[/C][C]0.003486[/C][/ROW]
[ROW][C]22[/C][C]-0.37343[/C][C]-2.9166[/C][C]0.002473[/C][/ROW]
[ROW][C]23[/C][C]-0.385709[/C][C]-3.0125[/C][C]0.001884[/C][/ROW]
[ROW][C]24[/C][C]-0.39759[/C][C]-3.1053[/C][C]0.001441[/C][/ROW]
[ROW][C]25[/C][C]-0.400876[/C][C]-3.1309[/C][C]0.001337[/C][/ROW]
[ROW][C]26[/C][C]-0.400134[/C][C]-3.1251[/C][C]0.00136[/C][/ROW]
[ROW][C]27[/C][C]-0.391925[/C][C]-3.061[/C][C]0.001639[/C][/ROW]
[ROW][C]28[/C][C]-0.377676[/C][C]-2.9497[/C][C]0.002253[/C][/ROW]
[ROW][C]29[/C][C]-0.3566[/C][C]-2.7851[/C][C]0.003559[/C][/ROW]
[ROW][C]30[/C][C]-0.333663[/C][C]-2.606[/C][C]0.005748[/C][/ROW]
[ROW][C]31[/C][C]-0.311332[/C][C]-2.4316[/C][C]0.008992[/C][/ROW]
[ROW][C]32[/C][C]-0.283019[/C][C]-2.2105[/C][C]0.015417[/C][/ROW]
[ROW][C]33[/C][C]-0.25392[/C][C]-1.9832[/C][C]0.025927[/C][/ROW]
[ROW][C]34[/C][C]-0.224168[/C][C]-1.7508[/C][C]0.042503[/C][/ROW]
[ROW][C]35[/C][C]-0.190539[/C][C]-1.4882[/C][C]0.07093[/C][/ROW]
[ROW][C]36[/C][C]-0.155064[/C][C]-1.2111[/C][C]0.115267[/C][/ROW]
[/TABLE]
Source: https://freestatistics.org/blog/index.php?pk=62361&T=1

Globally Unique Identifier (entire table): ba.freestatistics.org/blog/index.php?pk=62361&T=1

As an alternative you can also use a QR Code:  

The GUIDs for individual cells are displayed in the table below:

Autocorrelation Function
Time lag kACF(k)T-STATP-value
10.9523087.43780
20.8828176.8950
30.7956846.21450
40.6956095.43291e-06
50.5879674.59221.1e-05
60.4847843.78630.000176
70.3784742.9560.002213
80.2695612.10530.019693
90.1626341.27020.104416
100.0588550.45970.323693
11-0.030216-0.2360.407113
12-0.101065-0.78930.216486
13-0.154034-1.2030.116805
14-0.189158-1.47740.072361
15-0.212571-1.66020.051
16-0.236637-1.84820.034712
17-0.261987-2.04620.022528
18-0.290257-2.2670.013474
19-0.316272-2.47020.008159
20-0.340319-2.6580.005012
21-0.357577-2.79280.003486
22-0.37343-2.91660.002473
23-0.385709-3.01250.001884
24-0.39759-3.10530.001441
25-0.400876-3.13090.001337
26-0.400134-3.12510.00136
27-0.391925-3.0610.001639
28-0.377676-2.94970.002253
29-0.3566-2.78510.003559
30-0.333663-2.6060.005748
31-0.311332-2.43160.008992
32-0.283019-2.21050.015417
33-0.25392-1.98320.025927
34-0.224168-1.75080.042503
35-0.190539-1.48820.07093
36-0.155064-1.21110.115267


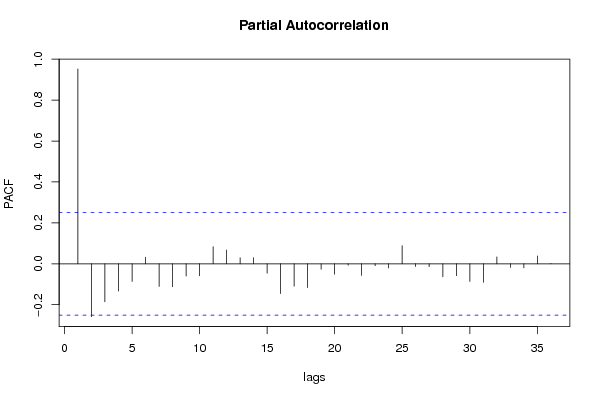
Partial Autocorrelation Function
Time lag kPACF(k)T-STATP-value
10.9523087.43780
2-0.25856-2.01940.023922
3-0.18618-1.45410.075521
4-0.133265-1.04080.15103
5-0.086629-0.67660.25061
60.0324190.25320.400482
7-0.111051-0.86730.19458
8-0.112429-0.87810.191668
9-0.060116-0.46950.320187
10-0.058867-0.45980.323659
110.083230.650.25905
120.0669140.52260.301568
130.0292790.22870.409943
140.0295310.23060.409182
15-0.046124-0.36020.359957
16-0.145956-1.140.129381
17-0.109767-0.85730.197315
18-0.11614-0.90710.183966
19-0.02641-0.20630.418634
20-0.051207-0.39990.3453
21-0.006728-0.05250.479134
22-0.057418-0.44850.327708
23-0.009564-0.07470.470351
24-0.020637-0.16120.436242
250.088520.69140.245981
26-0.013609-0.10630.45785
27-0.014598-0.1140.4548
28-0.06353-0.49620.310773
29-0.058245-0.45490.325394
30-0.08663-0.67660.250607
31-0.090772-0.7090.240527
320.0331840.25920.398186
33-0.017818-0.13920.444889
34-0.02002-0.15640.438131
350.0380370.29710.383709
360.0012210.00950.496211

\begin{tabular}{lllllllll}
\hline
Partial Autocorrelation Function \tabularnewline
Time lag k & PACF(k) & T-STAT & P-value \tabularnewline
1 & 0.952308 & 7.4378 & 0 \tabularnewline
2 & -0.25856 & -2.0194 & 0.023922 \tabularnewline
3 & -0.18618 & -1.4541 & 0.075521 \tabularnewline
4 & -0.133265 & -1.0408 & 0.15103 \tabularnewline
5 & -0.086629 & -0.6766 & 0.25061 \tabularnewline
6 & 0.032419 & 0.2532 & 0.400482 \tabularnewline
7 & -0.111051 & -0.8673 & 0.19458 \tabularnewline
8 & -0.112429 & -0.8781 & 0.191668 \tabularnewline
9 & -0.060116 & -0.4695 & 0.320187 \tabularnewline
10 & -0.058867 & -0.4598 & 0.323659 \tabularnewline
11 & 0.08323 & 0.65 & 0.25905 \tabularnewline
12 & 0.066914 & 0.5226 & 0.301568 \tabularnewline
13 & 0.029279 & 0.2287 & 0.409943 \tabularnewline
14 & 0.029531 & 0.2306 & 0.409182 \tabularnewline
15 & -0.046124 & -0.3602 & 0.359957 \tabularnewline
16 & -0.145956 & -1.14 & 0.129381 \tabularnewline
17 & -0.109767 & -0.8573 & 0.197315 \tabularnewline
18 & -0.11614 & -0.9071 & 0.183966 \tabularnewline
19 & -0.02641 & -0.2063 & 0.418634 \tabularnewline
20 & -0.051207 & -0.3999 & 0.3453 \tabularnewline
21 & -0.006728 & -0.0525 & 0.479134 \tabularnewline
22 & -0.057418 & -0.4485 & 0.327708 \tabularnewline
23 & -0.009564 & -0.0747 & 0.470351 \tabularnewline
24 & -0.020637 & -0.1612 & 0.436242 \tabularnewline
25 & 0.08852 & 0.6914 & 0.245981 \tabularnewline
26 & -0.013609 & -0.1063 & 0.45785 \tabularnewline
27 & -0.014598 & -0.114 & 0.4548 \tabularnewline
28 & -0.06353 & -0.4962 & 0.310773 \tabularnewline
29 & -0.058245 & -0.4549 & 0.325394 \tabularnewline
30 & -0.08663 & -0.6766 & 0.250607 \tabularnewline
31 & -0.090772 & -0.709 & 0.240527 \tabularnewline
32 & 0.033184 & 0.2592 & 0.398186 \tabularnewline
33 & -0.017818 & -0.1392 & 0.444889 \tabularnewline
34 & -0.02002 & -0.1564 & 0.438131 \tabularnewline
35 & 0.038037 & 0.2971 & 0.383709 \tabularnewline
36 & 0.001221 & 0.0095 & 0.496211 \tabularnewline
\hline
\end{tabular}
%Source: https://freestatistics.org/blog/index.php?pk=62361&T=2

[TABLE]
[ROW][C]Partial Autocorrelation Function[/C][/ROW]
[ROW][C]Time lag k[/C][C]PACF(k)[/C][C]T-STAT[/C][C]P-value[/C][/ROW]
[ROW][C]1[/C][C]0.952308[/C][C]7.4378[/C][C]0[/C][/ROW]
[ROW][C]2[/C][C]-0.25856[/C][C]-2.0194[/C][C]0.023922[/C][/ROW]
[ROW][C]3[/C][C]-0.18618[/C][C]-1.4541[/C][C]0.075521[/C][/ROW]
[ROW][C]4[/C][C]-0.133265[/C][C]-1.0408[/C][C]0.15103[/C][/ROW]
[ROW][C]5[/C][C]-0.086629[/C][C]-0.6766[/C][C]0.25061[/C][/ROW]
[ROW][C]6[/C][C]0.032419[/C][C]0.2532[/C][C]0.400482[/C][/ROW]
[ROW][C]7[/C][C]-0.111051[/C][C]-0.8673[/C][C]0.19458[/C][/ROW]
[ROW][C]8[/C][C]-0.112429[/C][C]-0.8781[/C][C]0.191668[/C][/ROW]
[ROW][C]9[/C][C]-0.060116[/C][C]-0.4695[/C][C]0.320187[/C][/ROW]
[ROW][C]10[/C][C]-0.058867[/C][C]-0.4598[/C][C]0.323659[/C][/ROW]
[ROW][C]11[/C][C]0.08323[/C][C]0.65[/C][C]0.25905[/C][/ROW]
[ROW][C]12[/C][C]0.066914[/C][C]0.5226[/C][C]0.301568[/C][/ROW]
[ROW][C]13[/C][C]0.029279[/C][C]0.2287[/C][C]0.409943[/C][/ROW]
[ROW][C]14[/C][C]0.029531[/C][C]0.2306[/C][C]0.409182[/C][/ROW]
[ROW][C]15[/C][C]-0.046124[/C][C]-0.3602[/C][C]0.359957[/C][/ROW]
[ROW][C]16[/C][C]-0.145956[/C][C]-1.14[/C][C]0.129381[/C][/ROW]
[ROW][C]17[/C][C]-0.109767[/C][C]-0.8573[/C][C]0.197315[/C][/ROW]
[ROW][C]18[/C][C]-0.11614[/C][C]-0.9071[/C][C]0.183966[/C][/ROW]
[ROW][C]19[/C][C]-0.02641[/C][C]-0.2063[/C][C]0.418634[/C][/ROW]
[ROW][C]20[/C][C]-0.051207[/C][C]-0.3999[/C][C]0.3453[/C][/ROW]
[ROW][C]21[/C][C]-0.006728[/C][C]-0.0525[/C][C]0.479134[/C][/ROW]
[ROW][C]22[/C][C]-0.057418[/C][C]-0.4485[/C][C]0.327708[/C][/ROW]
[ROW][C]23[/C][C]-0.009564[/C][C]-0.0747[/C][C]0.470351[/C][/ROW]
[ROW][C]24[/C][C]-0.020637[/C][C]-0.1612[/C][C]0.436242[/C][/ROW]
[ROW][C]25[/C][C]0.08852[/C][C]0.6914[/C][C]0.245981[/C][/ROW]
[ROW][C]26[/C][C]-0.013609[/C][C]-0.1063[/C][C]0.45785[/C][/ROW]
[ROW][C]27[/C][C]-0.014598[/C][C]-0.114[/C][C]0.4548[/C][/ROW]
[ROW][C]28[/C][C]-0.06353[/C][C]-0.4962[/C][C]0.310773[/C][/ROW]
[ROW][C]29[/C][C]-0.058245[/C][C]-0.4549[/C][C]0.325394[/C][/ROW]
[ROW][C]30[/C][C]-0.08663[/C][C]-0.6766[/C][C]0.250607[/C][/ROW]
[ROW][C]31[/C][C]-0.090772[/C][C]-0.709[/C][C]0.240527[/C][/ROW]
[ROW][C]32[/C][C]0.033184[/C][C]0.2592[/C][C]0.398186[/C][/ROW]
[ROW][C]33[/C][C]-0.017818[/C][C]-0.1392[/C][C]0.444889[/C][/ROW]
[ROW][C]34[/C][C]-0.02002[/C][C]-0.1564[/C][C]0.438131[/C][/ROW]
[ROW][C]35[/C][C]0.038037[/C][C]0.2971[/C][C]0.383709[/C][/ROW]
[ROW][C]36[/C][C]0.001221[/C][C]0.0095[/C][C]0.496211[/C][/ROW]
[/TABLE]
Source: https://freestatistics.org/blog/index.php?pk=62361&T=2

Globally Unique Identifier (entire table): ba.freestatistics.org/blog/index.php?pk=62361&T=2

As an alternative you can also use a QR Code:  

The GUIDs for individual cells are displayed in the table below:

Partial Autocorrelation Function
Time lag kPACF(k)T-STATP-value
10.9523087.43780
2-0.25856-2.01940.023922
3-0.18618-1.45410.075521
4-0.133265-1.04080.15103
5-0.086629-0.67660.25061
60.0324190.25320.400482
7-0.111051-0.86730.19458
8-0.112429-0.87810.191668
9-0.060116-0.46950.320187
10-0.058867-0.45980.323659
110.083230.650.25905
120.0669140.52260.301568
130.0292790.22870.409943
140.0295310.23060.409182
15-0.046124-0.36020.359957
16-0.145956-1.140.129381
17-0.109767-0.85730.197315
18-0.11614-0.90710.183966
19-0.02641-0.20630.418634
20-0.051207-0.39990.3453
21-0.006728-0.05250.479134
22-0.057418-0.44850.327708
23-0.009564-0.07470.470351
24-0.020637-0.16120.436242
250.088520.69140.245981
26-0.013609-0.10630.45785
27-0.014598-0.1140.4548
28-0.06353-0.49620.310773
29-0.058245-0.45490.325394
30-0.08663-0.67660.250607
31-0.090772-0.7090.240527
320.0331840.25920.398186
33-0.017818-0.13920.444889
34-0.02002-0.15640.438131
350.0380370.29710.383709
360.0012210.00950.496211


Parameters (Session):
par1 = 36 ; par2 = 1 ; par3 = 0 ; par4 = 0 ; par5 = 12 ; par6 = MA ; par7 = 0.95 ;
Parameters (R input):
par1 = 36 ; par2 = 1 ; par3 = 0 ; par4 = 0 ; par5 = 12 ; par6 = MA ; par7 = 0.95 ;
R code (references can be found in the software module):
if (par1 == 'Default') {
par1 = 10*log10(length(x))
} else {
par1 <- as.numeric(par1)
}
par2 <- as.numeric(par2)
par3 <- as.numeric(par3)
par4 <- as.numeric(par4)
par5 <- as.numeric(par5)
if (par6 == 'White Noise') par6 <- 'white' else par6 <- 'ma'
par7 <- as.numeric(par7)
if (par2 == 0) {
x <- log(x)
} else {
x <- (x ^ par2 - 1) / par2
}
if (par3 > 0) x <- diff(x,lag=1,difference=par3)
if (par4 > 0) x <- diff(x,lag=par5,difference=par4)
bitmap(file='pic1.png')
racf <- acf(x, par1, main='Autocorrelation', xlab='time lag', ylab='ACF', ci.type=par6, ci=par7, sub=paste('(lambda=',par2,', d=',par3,', D=',par4,', CI=', par7, ', CI type=',par6,')',sep=''))
dev.off()
bitmap(file='pic2.png')
rpacf <- pacf(x,par1,main='Partial Autocorrelation',xlab='lags',ylab='PACF')
dev.off()
(myacf <- c(racf$acf))
(mypacf <- c(rpacf$acf))
lengthx <- length(x)
sqrtn <- sqrt(lengthx)
load(file='createtable')
a<-table.start()
a<-table.row.start(a)
a<-table.element(a,'Autocorrelation Function',4,TRUE)
a<-table.row.end(a)
a<-table.row.start(a)
a<-table.element(a,'Time lag k',header=TRUE)
a<-table.element(a,hyperlink('basics.htm','ACF(k)','click here for more information about the Autocorrelation Function'),header=TRUE)
a<-table.element(a,'T-STAT',header=TRUE)
a<-table.element(a,'P-value',header=TRUE)
a<-table.row.end(a)
for (i in 2:(par1+1)) {
a<-table.row.start(a)
a<-table.element(a,i-1,header=TRUE)
a<-table.element(a,round(myacf[i],6))
mytstat <- myacf[i]*sqrtn
a<-table.element(a,round(mytstat,4))
a<-table.element(a,round(1-pt(abs(mytstat),lengthx),6))
a<-table.row.end(a)
}
a<-table.end(a)
table.save(a,file='mytable.tab')
a<-table.start()
a<-table.row.start(a)
a<-table.element(a,'Partial Autocorrelation Function',4,TRUE)
a<-table.row.end(a)
a<-table.row.start(a)
a<-table.element(a,'Time lag k',header=TRUE)
a<-table.element(a,hyperlink('basics.htm','PACF(k)','click here for more information about the Partial Autocorrelation Function'),header=TRUE)
a<-table.element(a,'T-STAT',header=TRUE)
a<-table.element(a,'P-value',header=TRUE)
a<-table.row.end(a)
for (i in 1:par1) {
a<-table.row.start(a)
a<-table.element(a,i,header=TRUE)
a<-table.element(a,round(mypacf[i],6))
mytstat <- mypacf[i]*sqrtn
a<-table.element(a,round(mytstat,4))
a<-table.element(a,round(1-pt(abs(mytstat),lengthx),6))
a<-table.row.end(a)
}
a<-table.end(a)
table.save(a,file='mytable1.tab')