Free Statistics

of Irreproducible Research!

Author's title

Author*The author of this computation has been verified*
R Software Modulerwasp_autocorrelation.wasp
Title produced by software(Partial) Autocorrelation Function
Date of computationWed, 02 Dec 2009 08:15:03 -0700
Cite this page as followsStatistical Computations at FreeStatistics.org, Office for Research Development and Education, URL https://freestatistics.org/blog/index.php?v=date/2009/Dec/02/t1259767077dax5iaenzqny09a.htm/, Retrieved Sun, 28 Apr 2024 06:37:33 +0000
Statistical Computations at FreeStatistics.org, Office for Research Development and Education, URL https://freestatistics.org/blog/index.php?pk=62368, Retrieved Sun, 28 Apr 2024 06:37:33 +0000
QR Codes:

Original text written by user:
IsPrivate?No (this computation is public)
User-defined keywords
Estimated Impact115
Family? (F = Feedback message, R = changed R code, M = changed R Module, P = changed Parameters, D = changed Data)
-       [(Partial) Autocorrelation Function] [verduidelijking t...] [2009-12-02 15:15:03] [99bf2a1e962091d45abf4c2600a412f9] [Current]
Feedback Forum

Post a new message
Dataseries X:
15912,8
13866,5
17823,2
17872
17420,4
16704,4
15991,2
16583,6
19123,5
17838,7
17209,4
18586,5
16258,1
15141,6
19202,1
17746,5
19090,1
18040,3
17515,5
17751,8
21072,4
17170
19439,5
19795,4
17574,9
16165,4
19464,6
19932,1
19961,2
17343,4
18924,2
18574,1
21350,6
18594,6
19823,1
20844,4
19640,2
17735,4
19813,6
22160
20664,3
17877,4
20906,5
21164,1
21374,4
22952,3
21343,5
23899,3
22392,9
18274,1
22786,7
22321,5
17842,2
16373,5
15993,8
16446,1
17729
16643
16196,7
18252,1
17304


Summary of computational transaction
Raw Inputview raw input (R code)
Raw Outputview raw output of R engine
Computing time2 seconds
R Server'Gwilym Jenkins' @ 72.249.127.135
R Framework error message
Warning: there are blank lines in the 'Data' field.
Please, use NA for missing data - blank lines are simply
 deleted and are NOT treated as missing values.

\begin{tabular}{lllllllll}
\hline
Summary of computational transaction \tabularnewline
Raw Input & view raw input (R code)  \tabularnewline
Raw Output & view raw output of R engine  \tabularnewline
Computing time & 2 seconds \tabularnewline
R Server & 'Gwilym Jenkins' @ 72.249.127.135 \tabularnewline
R Framework error message & 
Warning: there are blank lines in the 'Data' field.
Please, use NA for missing data - blank lines are simply
 deleted and are NOT treated as missing values.
\tabularnewline \hline \end{tabular} %Source: https://freestatistics.org/blog/index.php?pk=62368&T=0

[TABLE]
[ROW][C]Summary of computational transaction[/C][/ROW]
[ROW][C]Raw Input[/C][C]view raw input (R code) [/C][/ROW]
[ROW][C]Raw Output[/C][C]view raw output of R engine [/C][/ROW]
[ROW][C]Computing time[/C][C]2 seconds[/C][/ROW]
[ROW][C]R Server[/C][C]'Gwilym Jenkins' @ 72.249.127.135[/C][/ROW]
[ROW][C]R Framework error message[/C][C]
Warning: there are blank lines in the 'Data' field.
Please, use NA for missing data - blank lines are simply
 deleted and are NOT treated as missing values.
[/C][/ROW] [/TABLE] Source: https://freestatistics.org/blog/index.php?pk=62368&T=0

Globally Unique Identifier (entire table): ba.freestatistics.org/blog/index.php?pk=62368&T=0

As an alternative you can also use a QR Code:  

The GUIDs for individual cells are displayed in the table below:

Summary of computational transaction
Raw Inputview raw input (R code)
Raw Outputview raw output of R engine
Computing time2 seconds
R Server'Gwilym Jenkins' @ 72.249.127.135
R Framework error message
Warning: there are blank lines in the 'Data' field.
Please, use NA for missing data - blank lines are simply
 deleted and are NOT treated as missing values.


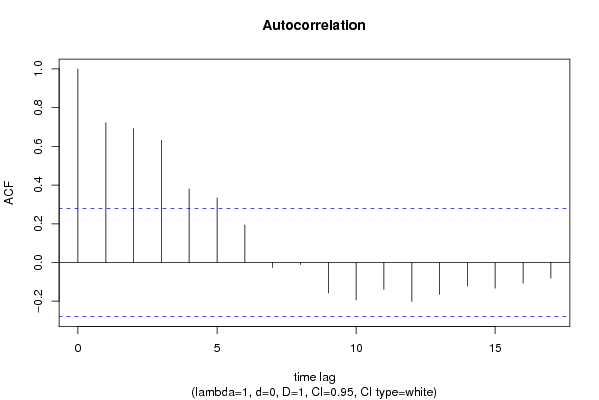
Autocorrelation Function
Time lag kACF(k)T-STATP-value
10.7220655.05453e-06
20.6912524.83887e-06
30.6313544.41952.7e-05
40.3792812.6550.005334
50.3331812.33230.01192
60.1941071.35880.090224
7-0.025428-0.1780.429731
8-0.010975-0.07680.469539
9-0.158307-1.10810.136604
10-0.193681-1.35580.090694
11-0.13885-0.97190.167925
12-0.201244-1.40870.082618
13-0.164307-1.15010.127833
14-0.121343-0.84940.199895
15-0.132772-0.92940.178618
16-0.107369-0.75160.227948
17-0.081492-0.57040.285491

\begin{tabular}{lllllllll}
\hline
Autocorrelation Function \tabularnewline
Time lag k & ACF(k) & T-STAT & P-value \tabularnewline
1 & 0.722065 & 5.0545 & 3e-06 \tabularnewline
2 & 0.691252 & 4.8388 & 7e-06 \tabularnewline
3 & 0.631354 & 4.4195 & 2.7e-05 \tabularnewline
4 & 0.379281 & 2.655 & 0.005334 \tabularnewline
5 & 0.333181 & 2.3323 & 0.01192 \tabularnewline
6 & 0.194107 & 1.3588 & 0.090224 \tabularnewline
7 & -0.025428 & -0.178 & 0.429731 \tabularnewline
8 & -0.010975 & -0.0768 & 0.469539 \tabularnewline
9 & -0.158307 & -1.1081 & 0.136604 \tabularnewline
10 & -0.193681 & -1.3558 & 0.090694 \tabularnewline
11 & -0.13885 & -0.9719 & 0.167925 \tabularnewline
12 & -0.201244 & -1.4087 & 0.082618 \tabularnewline
13 & -0.164307 & -1.1501 & 0.127833 \tabularnewline
14 & -0.121343 & -0.8494 & 0.199895 \tabularnewline
15 & -0.132772 & -0.9294 & 0.178618 \tabularnewline
16 & -0.107369 & -0.7516 & 0.227948 \tabularnewline
17 & -0.081492 & -0.5704 & 0.285491 \tabularnewline
\hline
\end{tabular}
%Source: https://freestatistics.org/blog/index.php?pk=62368&T=1

[TABLE]
[ROW][C]Autocorrelation Function[/C][/ROW]
[ROW][C]Time lag k[/C][C]ACF(k)[/C][C]T-STAT[/C][C]P-value[/C][/ROW]
[ROW][C]1[/C][C]0.722065[/C][C]5.0545[/C][C]3e-06[/C][/ROW]
[ROW][C]2[/C][C]0.691252[/C][C]4.8388[/C][C]7e-06[/C][/ROW]
[ROW][C]3[/C][C]0.631354[/C][C]4.4195[/C][C]2.7e-05[/C][/ROW]
[ROW][C]4[/C][C]0.379281[/C][C]2.655[/C][C]0.005334[/C][/ROW]
[ROW][C]5[/C][C]0.333181[/C][C]2.3323[/C][C]0.01192[/C][/ROW]
[ROW][C]6[/C][C]0.194107[/C][C]1.3588[/C][C]0.090224[/C][/ROW]
[ROW][C]7[/C][C]-0.025428[/C][C]-0.178[/C][C]0.429731[/C][/ROW]
[ROW][C]8[/C][C]-0.010975[/C][C]-0.0768[/C][C]0.469539[/C][/ROW]
[ROW][C]9[/C][C]-0.158307[/C][C]-1.1081[/C][C]0.136604[/C][/ROW]
[ROW][C]10[/C][C]-0.193681[/C][C]-1.3558[/C][C]0.090694[/C][/ROW]
[ROW][C]11[/C][C]-0.13885[/C][C]-0.9719[/C][C]0.167925[/C][/ROW]
[ROW][C]12[/C][C]-0.201244[/C][C]-1.4087[/C][C]0.082618[/C][/ROW]
[ROW][C]13[/C][C]-0.164307[/C][C]-1.1501[/C][C]0.127833[/C][/ROW]
[ROW][C]14[/C][C]-0.121343[/C][C]-0.8494[/C][C]0.199895[/C][/ROW]
[ROW][C]15[/C][C]-0.132772[/C][C]-0.9294[/C][C]0.178618[/C][/ROW]
[ROW][C]16[/C][C]-0.107369[/C][C]-0.7516[/C][C]0.227948[/C][/ROW]
[ROW][C]17[/C][C]-0.081492[/C][C]-0.5704[/C][C]0.285491[/C][/ROW]
[/TABLE]
Source: https://freestatistics.org/blog/index.php?pk=62368&T=1

Globally Unique Identifier (entire table): ba.freestatistics.org/blog/index.php?pk=62368&T=1

As an alternative you can also use a QR Code:  

The GUIDs for individual cells are displayed in the table below:

Autocorrelation Function
Time lag kACF(k)T-STATP-value
10.7220655.05453e-06
20.6912524.83887e-06
30.6313544.41952.7e-05
40.3792812.6550.005334
50.3331812.33230.01192
60.1941071.35880.090224
7-0.025428-0.1780.429731
8-0.010975-0.07680.469539
9-0.158307-1.10810.136604
10-0.193681-1.35580.090694
11-0.13885-0.97190.167925
12-0.201244-1.40870.082618
13-0.164307-1.15010.127833
14-0.121343-0.84940.199895
15-0.132772-0.92940.178618
16-0.107369-0.75160.227948
17-0.081492-0.57040.285491


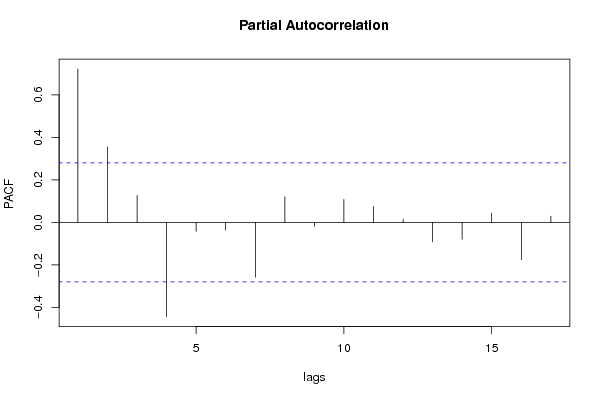
Partial Autocorrelation Function
Time lag kPACF(k)T-STATP-value
10.7220655.05453e-06
20.3549232.48450.00822
30.1269350.88850.189295
4-0.44335-3.10350.001587
5-0.041879-0.29320.385322
6-0.035891-0.25120.40134
7-0.257976-1.80580.038545
80.1213240.84930.199931
9-0.01955-0.13680.445856
100.1079420.75560.226755
110.075140.5260.300637
120.0134930.09450.462567
13-0.091404-0.63980.262632
14-0.079057-0.55340.291253
150.0442220.30960.379107
16-0.175272-1.22690.112861
170.0293610.20550.419006

\begin{tabular}{lllllllll}
\hline
Partial Autocorrelation Function \tabularnewline
Time lag k & PACF(k) & T-STAT & P-value \tabularnewline
1 & 0.722065 & 5.0545 & 3e-06 \tabularnewline
2 & 0.354923 & 2.4845 & 0.00822 \tabularnewline
3 & 0.126935 & 0.8885 & 0.189295 \tabularnewline
4 & -0.44335 & -3.1035 & 0.001587 \tabularnewline
5 & -0.041879 & -0.2932 & 0.385322 \tabularnewline
6 & -0.035891 & -0.2512 & 0.40134 \tabularnewline
7 & -0.257976 & -1.8058 & 0.038545 \tabularnewline
8 & 0.121324 & 0.8493 & 0.199931 \tabularnewline
9 & -0.01955 & -0.1368 & 0.445856 \tabularnewline
10 & 0.107942 & 0.7556 & 0.226755 \tabularnewline
11 & 0.07514 & 0.526 & 0.300637 \tabularnewline
12 & 0.013493 & 0.0945 & 0.462567 \tabularnewline
13 & -0.091404 & -0.6398 & 0.262632 \tabularnewline
14 & -0.079057 & -0.5534 & 0.291253 \tabularnewline
15 & 0.044222 & 0.3096 & 0.379107 \tabularnewline
16 & -0.175272 & -1.2269 & 0.112861 \tabularnewline
17 & 0.029361 & 0.2055 & 0.419006 \tabularnewline
\hline
\end{tabular}
%Source: https://freestatistics.org/blog/index.php?pk=62368&T=2

[TABLE]
[ROW][C]Partial Autocorrelation Function[/C][/ROW]
[ROW][C]Time lag k[/C][C]PACF(k)[/C][C]T-STAT[/C][C]P-value[/C][/ROW]
[ROW][C]1[/C][C]0.722065[/C][C]5.0545[/C][C]3e-06[/C][/ROW]
[ROW][C]2[/C][C]0.354923[/C][C]2.4845[/C][C]0.00822[/C][/ROW]
[ROW][C]3[/C][C]0.126935[/C][C]0.8885[/C][C]0.189295[/C][/ROW]
[ROW][C]4[/C][C]-0.44335[/C][C]-3.1035[/C][C]0.001587[/C][/ROW]
[ROW][C]5[/C][C]-0.041879[/C][C]-0.2932[/C][C]0.385322[/C][/ROW]
[ROW][C]6[/C][C]-0.035891[/C][C]-0.2512[/C][C]0.40134[/C][/ROW]
[ROW][C]7[/C][C]-0.257976[/C][C]-1.8058[/C][C]0.038545[/C][/ROW]
[ROW][C]8[/C][C]0.121324[/C][C]0.8493[/C][C]0.199931[/C][/ROW]
[ROW][C]9[/C][C]-0.01955[/C][C]-0.1368[/C][C]0.445856[/C][/ROW]
[ROW][C]10[/C][C]0.107942[/C][C]0.7556[/C][C]0.226755[/C][/ROW]
[ROW][C]11[/C][C]0.07514[/C][C]0.526[/C][C]0.300637[/C][/ROW]
[ROW][C]12[/C][C]0.013493[/C][C]0.0945[/C][C]0.462567[/C][/ROW]
[ROW][C]13[/C][C]-0.091404[/C][C]-0.6398[/C][C]0.262632[/C][/ROW]
[ROW][C]14[/C][C]-0.079057[/C][C]-0.5534[/C][C]0.291253[/C][/ROW]
[ROW][C]15[/C][C]0.044222[/C][C]0.3096[/C][C]0.379107[/C][/ROW]
[ROW][C]16[/C][C]-0.175272[/C][C]-1.2269[/C][C]0.112861[/C][/ROW]
[ROW][C]17[/C][C]0.029361[/C][C]0.2055[/C][C]0.419006[/C][/ROW]
[/TABLE]
Source: https://freestatistics.org/blog/index.php?pk=62368&T=2

Globally Unique Identifier (entire table): ba.freestatistics.org/blog/index.php?pk=62368&T=2

As an alternative you can also use a QR Code:  

The GUIDs for individual cells are displayed in the table below:

Partial Autocorrelation Function
Time lag kPACF(k)T-STATP-value
10.7220655.05453e-06
20.3549232.48450.00822
30.1269350.88850.189295
4-0.44335-3.10350.001587
5-0.041879-0.29320.385322
6-0.035891-0.25120.40134
7-0.257976-1.80580.038545
80.1213240.84930.199931
9-0.01955-0.13680.445856
100.1079420.75560.226755
110.075140.5260.300637
120.0134930.09450.462567
13-0.091404-0.63980.262632
14-0.079057-0.55340.291253
150.0442220.30960.379107
16-0.175272-1.22690.112861
170.0293610.20550.419006


Parameters (Session):
par1 = Default ; par2 = 1 ; par3 = 0 ; par4 = 1 ; par5 = 12 ; par6 = White Noise ; par7 = 0.95 ;
Parameters (R input):
par1 = Default ; par2 = 1 ; par3 = 0 ; par4 = 1 ; par5 = 12 ; par6 = White Noise ; par7 = 0.95 ;
R code (references can be found in the software module):
if (par1 == 'Default') {
par1 = 10*log10(length(x))
} else {
par1 <- as.numeric(par1)
}
par2 <- as.numeric(par2)
par3 <- as.numeric(par3)
par4 <- as.numeric(par4)
par5 <- as.numeric(par5)
if (par6 == 'White Noise') par6 <- 'white' else par6 <- 'ma'
par7 <- as.numeric(par7)
if (par2 == 0) {
x <- log(x)
} else {
x <- (x ^ par2 - 1) / par2
}
if (par3 > 0) x <- diff(x,lag=1,difference=par3)
if (par4 > 0) x <- diff(x,lag=par5,difference=par4)
bitmap(file='pic1.png')
racf <- acf(x, par1, main='Autocorrelation', xlab='time lag', ylab='ACF', ci.type=par6, ci=par7, sub=paste('(lambda=',par2,', d=',par3,', D=',par4,', CI=', par7, ', CI type=',par6,')',sep=''))
dev.off()
bitmap(file='pic2.png')
rpacf <- pacf(x,par1,main='Partial Autocorrelation',xlab='lags',ylab='PACF')
dev.off()
(myacf <- c(racf$acf))
(mypacf <- c(rpacf$acf))
lengthx <- length(x)
sqrtn <- sqrt(lengthx)
load(file='createtable')
a<-table.start()
a<-table.row.start(a)
a<-table.element(a,'Autocorrelation Function',4,TRUE)
a<-table.row.end(a)
a<-table.row.start(a)
a<-table.element(a,'Time lag k',header=TRUE)
a<-table.element(a,hyperlink('basics.htm','ACF(k)','click here for more information about the Autocorrelation Function'),header=TRUE)
a<-table.element(a,'T-STAT',header=TRUE)
a<-table.element(a,'P-value',header=TRUE)
a<-table.row.end(a)
for (i in 2:(par1+1)) {
a<-table.row.start(a)
a<-table.element(a,i-1,header=TRUE)
a<-table.element(a,round(myacf[i],6))
mytstat <- myacf[i]*sqrtn
a<-table.element(a,round(mytstat,4))
a<-table.element(a,round(1-pt(abs(mytstat),lengthx),6))
a<-table.row.end(a)
}
a<-table.end(a)
table.save(a,file='mytable.tab')
a<-table.start()
a<-table.row.start(a)
a<-table.element(a,'Partial Autocorrelation Function',4,TRUE)
a<-table.row.end(a)
a<-table.row.start(a)
a<-table.element(a,'Time lag k',header=TRUE)
a<-table.element(a,hyperlink('basics.htm','PACF(k)','click here for more information about the Partial Autocorrelation Function'),header=TRUE)
a<-table.element(a,'T-STAT',header=TRUE)
a<-table.element(a,'P-value',header=TRUE)
a<-table.row.end(a)
for (i in 1:par1) {
a<-table.row.start(a)
a<-table.element(a,i,header=TRUE)
a<-table.element(a,round(mypacf[i],6))
mytstat <- mypacf[i]*sqrtn
a<-table.element(a,round(mytstat,4))
a<-table.element(a,round(1-pt(abs(mytstat),lengthx),6))
a<-table.row.end(a)
}
a<-table.end(a)
table.save(a,file='mytable1.tab')