Free Statistics

of Irreproducible Research!

Author's title

Author*The author of this computation has been verified*
R Software Modulerwasp_arimabackwardselection.wasp
Title produced by softwareARIMA Backward Selection
Date of computationWed, 02 Dec 2009 08:22:59 -0700
Cite this page as followsStatistical Computations at FreeStatistics.org, Office for Research Development and Education, URL https://freestatistics.org/blog/index.php?v=date/2009/Dec/02/t1259767584i16e2p44l7aqrc4.htm/, Retrieved Sat, 27 Apr 2024 23:47:16 +0000
Statistical Computations at FreeStatistics.org, Office for Research Development and Education, URL https://freestatistics.org/blog/index.php?pk=62370, Retrieved Sat, 27 Apr 2024 23:47:16 +0000
QR Codes:

Original text written by user:
IsPrivate?No (this computation is public)
User-defined keywordsshwws9v1
Estimated Impact160
Family? (F = Feedback message, R = changed R code, M = changed R Module, P = changed Parameters, D = changed Data)
-     [Multiple Regression] [Q1 The Seatbeltlaw] [2007-11-14 19:27:43] [8cd6641b921d30ebe00b648d1481bba0]
- RMPD  [Multiple Regression] [Seatbelt] [2009-11-12 13:54:52] [b98453cac15ba1066b407e146608df68]
-    D    [Multiple Regression] [] [2009-11-20 13:47:03] [5482608004c1d7bbf873930172393a2d]
- RMPD      [Variance Reduction Matrix] [] [2009-11-27 13:45:38] [5482608004c1d7bbf873930172393a2d]
- RMP         [Standard Deviation-Mean Plot] [] [2009-11-27 14:01:45] [5482608004c1d7bbf873930172393a2d]
- RMPD            [ARIMA Backward Selection] [] [2009-12-02 15:22:59] [efdfe680cd785c4af09f858b30f777ec] [Current]
Feedback Forum

Post a new message
Dataseries X:
6539
6699
6962
6981
7024
6940
6774
6671
6965
6969
6822
6878
6691
6837
7018
7167
7076
7171
7093
6971
7142
7047
6999
6650
6475
6437
6639
6422
6272
6232
6003
5673
6050
5977
5796
5752
5609
5839
6069
6006
5809
5797
5502
5568
5864
5764
5615
5615
5681
5915
6334
6494
6620
6578
6495
6538
6737
6651
6530
6563


Summary of computational transaction
Raw Inputview raw input (R code)
Raw Outputview raw output of R engine
Computing time7 seconds
R Server'Gwilym Jenkins' @ 72.249.127.135

\begin{tabular}{lllllllll}
\hline
Summary of computational transaction \tabularnewline
Raw Input & view raw input (R code)  \tabularnewline
Raw Output & view raw output of R engine  \tabularnewline
Computing time & 7 seconds \tabularnewline
R Server & 'Gwilym Jenkins' @ 72.249.127.135 \tabularnewline
\hline
\end{tabular}
%Source: https://freestatistics.org/blog/index.php?pk=62370&T=0

[TABLE]
[ROW][C]Summary of computational transaction[/C][/ROW]
[ROW][C]Raw Input[/C][C]view raw input (R code) [/C][/ROW]
[ROW][C]Raw Output[/C][C]view raw output of R engine [/C][/ROW]
[ROW][C]Computing time[/C][C]7 seconds[/C][/ROW]
[ROW][C]R Server[/C][C]'Gwilym Jenkins' @ 72.249.127.135[/C][/ROW]
[/TABLE]
Source: https://freestatistics.org/blog/index.php?pk=62370&T=0

Globally Unique Identifier (entire table): ba.freestatistics.org/blog/index.php?pk=62370&T=0

As an alternative you can also use a QR Code:  

The GUIDs for individual cells are displayed in the table below:

Summary of computational transaction
Raw Inputview raw input (R code)
Raw Outputview raw output of R engine
Computing time7 seconds
R Server'Gwilym Jenkins' @ 72.249.127.135


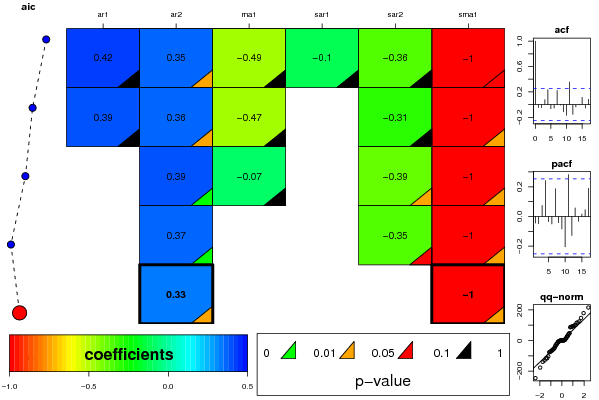
ARIMA Parameter Estimation and Backward Selection
Iterationar1ar2ma1sar1sar2sma1
Estimates ( 1 )0.41870.3511-0.4873-0.1046-0.3583-0.9998
(p-val)(0.196 )(0.0443 )(0.1007 )(0.5973 )(0.1179 )(0.0953 )
Estimates ( 2 )0.3940.3637-0.46590-0.308-0.9999
(p-val)(0.1988 )(0.0301 )(0.1008 )(NA )(0.1671 )(0.0211 )
Estimates ( 3 )00.3881-0.07070-0.3855-1
(p-val)(NA )(0.0086 )(0.6919 )(NA )(0.048 )(0.0283 )
Estimates ( 4 )00.374400-0.3508-0.9994
(p-val)(NA )(0.0087 )(NA )(NA )(0.0533 )(0.0209 )
Estimates ( 5 )00.3266000-0.9999
(p-val)(NA )(0.0195 )(NA )(NA )(NA )(0.0115 )
Estimates ( 6 )NANANANANANA
(p-val)(NA )(NA )(NA )(NA )(NA )(NA )
Estimates ( 7 )NANANANANANA
(p-val)(NA )(NA )(NA )(NA )(NA )(NA )
Estimates ( 8 )NANANANANANA
(p-val)(NA )(NA )(NA )(NA )(NA )(NA )
Estimates ( 9 )NANANANANANA
(p-val)(NA )(NA )(NA )(NA )(NA )(NA )
Estimates ( 10 )NANANANANANA
(p-val)(NA )(NA )(NA )(NA )(NA )(NA )
Estimates ( 11 )NANANANANANA
(p-val)(NA )(NA )(NA )(NA )(NA )(NA )

\begin{tabular}{lllllllll}
\hline
ARIMA Parameter Estimation and Backward Selection \tabularnewline
Iteration & ar1 & ar2 & ma1 & sar1 & sar2 & sma1 \tabularnewline
Estimates ( 1 ) & 0.4187 & 0.3511 & -0.4873 & -0.1046 & -0.3583 & -0.9998 \tabularnewline
(p-val) & (0.196 ) & (0.0443 ) & (0.1007 ) & (0.5973 ) & (0.1179 ) & (0.0953 ) \tabularnewline
Estimates ( 2 ) & 0.394 & 0.3637 & -0.4659 & 0 & -0.308 & -0.9999 \tabularnewline
(p-val) & (0.1988 ) & (0.0301 ) & (0.1008 ) & (NA ) & (0.1671 ) & (0.0211 ) \tabularnewline
Estimates ( 3 ) & 0 & 0.3881 & -0.0707 & 0 & -0.3855 & -1 \tabularnewline
(p-val) & (NA ) & (0.0086 ) & (0.6919 ) & (NA ) & (0.048 ) & (0.0283 ) \tabularnewline
Estimates ( 4 ) & 0 & 0.3744 & 0 & 0 & -0.3508 & -0.9994 \tabularnewline
(p-val) & (NA ) & (0.0087 ) & (NA ) & (NA ) & (0.0533 ) & (0.0209 ) \tabularnewline
Estimates ( 5 ) & 0 & 0.3266 & 0 & 0 & 0 & -0.9999 \tabularnewline
(p-val) & (NA ) & (0.0195 ) & (NA ) & (NA ) & (NA ) & (0.0115 ) \tabularnewline
Estimates ( 6 ) & NA & NA & NA & NA & NA & NA \tabularnewline
(p-val) & (NA ) & (NA ) & (NA ) & (NA ) & (NA ) & (NA ) \tabularnewline
Estimates ( 7 ) & NA & NA & NA & NA & NA & NA \tabularnewline
(p-val) & (NA ) & (NA ) & (NA ) & (NA ) & (NA ) & (NA ) \tabularnewline
Estimates ( 8 ) & NA & NA & NA & NA & NA & NA \tabularnewline
(p-val) & (NA ) & (NA ) & (NA ) & (NA ) & (NA ) & (NA ) \tabularnewline
Estimates ( 9 ) & NA & NA & NA & NA & NA & NA \tabularnewline
(p-val) & (NA ) & (NA ) & (NA ) & (NA ) & (NA ) & (NA ) \tabularnewline
Estimates ( 10 ) & NA & NA & NA & NA & NA & NA \tabularnewline
(p-val) & (NA ) & (NA ) & (NA ) & (NA ) & (NA ) & (NA ) \tabularnewline
Estimates ( 11 ) & NA & NA & NA & NA & NA & NA \tabularnewline
(p-val) & (NA ) & (NA ) & (NA ) & (NA ) & (NA ) & (NA ) \tabularnewline
\hline
\end{tabular}
%Source: https://freestatistics.org/blog/index.php?pk=62370&T=1

[TABLE]
[ROW][C]ARIMA Parameter Estimation and Backward Selection[/C][/ROW]
[ROW][C]Iteration[/C][C]ar1[/C][C]ar2[/C][C]ma1[/C][C]sar1[/C][C]sar2[/C][C]sma1[/C][/ROW]
[ROW][C]Estimates ( 1 )[/C][C]0.4187[/C][C]0.3511[/C][C]-0.4873[/C][C]-0.1046[/C][C]-0.3583[/C][C]-0.9998[/C][/ROW]
[ROW][C](p-val)[/C][C](0.196 )[/C][C](0.0443 )[/C][C](0.1007 )[/C][C](0.5973 )[/C][C](0.1179 )[/C][C](0.0953 )[/C][/ROW]
[ROW][C]Estimates ( 2 )[/C][C]0.394[/C][C]0.3637[/C][C]-0.4659[/C][C]0[/C][C]-0.308[/C][C]-0.9999[/C][/ROW]
[ROW][C](p-val)[/C][C](0.1988 )[/C][C](0.0301 )[/C][C](0.1008 )[/C][C](NA )[/C][C](0.1671 )[/C][C](0.0211 )[/C][/ROW]
[ROW][C]Estimates ( 3 )[/C][C]0[/C][C]0.3881[/C][C]-0.0707[/C][C]0[/C][C]-0.3855[/C][C]-1[/C][/ROW]
[ROW][C](p-val)[/C][C](NA )[/C][C](0.0086 )[/C][C](0.6919 )[/C][C](NA )[/C][C](0.048 )[/C][C](0.0283 )[/C][/ROW]
[ROW][C]Estimates ( 4 )[/C][C]0[/C][C]0.3744[/C][C]0[/C][C]0[/C][C]-0.3508[/C][C]-0.9994[/C][/ROW]
[ROW][C](p-val)[/C][C](NA )[/C][C](0.0087 )[/C][C](NA )[/C][C](NA )[/C][C](0.0533 )[/C][C](0.0209 )[/C][/ROW]
[ROW][C]Estimates ( 5 )[/C][C]0[/C][C]0.3266[/C][C]0[/C][C]0[/C][C]0[/C][C]-0.9999[/C][/ROW]
[ROW][C](p-val)[/C][C](NA )[/C][C](0.0195 )[/C][C](NA )[/C][C](NA )[/C][C](NA )[/C][C](0.0115 )[/C][/ROW]
[ROW][C]Estimates ( 6 )[/C][C]NA[/C][C]NA[/C][C]NA[/C][C]NA[/C][C]NA[/C][C]NA[/C][/ROW]
[ROW][C](p-val)[/C][C](NA )[/C][C](NA )[/C][C](NA )[/C][C](NA )[/C][C](NA )[/C][C](NA )[/C][/ROW]
[ROW][C]Estimates ( 7 )[/C][C]NA[/C][C]NA[/C][C]NA[/C][C]NA[/C][C]NA[/C][C]NA[/C][/ROW]
[ROW][C](p-val)[/C][C](NA )[/C][C](NA )[/C][C](NA )[/C][C](NA )[/C][C](NA )[/C][C](NA )[/C][/ROW]
[ROW][C]Estimates ( 8 )[/C][C]NA[/C][C]NA[/C][C]NA[/C][C]NA[/C][C]NA[/C][C]NA[/C][/ROW]
[ROW][C](p-val)[/C][C](NA )[/C][C](NA )[/C][C](NA )[/C][C](NA )[/C][C](NA )[/C][C](NA )[/C][/ROW]
[ROW][C]Estimates ( 9 )[/C][C]NA[/C][C]NA[/C][C]NA[/C][C]NA[/C][C]NA[/C][C]NA[/C][/ROW]
[ROW][C](p-val)[/C][C](NA )[/C][C](NA )[/C][C](NA )[/C][C](NA )[/C][C](NA )[/C][C](NA )[/C][/ROW]
[ROW][C]Estimates ( 10 )[/C][C]NA[/C][C]NA[/C][C]NA[/C][C]NA[/C][C]NA[/C][C]NA[/C][/ROW]
[ROW][C](p-val)[/C][C](NA )[/C][C](NA )[/C][C](NA )[/C][C](NA )[/C][C](NA )[/C][C](NA )[/C][/ROW]
[ROW][C]Estimates ( 11 )[/C][C]NA[/C][C]NA[/C][C]NA[/C][C]NA[/C][C]NA[/C][C]NA[/C][/ROW]
[ROW][C](p-val)[/C][C](NA )[/C][C](NA )[/C][C](NA )[/C][C](NA )[/C][C](NA )[/C][C](NA )[/C][/ROW]
[/TABLE]
Source: https://freestatistics.org/blog/index.php?pk=62370&T=1

Globally Unique Identifier (entire table): ba.freestatistics.org/blog/index.php?pk=62370&T=1

As an alternative you can also use a QR Code:  

The GUIDs for individual cells are displayed in the table below:

ARIMA Parameter Estimation and Backward Selection
Iterationar1ar2ma1sar1sar2sma1
Estimates ( 1 )0.41870.3511-0.4873-0.1046-0.3583-0.9998
(p-val)(0.196 )(0.0443 )(0.1007 )(0.5973 )(0.1179 )(0.0953 )
Estimates ( 2 )0.3940.3637-0.46590-0.308-0.9999
(p-val)(0.1988 )(0.0301 )(0.1008 )(NA )(0.1671 )(0.0211 )
Estimates ( 3 )00.3881-0.07070-0.3855-1
(p-val)(NA )(0.0086 )(0.6919 )(NA )(0.048 )(0.0283 )
Estimates ( 4 )00.374400-0.3508-0.9994
(p-val)(NA )(0.0087 )(NA )(NA )(0.0533 )(0.0209 )
Estimates ( 5 )00.3266000-0.9999
(p-val)(NA )(0.0195 )(NA )(NA )(NA )(0.0115 )
Estimates ( 6 )NANANANANANA
(p-val)(NA )(NA )(NA )(NA )(NA )(NA )
Estimates ( 7 )NANANANANANA
(p-val)(NA )(NA )(NA )(NA )(NA )(NA )
Estimates ( 8 )NANANANANANA
(p-val)(NA )(NA )(NA )(NA )(NA )(NA )
Estimates ( 9 )NANANANANANA
(p-val)(NA )(NA )(NA )(NA )(NA )(NA )
Estimates ( 10 )NANANANANANA
(p-val)(NA )(NA )(NA )(NA )(NA )(NA )
Estimates ( 11 )NANANANANANA
(p-val)(NA )(NA )(NA )(NA )(NA )(NA )


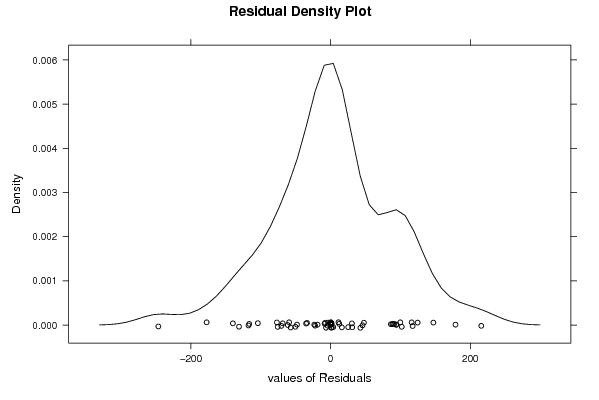
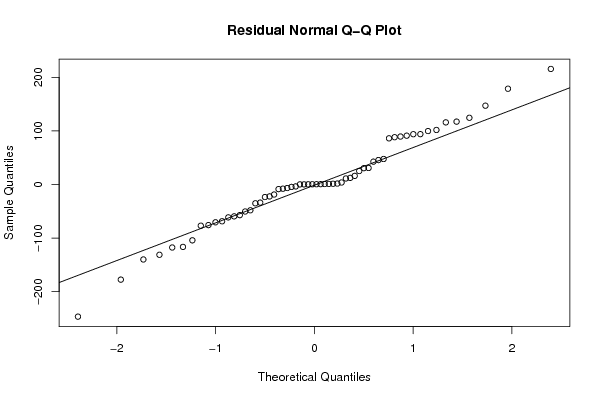
Estimated ARIMA Residuals
Value
-23.3833764438933
-8.55369733834187
-50.3530220901441
89.5334348554787
-68.566933218857
86.242991763873
91.1758987865468
-57.1463127299465
-104.147135994488
-61.3377568510805
93.9145973273952
-246.62370215812
-22.1898126799184
-35.0611543091103
-4.45883059064469
-177.531815680632
-70.5226787901682
30.5321994632175
-59.3912661927892
-131.127471928268
147.133618349113
45.6533837866806
-117.560608741138
117.383543115194
42.6617317274835
99.8038986352813
-7.78557246740002
-18.6816630538886
-116.476931578921
30.8852870895393
-33.7926636813331
215.707130826284
-6.57698871610461
-139.888187738920
25.1565120254716
12.3820264525211
178.787501612010
47.6458102812544
101.853055555168
88.3034658024652
116.005563628025
-75.7381551318659
16.1273126776685
93.9835410356264
-76.8562136700045
-48.1236206869778
11.2891165486600
124.570195756798

\begin{tabular}{lllllllll}
\hline
Estimated ARIMA Residuals \tabularnewline
Value \tabularnewline
-23.3833764438933 \tabularnewline
-8.55369733834187 \tabularnewline
-50.3530220901441 \tabularnewline
89.5334348554787 \tabularnewline
-68.566933218857 \tabularnewline
86.242991763873 \tabularnewline
91.1758987865468 \tabularnewline
-57.1463127299465 \tabularnewline
-104.147135994488 \tabularnewline
-61.3377568510805 \tabularnewline
93.9145973273952 \tabularnewline
-246.62370215812 \tabularnewline
-22.1898126799184 \tabularnewline
-35.0611543091103 \tabularnewline
-4.45883059064469 \tabularnewline
-177.531815680632 \tabularnewline
-70.5226787901682 \tabularnewline
30.5321994632175 \tabularnewline
-59.3912661927892 \tabularnewline
-131.127471928268 \tabularnewline
147.133618349113 \tabularnewline
45.6533837866806 \tabularnewline
-117.560608741138 \tabularnewline
117.383543115194 \tabularnewline
42.6617317274835 \tabularnewline
99.8038986352813 \tabularnewline
-7.78557246740002 \tabularnewline
-18.6816630538886 \tabularnewline
-116.476931578921 \tabularnewline
30.8852870895393 \tabularnewline
-33.7926636813331 \tabularnewline
215.707130826284 \tabularnewline
-6.57698871610461 \tabularnewline
-139.888187738920 \tabularnewline
25.1565120254716 \tabularnewline
12.3820264525211 \tabularnewline
178.787501612010 \tabularnewline
47.6458102812544 \tabularnewline
101.853055555168 \tabularnewline
88.3034658024652 \tabularnewline
116.005563628025 \tabularnewline
-75.7381551318659 \tabularnewline
16.1273126776685 \tabularnewline
93.9835410356264 \tabularnewline
-76.8562136700045 \tabularnewline
-48.1236206869778 \tabularnewline
11.2891165486600 \tabularnewline
124.570195756798 \tabularnewline
\hline
\end{tabular}
%Source: https://freestatistics.org/blog/index.php?pk=62370&T=2

[TABLE]
[ROW][C]Estimated ARIMA Residuals[/C][/ROW]
[ROW][C]Value[/C][/ROW]
[ROW][C]-23.3833764438933[/C][/ROW]
[ROW][C]-8.55369733834187[/C][/ROW]
[ROW][C]-50.3530220901441[/C][/ROW]
[ROW][C]89.5334348554787[/C][/ROW]
[ROW][C]-68.566933218857[/C][/ROW]
[ROW][C]86.242991763873[/C][/ROW]
[ROW][C]91.1758987865468[/C][/ROW]
[ROW][C]-57.1463127299465[/C][/ROW]
[ROW][C]-104.147135994488[/C][/ROW]
[ROW][C]-61.3377568510805[/C][/ROW]
[ROW][C]93.9145973273952[/C][/ROW]
[ROW][C]-246.62370215812[/C][/ROW]
[ROW][C]-22.1898126799184[/C][/ROW]
[ROW][C]-35.0611543091103[/C][/ROW]
[ROW][C]-4.45883059064469[/C][/ROW]
[ROW][C]-177.531815680632[/C][/ROW]
[ROW][C]-70.5226787901682[/C][/ROW]
[ROW][C]30.5321994632175[/C][/ROW]
[ROW][C]-59.3912661927892[/C][/ROW]
[ROW][C]-131.127471928268[/C][/ROW]
[ROW][C]147.133618349113[/C][/ROW]
[ROW][C]45.6533837866806[/C][/ROW]
[ROW][C]-117.560608741138[/C][/ROW]
[ROW][C]117.383543115194[/C][/ROW]
[ROW][C]42.6617317274835[/C][/ROW]
[ROW][C]99.8038986352813[/C][/ROW]
[ROW][C]-7.78557246740002[/C][/ROW]
[ROW][C]-18.6816630538886[/C][/ROW]
[ROW][C]-116.476931578921[/C][/ROW]
[ROW][C]30.8852870895393[/C][/ROW]
[ROW][C]-33.7926636813331[/C][/ROW]
[ROW][C]215.707130826284[/C][/ROW]
[ROW][C]-6.57698871610461[/C][/ROW]
[ROW][C]-139.888187738920[/C][/ROW]
[ROW][C]25.1565120254716[/C][/ROW]
[ROW][C]12.3820264525211[/C][/ROW]
[ROW][C]178.787501612010[/C][/ROW]
[ROW][C]47.6458102812544[/C][/ROW]
[ROW][C]101.853055555168[/C][/ROW]
[ROW][C]88.3034658024652[/C][/ROW]
[ROW][C]116.005563628025[/C][/ROW]
[ROW][C]-75.7381551318659[/C][/ROW]
[ROW][C]16.1273126776685[/C][/ROW]
[ROW][C]93.9835410356264[/C][/ROW]
[ROW][C]-76.8562136700045[/C][/ROW]
[ROW][C]-48.1236206869778[/C][/ROW]
[ROW][C]11.2891165486600[/C][/ROW]
[ROW][C]124.570195756798[/C][/ROW]
[/TABLE]
Source: https://freestatistics.org/blog/index.php?pk=62370&T=2

Globally Unique Identifier (entire table): ba.freestatistics.org/blog/index.php?pk=62370&T=2

As an alternative you can also use a QR Code:  

The GUIDs for individual cells are displayed in the table below:

Estimated ARIMA Residuals
Value
-23.3833764438933
-8.55369733834187
-50.3530220901441
89.5334348554787
-68.566933218857
86.242991763873
91.1758987865468
-57.1463127299465
-104.147135994488
-61.3377568510805
93.9145973273952
-246.62370215812
-22.1898126799184
-35.0611543091103
-4.45883059064469
-177.531815680632
-70.5226787901682
30.5321994632175
-59.3912661927892
-131.127471928268
147.133618349113
45.6533837866806
-117.560608741138
117.383543115194
42.6617317274835
99.8038986352813
-7.78557246740002
-18.6816630538886
-116.476931578921
30.8852870895393
-33.7926636813331
215.707130826284
-6.57698871610461
-139.888187738920
25.1565120254716
12.3820264525211
178.787501612010
47.6458102812544
101.853055555168
88.3034658024652
116.005563628025
-75.7381551318659
16.1273126776685
93.9835410356264
-76.8562136700045
-48.1236206869778
11.2891165486600
124.570195756798


Parameters (Session):
par1 = FALSE ; par2 = 1 ; par3 = 1 ; par4 = 1 ; par5 = 12 ; par6 = 2 ; par7 = 1 ; par8 = 2 ; par9 = 1 ;
Parameters (R input):
par1 = FALSE ; par2 = 1 ; par3 = 1 ; par4 = 1 ; par5 = 12 ; par6 = 2 ; par7 = 1 ; par8 = 2 ; par9 = 1 ;
R code (references can be found in the software module):
library(lattice)
if (par1 == 'TRUE') par1 <- TRUE
if (par1 == 'FALSE') par1 <- FALSE
par2 <- as.numeric(par2) #Box-Cox lambda transformation parameter
par3 <- as.numeric(par3) #degree of non-seasonal differencing
par4 <- as.numeric(par4) #degree of seasonal differencing
par5 <- as.numeric(par5) #seasonal period
par6 <- as.numeric(par6) #degree (p) of the non-seasonal AR(p) polynomial
par7 <- as.numeric(par7) #degree (q) of the non-seasonal MA(q) polynomial
par8 <- as.numeric(par8) #degree (P) of the seasonal AR(P) polynomial
par9 <- as.numeric(par9) #degree (Q) of the seasonal MA(Q) polynomial
armaGR <- function(arima.out, names, n){
try1 <- arima.out$coef
try2 <- sqrt(diag(arima.out$var.coef))
try.data.frame <- data.frame(matrix(NA,ncol=4,nrow=length(names)))
dimnames(try.data.frame) <- list(names,c('coef','std','tstat','pv'))
try.data.frame[,1] <- try1
for(i in 1:length(try2)) try.data.frame[which(rownames(try.data.frame)==names(try2)[i]),2] <- try2[i]
try.data.frame[,3] <- try.data.frame[,1] / try.data.frame[,2]
try.data.frame[,4] <- round((1-pt(abs(try.data.frame[,3]),df=n-(length(try2)+1)))*2,5)
vector <- rep(NA,length(names))
vector[is.na(try.data.frame[,4])] <- 0
maxi <- which.max(try.data.frame[,4])
continue <- max(try.data.frame[,4],na.rm=TRUE) > .05
vector[maxi] <- 0
list(summary=try.data.frame,next.vector=vector,continue=continue)
}
arimaSelect <- function(series, order=c(13,0,0), seasonal=list(order=c(2,0,0),period=12), include.mean=F){
nrc <- order[1]+order[3]+seasonal$order[1]+seasonal$order[3]
coeff <- matrix(NA, nrow=nrc*2, ncol=nrc)
pval <- matrix(NA, nrow=nrc*2, ncol=nrc)
mylist <- rep(list(NULL), nrc)
names <- NULL
if(order[1] > 0) names <- paste('ar',1:order[1],sep='')
if(order[3] > 0) names <- c( names , paste('ma',1:order[3],sep='') )
if(seasonal$order[1] > 0) names <- c(names, paste('sar',1:seasonal$order[1],sep=''))
if(seasonal$order[3] > 0) names <- c(names, paste('sma',1:seasonal$order[3],sep=''))
arima.out <- arima(series, order=order, seasonal=seasonal, include.mean=include.mean, method='ML')
mylist[[1]] <- arima.out
last.arma <- armaGR(arima.out, names, length(series))
mystop <- FALSE
i <- 1
coeff[i,] <- last.arma[[1]][,1]
pval [i,] <- last.arma[[1]][,4]
i <- 2
aic <- arima.out$aic
while(!mystop){
mylist[[i]] <- arima.out
arima.out <- arima(series, order=order, seasonal=seasonal, include.mean=include.mean, method='ML', fixed=last.arma$next.vector)
aic <- c(aic, arima.out$aic)
last.arma <- armaGR(arima.out, names, length(series))
mystop <- !last.arma$continue
coeff[i,] <- last.arma[[1]][,1]
pval [i,] <- last.arma[[1]][,4]
i <- i+1
}
list(coeff, pval, mylist, aic=aic)
}
arimaSelectplot <- function(arimaSelect.out,noms,choix){
noms <- names(arimaSelect.out[[3]][[1]]$coef)
coeff <- arimaSelect.out[[1]]
k <- min(which(is.na(coeff[,1])))-1
coeff <- coeff[1:k,]
pval <- arimaSelect.out[[2]][1:k,]
aic <- arimaSelect.out$aic[1:k]
coeff[coeff==0] <- NA
n <- ncol(coeff)
if(missing(choix)) choix <- k
layout(matrix(c(1,1,1,2,
3,3,3,2,
3,3,3,4,
5,6,7,7),nr=4),
widths=c(10,35,45,15),
heights=c(30,30,15,15))
couleurs <- rainbow(75)[1:50]#(50)
ticks <- pretty(coeff)
par(mar=c(1,1,3,1))
plot(aic,k:1-.5,type='o',pch=21,bg='blue',cex=2,axes=F,lty=2,xpd=NA)
points(aic[choix],k-choix+.5,pch=21,cex=4,bg=2,xpd=NA)
title('aic',line=2)
par(mar=c(3,0,0,0))
plot(0,axes=F,xlab='',ylab='',xlim=range(ticks),ylim=c(.1,1))
rect(xleft = min(ticks) + (0:49)/50*(max(ticks)-min(ticks)),
xright = min(ticks) + (1:50)/50*(max(ticks)-min(ticks)),
ytop = rep(1,50),
ybottom= rep(0,50),col=couleurs,border=NA)
axis(1,ticks)
rect(xleft=min(ticks),xright=max(ticks),ytop=1,ybottom=0)
text(mean(coeff,na.rm=T),.5,'coefficients',cex=2,font=2)
par(mar=c(1,1,3,1))
image(1:n,1:k,t(coeff[k:1,]),axes=F,col=couleurs,zlim=range(ticks))
for(i in 1:n) for(j in 1:k) if(!is.na(coeff[j,i])) {
if(pval[j,i]<.01) symb = 'green'
else if( (pval[j,i]<.05) & (pval[j,i]>=.01)) symb = 'orange'
else if( (pval[j,i]<.1) & (pval[j,i]>=.05)) symb = 'red'
else symb = 'black'
polygon(c(i+.5 ,i+.2 ,i+.5 ,i+.5),
c(k-j+0.5,k-j+0.5,k-j+0.8,k-j+0.5),
col=symb)
if(j==choix) {
rect(xleft=i-.5,
xright=i+.5,
ybottom=k-j+1.5,
ytop=k-j+.5,
lwd=4)
text(i,
k-j+1,
round(coeff[j,i],2),
cex=1.2,
font=2)
}
else{
rect(xleft=i-.5,xright=i+.5,ybottom=k-j+1.5,ytop=k-j+.5)
text(i,k-j+1,round(coeff[j,i],2),cex=1.2,font=1)
}
}
axis(3,1:n,noms)
par(mar=c(0.5,0,0,0.5))
plot(0,axes=F,xlab='',ylab='',type='n',xlim=c(0,8),ylim=c(-.2,.8))
cols <- c('green','orange','red','black')
niv <- c('0','0.01','0.05','0.1')
for(i in 0:3){
polygon(c(1+2*i ,1+2*i ,1+2*i-.5 ,1+2*i),
c(.4 ,.7 , .4 , .4),
col=cols[i+1])
text(2*i,0.5,niv[i+1],cex=1.5)
}
text(8,.5,1,cex=1.5)
text(4,0,'p-value',cex=2)
box()
residus <- arimaSelect.out[[3]][[choix]]$res
par(mar=c(1,2,4,1))
acf(residus,main='')
title('acf',line=.5)
par(mar=c(1,2,4,1))
pacf(residus,main='')
title('pacf',line=.5)
par(mar=c(2,2,4,1))
qqnorm(residus,main='')
title('qq-norm',line=.5)
qqline(residus)
residus
}
if (par2 == 0) x <- log(x)
if (par2 != 0) x <- x^par2
(selection <- arimaSelect(x, order=c(par6,par3,par7), seasonal=list(order=c(par8,par4,par9), period=par5)))
bitmap(file='test1.png')
resid <- arimaSelectplot(selection)
dev.off()
resid
bitmap(file='test2.png')
acf(resid,length(resid)/2, main='Residual Autocorrelation Function')
dev.off()
bitmap(file='test3.png')
pacf(resid,length(resid)/2, main='Residual Partial Autocorrelation Function')
dev.off()
bitmap(file='test4.png')
cpgram(resid, main='Residual Cumulative Periodogram')
dev.off()
bitmap(file='test5.png')
hist(resid, main='Residual Histogram', xlab='values of Residuals')
dev.off()
bitmap(file='test6.png')
densityplot(~resid,col='black',main='Residual Density Plot', xlab='values of Residuals')
dev.off()
bitmap(file='test7.png')
qqnorm(resid, main='Residual Normal Q-Q Plot')
qqline(resid)
dev.off()
ncols <- length(selection[[1]][1,])
nrows <- length(selection[[2]][,1])-1
load(file='createtable')
a<-table.start()
a<-table.row.start(a)
a<-table.element(a,'ARIMA Parameter Estimation and Backward Selection', ncols+1,TRUE)
a<-table.row.end(a)
a<-table.row.start(a)
a<-table.element(a,'Iteration', header=TRUE)
for (i in 1:ncols) {
a<-table.element(a,names(selection[[3]][[1]]$coef)[i],header=TRUE)
}
a<-table.row.end(a)
for (j in 1:nrows) {
a<-table.row.start(a)
mydum <- 'Estimates ('
mydum <- paste(mydum,j)
mydum <- paste(mydum,')')
a<-table.element(a,mydum, header=TRUE)
for (i in 1:ncols) {
a<-table.element(a,round(selection[[1]][j,i],4))
}
a<-table.row.end(a)
a<-table.row.start(a)
a<-table.element(a,'(p-val)', header=TRUE)
for (i in 1:ncols) {
mydum <- '('
mydum <- paste(mydum,round(selection[[2]][j,i],4),sep='')
mydum <- paste(mydum,')')
a<-table.element(a,mydum)
}
a<-table.row.end(a)
}
a<-table.end(a)
table.save(a,file='mytable.tab')
a<-table.start()
a<-table.row.start(a)
a<-table.element(a,'Estimated ARIMA Residuals', 1,TRUE)
a<-table.row.end(a)
a<-table.row.start(a)
a<-table.element(a,'Value', 1,TRUE)
a<-table.row.end(a)
for (i in (par4*par5+par3):length(resid)) {
a<-table.row.start(a)
a<-table.element(a,resid[i])
a<-table.row.end(a)
}
a<-table.end(a)
table.save(a,file='mytable1.tab')