Free Statistics

of Irreproducible Research!

Author's title

Author*The author of this computation has been verified*
R Software Modulerwasp_autocorrelation.wasp
Title produced by software(Partial) Autocorrelation Function
Date of computationWed, 02 Dec 2009 08:27:43 -0700
Cite this page as followsStatistical Computations at FreeStatistics.org, Office for Research Development and Education, URL https://freestatistics.org/blog/index.php?v=date/2009/Dec/02/t12597677850ers9sym1c0i7l9.htm/, Retrieved Sun, 28 Apr 2024 08:15:00 +0000
Statistical Computations at FreeStatistics.org, Office for Research Development and Education, URL https://freestatistics.org/blog/index.php?pk=62372, Retrieved Sun, 28 Apr 2024 08:15:00 +0000
QR Codes:

Original text written by user:
IsPrivate?No (this computation is public)
User-defined keywords
Estimated Impact104
Family? (F = Feedback message, R = changed R code, M = changed R Module, P = changed Parameters, D = changed Data)
-     [(Partial) Autocorrelation Function] [ACF] [2009-11-27 19:44:19] [f84db15a18b564cd160ebc7b4eade151]
-   P     [(Partial) Autocorrelation Function] [Autocorrelatie] [2009-12-02 15:27:43] [762da55b2e2304daaed24a7cc507d14d] [Current]
Feedback Forum

Post a new message
Dataseries X:
112
118
132
129
121
135
148
148
136
119
104
118
115
126
141
135
125
149
170
170
158
133
114
140
145
150
178
163
172
178
199
199
184
162
146
166
171
180
193
181
183
218
230
242
209
191
172
194
196
196
236
235
229
243
264
272
237
211
180
201
204
188
235
227
234
264
302
293
259
229
203
229
242
233
267
269
270
315
364
347
312
274
237
278
284
277
317
313
318
374
413
405
355
306
271
306
315
301
356
348
355
422
465
467
404
347
305
336
340
318
362
348
363
435
491
505
404
359
310
337
360
342
406
396
420
472
548
559
463
407
362
405
417
391
419
461
472
535
622
606
508
461
390
432


Summary of computational transaction
Raw Inputview raw input (R code)
Raw Outputview raw output of R engine
Computing time1 seconds
R Server'Gwilym Jenkins' @ 72.249.127.135

\begin{tabular}{lllllllll}
\hline
Summary of computational transaction \tabularnewline
Raw Input & view raw input (R code)  \tabularnewline
Raw Output & view raw output of R engine  \tabularnewline
Computing time & 1 seconds \tabularnewline
R Server & 'Gwilym Jenkins' @ 72.249.127.135 \tabularnewline
\hline
\end{tabular}
%Source: https://freestatistics.org/blog/index.php?pk=62372&T=0

[TABLE]
[ROW][C]Summary of computational transaction[/C][/ROW]
[ROW][C]Raw Input[/C][C]view raw input (R code) [/C][/ROW]
[ROW][C]Raw Output[/C][C]view raw output of R engine [/C][/ROW]
[ROW][C]Computing time[/C][C]1 seconds[/C][/ROW]
[ROW][C]R Server[/C][C]'Gwilym Jenkins' @ 72.249.127.135[/C][/ROW]
[/TABLE]
Source: https://freestatistics.org/blog/index.php?pk=62372&T=0

Globally Unique Identifier (entire table): ba.freestatistics.org/blog/index.php?pk=62372&T=0

As an alternative you can also use a QR Code:  

The GUIDs for individual cells are displayed in the table below:

Summary of computational transaction
Raw Inputview raw input (R code)
Raw Outputview raw output of R engine
Computing time1 seconds
R Server'Gwilym Jenkins' @ 72.249.127.135


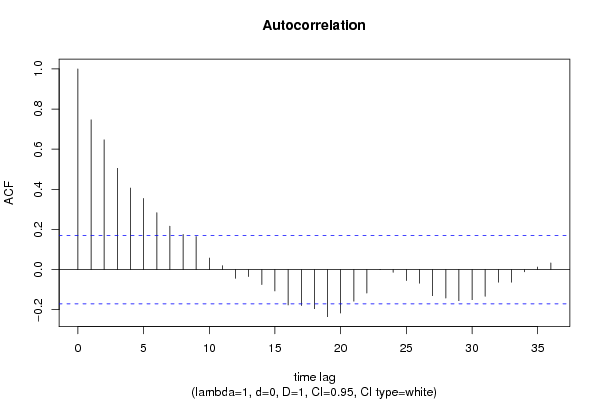
Autocorrelation Function
Time lag kACF(k)T-STATP-value
10.746468.57620
20.6470837.43440
30.5048925.80080
40.406464.66994e-06
50.3547824.07613.9e-05
60.2833783.25580.000719
70.2162762.48480.007106
80.1750252.01090.023187
90.1647321.89260.030298
100.0572010.65720.256103
110.019070.21910.413455
12-0.043736-0.50250.30808
13-0.034816-0.40.344899
14-0.074511-0.85610.196757
15-0.106786-1.22690.111027
16-0.176029-2.02240.022577
17-0.179444-2.06170.020601
18-0.195169-2.24230.013305
19-0.234685-2.69630.003962
20-0.216612-2.48870.007033
21-0.15745-1.8090.036367
22-0.117115-1.34560.090377
23-0.000519-0.0060.497626
24-0.013841-0.1590.436947
25-0.054977-0.63160.264357
26-0.067895-0.78010.218376
27-0.130168-1.49550.068584
28-0.142109-1.63270.052456
29-0.155424-1.78570.038223
30-0.149901-1.72220.043685
31-0.133064-1.52880.064355
32-0.063022-0.72410.235154
33-0.062855-0.72210.235741
34-0.010945-0.12570.450062
350.012290.14120.443962
360.0330210.37940.352508

\begin{tabular}{lllllllll}
\hline
Autocorrelation Function \tabularnewline
Time lag k & ACF(k) & T-STAT & P-value \tabularnewline
1 & 0.74646 & 8.5762 & 0 \tabularnewline
2 & 0.647083 & 7.4344 & 0 \tabularnewline
3 & 0.504892 & 5.8008 & 0 \tabularnewline
4 & 0.40646 & 4.6699 & 4e-06 \tabularnewline
5 & 0.354782 & 4.0761 & 3.9e-05 \tabularnewline
6 & 0.283378 & 3.2558 & 0.000719 \tabularnewline
7 & 0.216276 & 2.4848 & 0.007106 \tabularnewline
8 & 0.175025 & 2.0109 & 0.023187 \tabularnewline
9 & 0.164732 & 1.8926 & 0.030298 \tabularnewline
10 & 0.057201 & 0.6572 & 0.256103 \tabularnewline
11 & 0.01907 & 0.2191 & 0.413455 \tabularnewline
12 & -0.043736 & -0.5025 & 0.30808 \tabularnewline
13 & -0.034816 & -0.4 & 0.344899 \tabularnewline
14 & -0.074511 & -0.8561 & 0.196757 \tabularnewline
15 & -0.106786 & -1.2269 & 0.111027 \tabularnewline
16 & -0.176029 & -2.0224 & 0.022577 \tabularnewline
17 & -0.179444 & -2.0617 & 0.020601 \tabularnewline
18 & -0.195169 & -2.2423 & 0.013305 \tabularnewline
19 & -0.234685 & -2.6963 & 0.003962 \tabularnewline
20 & -0.216612 & -2.4887 & 0.007033 \tabularnewline
21 & -0.15745 & -1.809 & 0.036367 \tabularnewline
22 & -0.117115 & -1.3456 & 0.090377 \tabularnewline
23 & -0.000519 & -0.006 & 0.497626 \tabularnewline
24 & -0.013841 & -0.159 & 0.436947 \tabularnewline
25 & -0.054977 & -0.6316 & 0.264357 \tabularnewline
26 & -0.067895 & -0.7801 & 0.218376 \tabularnewline
27 & -0.130168 & -1.4955 & 0.068584 \tabularnewline
28 & -0.142109 & -1.6327 & 0.052456 \tabularnewline
29 & -0.155424 & -1.7857 & 0.038223 \tabularnewline
30 & -0.149901 & -1.7222 & 0.043685 \tabularnewline
31 & -0.133064 & -1.5288 & 0.064355 \tabularnewline
32 & -0.063022 & -0.7241 & 0.235154 \tabularnewline
33 & -0.062855 & -0.7221 & 0.235741 \tabularnewline
34 & -0.010945 & -0.1257 & 0.450062 \tabularnewline
35 & 0.01229 & 0.1412 & 0.443962 \tabularnewline
36 & 0.033021 & 0.3794 & 0.352508 \tabularnewline
\hline
\end{tabular}
%Source: https://freestatistics.org/blog/index.php?pk=62372&T=1

[TABLE]
[ROW][C]Autocorrelation Function[/C][/ROW]
[ROW][C]Time lag k[/C][C]ACF(k)[/C][C]T-STAT[/C][C]P-value[/C][/ROW]
[ROW][C]1[/C][C]0.74646[/C][C]8.5762[/C][C]0[/C][/ROW]
[ROW][C]2[/C][C]0.647083[/C][C]7.4344[/C][C]0[/C][/ROW]
[ROW][C]3[/C][C]0.504892[/C][C]5.8008[/C][C]0[/C][/ROW]
[ROW][C]4[/C][C]0.40646[/C][C]4.6699[/C][C]4e-06[/C][/ROW]
[ROW][C]5[/C][C]0.354782[/C][C]4.0761[/C][C]3.9e-05[/C][/ROW]
[ROW][C]6[/C][C]0.283378[/C][C]3.2558[/C][C]0.000719[/C][/ROW]
[ROW][C]7[/C][C]0.216276[/C][C]2.4848[/C][C]0.007106[/C][/ROW]
[ROW][C]8[/C][C]0.175025[/C][C]2.0109[/C][C]0.023187[/C][/ROW]
[ROW][C]9[/C][C]0.164732[/C][C]1.8926[/C][C]0.030298[/C][/ROW]
[ROW][C]10[/C][C]0.057201[/C][C]0.6572[/C][C]0.256103[/C][/ROW]
[ROW][C]11[/C][C]0.01907[/C][C]0.2191[/C][C]0.413455[/C][/ROW]
[ROW][C]12[/C][C]-0.043736[/C][C]-0.5025[/C][C]0.30808[/C][/ROW]
[ROW][C]13[/C][C]-0.034816[/C][C]-0.4[/C][C]0.344899[/C][/ROW]
[ROW][C]14[/C][C]-0.074511[/C][C]-0.8561[/C][C]0.196757[/C][/ROW]
[ROW][C]15[/C][C]-0.106786[/C][C]-1.2269[/C][C]0.111027[/C][/ROW]
[ROW][C]16[/C][C]-0.176029[/C][C]-2.0224[/C][C]0.022577[/C][/ROW]
[ROW][C]17[/C][C]-0.179444[/C][C]-2.0617[/C][C]0.020601[/C][/ROW]
[ROW][C]18[/C][C]-0.195169[/C][C]-2.2423[/C][C]0.013305[/C][/ROW]
[ROW][C]19[/C][C]-0.234685[/C][C]-2.6963[/C][C]0.003962[/C][/ROW]
[ROW][C]20[/C][C]-0.216612[/C][C]-2.4887[/C][C]0.007033[/C][/ROW]
[ROW][C]21[/C][C]-0.15745[/C][C]-1.809[/C][C]0.036367[/C][/ROW]
[ROW][C]22[/C][C]-0.117115[/C][C]-1.3456[/C][C]0.090377[/C][/ROW]
[ROW][C]23[/C][C]-0.000519[/C][C]-0.006[/C][C]0.497626[/C][/ROW]
[ROW][C]24[/C][C]-0.013841[/C][C]-0.159[/C][C]0.436947[/C][/ROW]
[ROW][C]25[/C][C]-0.054977[/C][C]-0.6316[/C][C]0.264357[/C][/ROW]
[ROW][C]26[/C][C]-0.067895[/C][C]-0.7801[/C][C]0.218376[/C][/ROW]
[ROW][C]27[/C][C]-0.130168[/C][C]-1.4955[/C][C]0.068584[/C][/ROW]
[ROW][C]28[/C][C]-0.142109[/C][C]-1.6327[/C][C]0.052456[/C][/ROW]
[ROW][C]29[/C][C]-0.155424[/C][C]-1.7857[/C][C]0.038223[/C][/ROW]
[ROW][C]30[/C][C]-0.149901[/C][C]-1.7222[/C][C]0.043685[/C][/ROW]
[ROW][C]31[/C][C]-0.133064[/C][C]-1.5288[/C][C]0.064355[/C][/ROW]
[ROW][C]32[/C][C]-0.063022[/C][C]-0.7241[/C][C]0.235154[/C][/ROW]
[ROW][C]33[/C][C]-0.062855[/C][C]-0.7221[/C][C]0.235741[/C][/ROW]
[ROW][C]34[/C][C]-0.010945[/C][C]-0.1257[/C][C]0.450062[/C][/ROW]
[ROW][C]35[/C][C]0.01229[/C][C]0.1412[/C][C]0.443962[/C][/ROW]
[ROW][C]36[/C][C]0.033021[/C][C]0.3794[/C][C]0.352508[/C][/ROW]
[/TABLE]
Source: https://freestatistics.org/blog/index.php?pk=62372&T=1

Globally Unique Identifier (entire table): ba.freestatistics.org/blog/index.php?pk=62372&T=1

As an alternative you can also use a QR Code:  

The GUIDs for individual cells are displayed in the table below:

Autocorrelation Function
Time lag kACF(k)T-STATP-value
10.746468.57620
20.6470837.43440
30.5048925.80080
40.406464.66994e-06
50.3547824.07613.9e-05
60.2833783.25580.000719
70.2162762.48480.007106
80.1750252.01090.023187
90.1647321.89260.030298
100.0572010.65720.256103
110.019070.21910.413455
12-0.043736-0.50250.30808
13-0.034816-0.40.344899
14-0.074511-0.85610.196757
15-0.106786-1.22690.111027
16-0.176029-2.02240.022577
17-0.179444-2.06170.020601
18-0.195169-2.24230.013305
19-0.234685-2.69630.003962
20-0.216612-2.48870.007033
21-0.15745-1.8090.036367
22-0.117115-1.34560.090377
23-0.000519-0.0060.497626
24-0.013841-0.1590.436947
25-0.054977-0.63160.264357
26-0.067895-0.78010.218376
27-0.130168-1.49550.068584
28-0.142109-1.63270.052456
29-0.155424-1.78570.038223
30-0.149901-1.72220.043685
31-0.133064-1.52880.064355
32-0.063022-0.72410.235154
33-0.062855-0.72210.235741
34-0.010945-0.12570.450062
350.012290.14120.443962
360.0330210.37940.352508


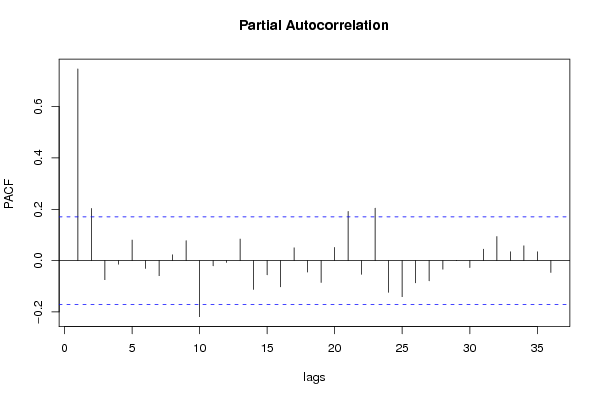
Partial Autocorrelation Function
Time lag kPACF(k)T-STATP-value
10.746468.57620
20.2029832.33210.010605
3-0.074439-0.85520.196985
4-0.014184-0.1630.435399
50.080050.91970.179701
6-0.030608-0.35170.362828
7-0.059-0.67790.249525
80.0224550.2580.398408
90.0777070.89280.186798
10-0.218328-2.50840.00667
11-0.020258-0.23280.408158
12-0.007385-0.08480.466257
130.0840630.96580.167954
14-0.112124-1.28820.099963
15-0.05542-0.63670.262704
16-0.101884-1.17060.121943
170.0497290.57130.28437
18-0.044607-0.51250.304582
19-0.085293-0.97990.164454
200.0514880.59160.277581
210.1914152.19920.014803
22-0.053559-0.61530.269693
230.2043722.34810.010179
24-0.123419-1.4180.079277
25-0.140721-1.61680.054159
26-0.086615-0.99510.160746
27-0.078695-0.90410.183786
28-0.033301-0.38260.351317
290.0009930.01140.495457
30-0.027349-0.31420.376928
310.0444920.51120.305042
320.0936431.07590.141972
330.0344680.3960.346368
340.0576040.66180.25462
350.0341940.39290.347528
36-0.046152-0.53020.298417

\begin{tabular}{lllllllll}
\hline
Partial Autocorrelation Function \tabularnewline
Time lag k & PACF(k) & T-STAT & P-value \tabularnewline
1 & 0.74646 & 8.5762 & 0 \tabularnewline
2 & 0.202983 & 2.3321 & 0.010605 \tabularnewline
3 & -0.074439 & -0.8552 & 0.196985 \tabularnewline
4 & -0.014184 & -0.163 & 0.435399 \tabularnewline
5 & 0.08005 & 0.9197 & 0.179701 \tabularnewline
6 & -0.030608 & -0.3517 & 0.362828 \tabularnewline
7 & -0.059 & -0.6779 & 0.249525 \tabularnewline
8 & 0.022455 & 0.258 & 0.398408 \tabularnewline
9 & 0.077707 & 0.8928 & 0.186798 \tabularnewline
10 & -0.218328 & -2.5084 & 0.00667 \tabularnewline
11 & -0.020258 & -0.2328 & 0.408158 \tabularnewline
12 & -0.007385 & -0.0848 & 0.466257 \tabularnewline
13 & 0.084063 & 0.9658 & 0.167954 \tabularnewline
14 & -0.112124 & -1.2882 & 0.099963 \tabularnewline
15 & -0.05542 & -0.6367 & 0.262704 \tabularnewline
16 & -0.101884 & -1.1706 & 0.121943 \tabularnewline
17 & 0.049729 & 0.5713 & 0.28437 \tabularnewline
18 & -0.044607 & -0.5125 & 0.304582 \tabularnewline
19 & -0.085293 & -0.9799 & 0.164454 \tabularnewline
20 & 0.051488 & 0.5916 & 0.277581 \tabularnewline
21 & 0.191415 & 2.1992 & 0.014803 \tabularnewline
22 & -0.053559 & -0.6153 & 0.269693 \tabularnewline
23 & 0.204372 & 2.3481 & 0.010179 \tabularnewline
24 & -0.123419 & -1.418 & 0.079277 \tabularnewline
25 & -0.140721 & -1.6168 & 0.054159 \tabularnewline
26 & -0.086615 & -0.9951 & 0.160746 \tabularnewline
27 & -0.078695 & -0.9041 & 0.183786 \tabularnewline
28 & -0.033301 & -0.3826 & 0.351317 \tabularnewline
29 & 0.000993 & 0.0114 & 0.495457 \tabularnewline
30 & -0.027349 & -0.3142 & 0.376928 \tabularnewline
31 & 0.044492 & 0.5112 & 0.305042 \tabularnewline
32 & 0.093643 & 1.0759 & 0.141972 \tabularnewline
33 & 0.034468 & 0.396 & 0.346368 \tabularnewline
34 & 0.057604 & 0.6618 & 0.25462 \tabularnewline
35 & 0.034194 & 0.3929 & 0.347528 \tabularnewline
36 & -0.046152 & -0.5302 & 0.298417 \tabularnewline
\hline
\end{tabular}
%Source: https://freestatistics.org/blog/index.php?pk=62372&T=2

[TABLE]
[ROW][C]Partial Autocorrelation Function[/C][/ROW]
[ROW][C]Time lag k[/C][C]PACF(k)[/C][C]T-STAT[/C][C]P-value[/C][/ROW]
[ROW][C]1[/C][C]0.74646[/C][C]8.5762[/C][C]0[/C][/ROW]
[ROW][C]2[/C][C]0.202983[/C][C]2.3321[/C][C]0.010605[/C][/ROW]
[ROW][C]3[/C][C]-0.074439[/C][C]-0.8552[/C][C]0.196985[/C][/ROW]
[ROW][C]4[/C][C]-0.014184[/C][C]-0.163[/C][C]0.435399[/C][/ROW]
[ROW][C]5[/C][C]0.08005[/C][C]0.9197[/C][C]0.179701[/C][/ROW]
[ROW][C]6[/C][C]-0.030608[/C][C]-0.3517[/C][C]0.362828[/C][/ROW]
[ROW][C]7[/C][C]-0.059[/C][C]-0.6779[/C][C]0.249525[/C][/ROW]
[ROW][C]8[/C][C]0.022455[/C][C]0.258[/C][C]0.398408[/C][/ROW]
[ROW][C]9[/C][C]0.077707[/C][C]0.8928[/C][C]0.186798[/C][/ROW]
[ROW][C]10[/C][C]-0.218328[/C][C]-2.5084[/C][C]0.00667[/C][/ROW]
[ROW][C]11[/C][C]-0.020258[/C][C]-0.2328[/C][C]0.408158[/C][/ROW]
[ROW][C]12[/C][C]-0.007385[/C][C]-0.0848[/C][C]0.466257[/C][/ROW]
[ROW][C]13[/C][C]0.084063[/C][C]0.9658[/C][C]0.167954[/C][/ROW]
[ROW][C]14[/C][C]-0.112124[/C][C]-1.2882[/C][C]0.099963[/C][/ROW]
[ROW][C]15[/C][C]-0.05542[/C][C]-0.6367[/C][C]0.262704[/C][/ROW]
[ROW][C]16[/C][C]-0.101884[/C][C]-1.1706[/C][C]0.121943[/C][/ROW]
[ROW][C]17[/C][C]0.049729[/C][C]0.5713[/C][C]0.28437[/C][/ROW]
[ROW][C]18[/C][C]-0.044607[/C][C]-0.5125[/C][C]0.304582[/C][/ROW]
[ROW][C]19[/C][C]-0.085293[/C][C]-0.9799[/C][C]0.164454[/C][/ROW]
[ROW][C]20[/C][C]0.051488[/C][C]0.5916[/C][C]0.277581[/C][/ROW]
[ROW][C]21[/C][C]0.191415[/C][C]2.1992[/C][C]0.014803[/C][/ROW]
[ROW][C]22[/C][C]-0.053559[/C][C]-0.6153[/C][C]0.269693[/C][/ROW]
[ROW][C]23[/C][C]0.204372[/C][C]2.3481[/C][C]0.010179[/C][/ROW]
[ROW][C]24[/C][C]-0.123419[/C][C]-1.418[/C][C]0.079277[/C][/ROW]
[ROW][C]25[/C][C]-0.140721[/C][C]-1.6168[/C][C]0.054159[/C][/ROW]
[ROW][C]26[/C][C]-0.086615[/C][C]-0.9951[/C][C]0.160746[/C][/ROW]
[ROW][C]27[/C][C]-0.078695[/C][C]-0.9041[/C][C]0.183786[/C][/ROW]
[ROW][C]28[/C][C]-0.033301[/C][C]-0.3826[/C][C]0.351317[/C][/ROW]
[ROW][C]29[/C][C]0.000993[/C][C]0.0114[/C][C]0.495457[/C][/ROW]
[ROW][C]30[/C][C]-0.027349[/C][C]-0.3142[/C][C]0.376928[/C][/ROW]
[ROW][C]31[/C][C]0.044492[/C][C]0.5112[/C][C]0.305042[/C][/ROW]
[ROW][C]32[/C][C]0.093643[/C][C]1.0759[/C][C]0.141972[/C][/ROW]
[ROW][C]33[/C][C]0.034468[/C][C]0.396[/C][C]0.346368[/C][/ROW]
[ROW][C]34[/C][C]0.057604[/C][C]0.6618[/C][C]0.25462[/C][/ROW]
[ROW][C]35[/C][C]0.034194[/C][C]0.3929[/C][C]0.347528[/C][/ROW]
[ROW][C]36[/C][C]-0.046152[/C][C]-0.5302[/C][C]0.298417[/C][/ROW]
[/TABLE]
Source: https://freestatistics.org/blog/index.php?pk=62372&T=2

Globally Unique Identifier (entire table): ba.freestatistics.org/blog/index.php?pk=62372&T=2

As an alternative you can also use a QR Code:  

The GUIDs for individual cells are displayed in the table below:

Partial Autocorrelation Function
Time lag kPACF(k)T-STATP-value
10.746468.57620
20.2029832.33210.010605
3-0.074439-0.85520.196985
4-0.014184-0.1630.435399
50.080050.91970.179701
6-0.030608-0.35170.362828
7-0.059-0.67790.249525
80.0224550.2580.398408
90.0777070.89280.186798
10-0.218328-2.50840.00667
11-0.020258-0.23280.408158
12-0.007385-0.08480.466257
130.0840630.96580.167954
14-0.112124-1.28820.099963
15-0.05542-0.63670.262704
16-0.101884-1.17060.121943
170.0497290.57130.28437
18-0.044607-0.51250.304582
19-0.085293-0.97990.164454
200.0514880.59160.277581
210.1914152.19920.014803
22-0.053559-0.61530.269693
230.2043722.34810.010179
24-0.123419-1.4180.079277
25-0.140721-1.61680.054159
26-0.086615-0.99510.160746
27-0.078695-0.90410.183786
28-0.033301-0.38260.351317
290.0009930.01140.495457
30-0.027349-0.31420.376928
310.0444920.51120.305042
320.0936431.07590.141972
330.0344680.3960.346368
340.0576040.66180.25462
350.0341940.39290.347528
36-0.046152-0.53020.298417


Parameters (Session):
par1 = 36 ; par2 = 1 ; par3 = 0 ; par4 = 1 ; par5 = 12 ; par6 = White Noise ; par7 = 0.95 ;
Parameters (R input):
par1 = 36 ; par2 = 1 ; par3 = 0 ; par4 = 1 ; par5 = 12 ; par6 = White Noise ; par7 = 0.95 ;
R code (references can be found in the software module):
if (par1 == 'Default') {
par1 = 10*log10(length(x))
} else {
par1 <- as.numeric(par1)
}
par2 <- as.numeric(par2)
par3 <- as.numeric(par3)
par4 <- as.numeric(par4)
par5 <- as.numeric(par5)
if (par6 == 'White Noise') par6 <- 'white' else par6 <- 'ma'
par7 <- as.numeric(par7)
if (par2 == 0) {
x <- log(x)
} else {
x <- (x ^ par2 - 1) / par2
}
if (par3 > 0) x <- diff(x,lag=1,difference=par3)
if (par4 > 0) x <- diff(x,lag=par5,difference=par4)
bitmap(file='pic1.png')
racf <- acf(x, par1, main='Autocorrelation', xlab='time lag', ylab='ACF', ci.type=par6, ci=par7, sub=paste('(lambda=',par2,', d=',par3,', D=',par4,', CI=', par7, ', CI type=',par6,')',sep=''))
dev.off()
bitmap(file='pic2.png')
rpacf <- pacf(x,par1,main='Partial Autocorrelation',xlab='lags',ylab='PACF')
dev.off()
(myacf <- c(racf$acf))
(mypacf <- c(rpacf$acf))
lengthx <- length(x)
sqrtn <- sqrt(lengthx)
load(file='createtable')
a<-table.start()
a<-table.row.start(a)
a<-table.element(a,'Autocorrelation Function',4,TRUE)
a<-table.row.end(a)
a<-table.row.start(a)
a<-table.element(a,'Time lag k',header=TRUE)
a<-table.element(a,hyperlink('basics.htm','ACF(k)','click here for more information about the Autocorrelation Function'),header=TRUE)
a<-table.element(a,'T-STAT',header=TRUE)
a<-table.element(a,'P-value',header=TRUE)
a<-table.row.end(a)
for (i in 2:(par1+1)) {
a<-table.row.start(a)
a<-table.element(a,i-1,header=TRUE)
a<-table.element(a,round(myacf[i],6))
mytstat <- myacf[i]*sqrtn
a<-table.element(a,round(mytstat,4))
a<-table.element(a,round(1-pt(abs(mytstat),lengthx),6))
a<-table.row.end(a)
}
a<-table.end(a)
table.save(a,file='mytable.tab')
a<-table.start()
a<-table.row.start(a)
a<-table.element(a,'Partial Autocorrelation Function',4,TRUE)
a<-table.row.end(a)
a<-table.row.start(a)
a<-table.element(a,'Time lag k',header=TRUE)
a<-table.element(a,hyperlink('basics.htm','PACF(k)','click here for more information about the Partial Autocorrelation Function'),header=TRUE)
a<-table.element(a,'T-STAT',header=TRUE)
a<-table.element(a,'P-value',header=TRUE)
a<-table.row.end(a)
for (i in 1:par1) {
a<-table.row.start(a)
a<-table.element(a,i,header=TRUE)
a<-table.element(a,round(mypacf[i],6))
mytstat <- mypacf[i]*sqrtn
a<-table.element(a,round(mytstat,4))
a<-table.element(a,round(1-pt(abs(mytstat),lengthx),6))
a<-table.row.end(a)
}
a<-table.end(a)
table.save(a,file='mytable1.tab')